US Hard Coatings Market Segmentation
US Hard Coatings Market By Material (USD Million, 2025-2035)
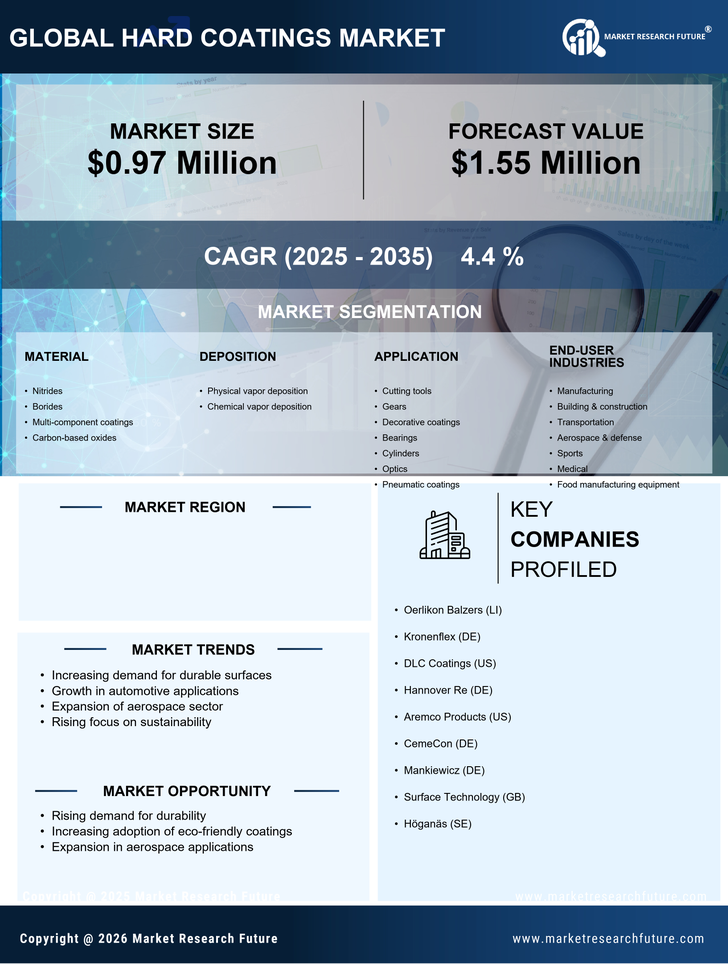
- Nitrides
- Borides
- Multi-component coatings
- Carbon-based oxides
US Hard Coatings Market By Deposition (USD Million, 2025-2035)
- Physical vapor deposition
- Chemical vapor deposition
US Hard Coatings Market By Application (USD Million, 2025-2035)
- Cutting tools
- Gears
- Decorative coatings
- Bearings
- Cylinders
- Optics
- Pneumatic coatings
US Hard Coatings Market By End-User Industries (USD Million, 2025-2035)
- Manufacturing
- Building & construction
- Transportation
- Aerospace & defense
- Sports
- Medical
- Food manufacturing equipment