US Infantry Fighting Vehicle Market Segmentation
US Infantry Fighting Vehicle Market By Type (USD Billion, 2025-2035)
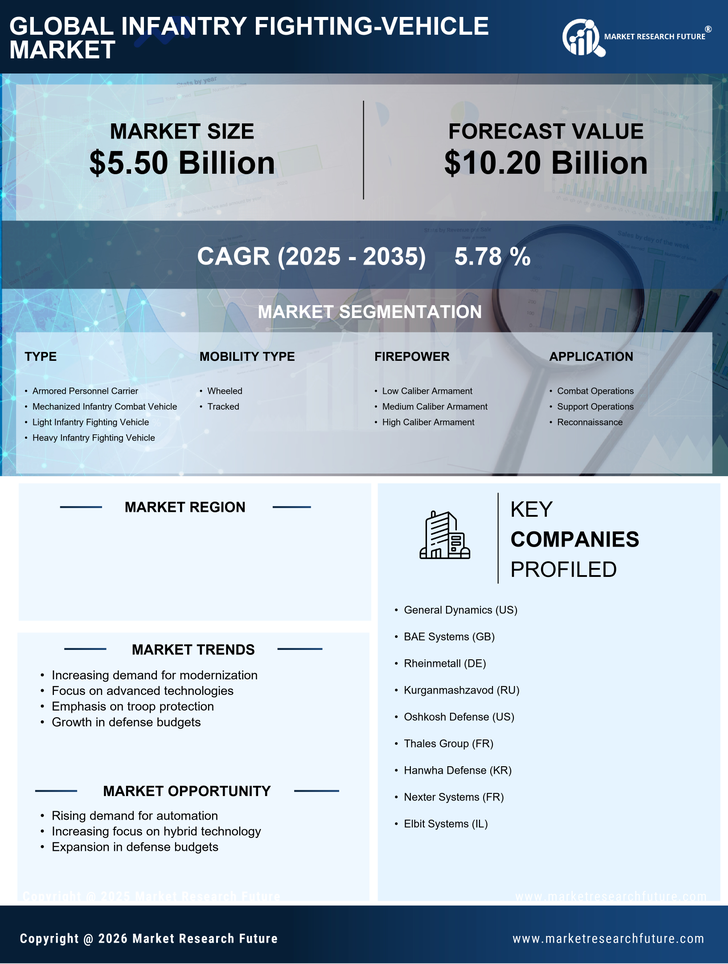
- Armored Personnel Carrier
- Mechanized Infantry Combat Vehicle
- Light Infantry Fighting Vehicle
- Heavy Infantry Fighting Vehicle
US Infantry Fighting Vehicle Market By Mobility Type (USD Billion, 2025-2035)
- Wheeled
- Tracked
US Infantry Fighting Vehicle Market By Firepower (USD Billion, 2025-2035)
- Low Caliber Armament
- Medium Caliber Armament
- High Caliber Armament
US Infantry Fighting Vehicle Market By Application (USD Billion, 2025-2035)
- Combat Operations
- Support Operations
- Reconnaissance
US Infantry Fighting Vehicle Market By End Use (USD Billion, 2025-2035)
- Military
- Paramilitary
- Government