US LED OLED Display Market Segmentation
US LED OLED Display Market By Type (USD Billion, 2025-2035)
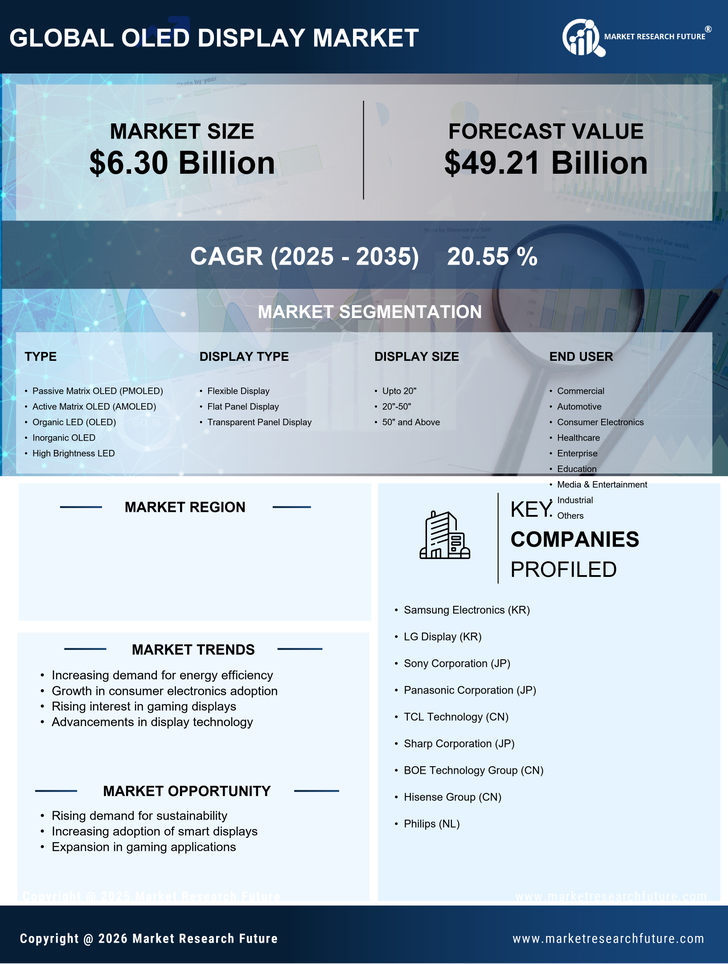
- Passive Matrix OLED (PMOLED)
- Active Matrix OLED (AMOLED)
- Organic LED (OLED)
- Inorganic OLED
- High Brightness LED
US LED OLED Display Market By Display Type (USD Billion, 2025-2035)
- Flexible Display
- Flat Panel Display
- Transparent Panel Display
US LED OLED Display Market By Display Size (USD Billion, 2025-2035)
- Upto 20"
- 20"-50"
- 50" and Above
US LED OLED Display Market By End User (USD Billion, 2025-2035)
- Commercial
- Automotive
- Consumer Electronics
- US LED OLED Display Market
- Enterprise
- Education
- Media & Entertainment
- Industrial
- Others