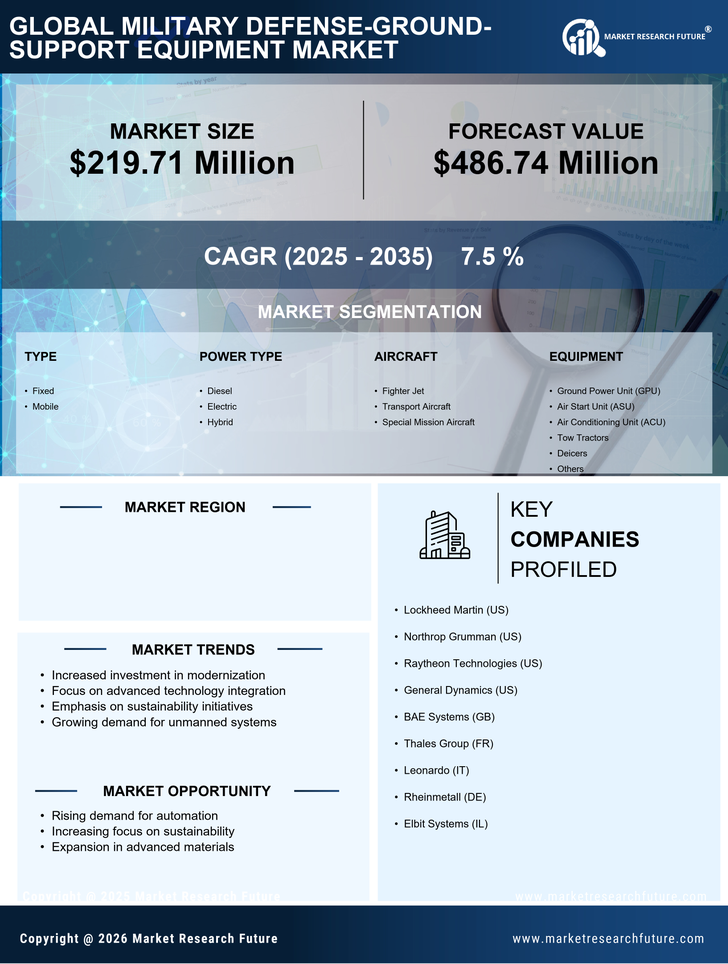
US Military Defense Ground Support Equipment Market Segmentation
US Military Defense Ground Support Equipment Market By Type (USD Million, 2025-2035)
- Fixed
- Mobile
US Military Defense Ground Support Equipment Market By Power Type (USD Million, 2025-2035)
- Diesel
- Electric
- Hybrid
US Military Defense Ground Support Equipment Market By Aircraft (USD Million, 2025-2035)
- Fighter Jet
- Transport Aircraft
- Special Mission Aircraft
US Military Defense Ground Support Equipment Market By Equipment (USD Million, 2025-2035)
- Ground Power Unit (GPU)
- Air Start Unit (ASU)
- Air Conditioning Unit (ACU)
- Tow Tractors
- Deicers
- Others