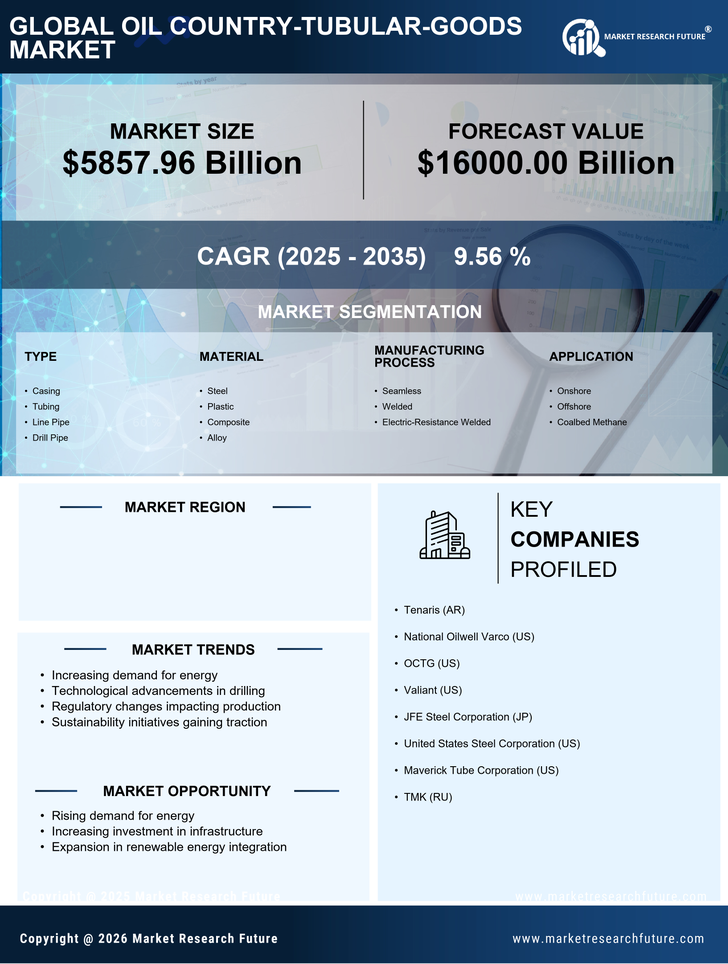
Request Free Sample ×

Kindly complete the form below to receive a free sample of this Report

* Please use a valid business email

Leading companies partner with us for data-driven Insights

clients tt-cursor
Hero Background

US Oil Country Tubular Goods Market

ID: MRFR/EnP/11513-HCR
100 Pages
Garvit Vyas
Last Updated: April 06, 2026
US Oil Country Tubular Goods Market Research Report By Product Type (Casing, Tubing, Line Pipe, Drill Pipe), By Material (Steel, Plastic, Composite, Alloy), By Manufacturing Process (Seamless, Welded, Electric-Resistance Welded) and By Application (Onshore, Offshore, Coalbed Methane) - Forecast to 2035
Download PDF ×

We do not share your information with anyone. However, we may send you emails based on your report interest from time to time. You may contact us at any time to opt-out.

  1. 1 SECTION I: EXECUTIVE SUMMARY AND KEY HIGHLIGHTS
    1. 1.1 EXECUTIVE SUMMARY
      1. 1.1.1 Market Overview
      2. 1.1.2 Key Findings
      3. 1.1.3 Market Segmentation
      4. 1.1.4 Competitive Landscape
      5. 1.1.5 Challenges and Opportunities
      6. 1.1.6 Future Outlook
  2. 2 SECTION II: SCOPING, METHODOLOGY AND MARKET STRUCTURE
    1. 2.1 MARKET INTRODUCTION
      1. 2.1.1 Definition
      2. 2.1.2 Scope of the study
        1. 2.1.2.1 Research Objective
        2. 2.1.2.2 Assumption
        3. 2.1.2.3 Limitations
    2. 2.2 RESEARCH METHODOLOGY
      1. 2.2.1 Overview
      2. 2.2.2 Data Mining
      3. 2.2.3 Secondary Research
      4. 2.2.4 Primary Research
        1. 2.2.4.1 Primary Interviews and Information Gathering Process
        2. 2.2.4.2 Breakdown of Primary Respondents
      5. 2.2.5 Forecasting Model
      6. 2.2.6 Market Size Estimation
        1. 2.2.6.1 Bottom-Up Approach
        2. 2.2.6.2 Top-Down Approach
      7. 2.2.7 Data Triangulation
      8. 2.2.8 Validation
  3. 3 SECTION III: QUALITATIVE ANALYSIS
    1. 3.1 MARKET DYNAMICS
      1. 3.1.1 Overview
      2. 3.1.2 Drivers
      3. 3.1.3 Restraints
      4. 3.1.4 Opportunities
    2. 3.2 MARKET FACTOR ANALYSIS
      1. 3.2.1 Value chain Analysis
      2. 3.2.2 Porter's Five Forces Analysis
        1. 3.2.2.1 Bargaining Power of Suppliers
        2. 3.2.2.2 Bargaining Power of Buyers
        3. 3.2.2.3 Threat of New Entrants
        4. 3.2.2.4 Threat of Substitutes
        5. 3.2.2.5 Intensity of Rivalry
      3. 3.2.3 COVID-19 Impact Analysis
        1. 3.2.3.1 Market Impact Analysis
        2. 3.2.3.2 Regional Impact
        3. 3.2.3.3 Opportunity and Threat Analysis
  4. 4 SECTION IV: QUANTITATIVE ANALYSIS
    1. 4.1 Construction, BY Type (USD Billion)
      1. 4.1.1 Casing
      2. 4.1.2 Tubing
      3. 4.1.3 Line Pipe
      4. 4.1.4 Drill Pipe
    2. 4.2 Construction, BY Material (USD Billion)
      1. 4.2.1 Steel
      2. 4.2.2 Plastic
      3. 4.2.3 Composite
      4. 4.2.4 Alloy
    3. 4.3 Construction, BY Manufacturing Process (USD Billion)
      1. 4.3.1 Seamless
      2. 4.3.2 Welded
      3. 4.3.3 Electric-Resistance Welded
    4. 4.4 Construction, BY Application (USD Billion)
      1. 4.4.1 Onshore
      2. 4.4.2 Offshore
      3. 4.4.3 Coalbed Methane
  5. 5 SECTION V: COMPETITIVE ANALYSIS
    1. 5.1 Competitive Landscape
      1. 5.1.1 Overview
      2. 5.1.2 Competitive Analysis
      3. 5.1.3 Market share Analysis
      4. 5.1.4 Major Growth Strategy in the Construction
      5. 5.1.5 Competitive Benchmarking
      6. 5.1.6 Leading Players in Terms of Number of Developments in the Construction
      7. 5.1.7 Key developments and growth strategies
        1. 5.1.7.1 New Product Launch/Service Deployment
        2. 5.1.7.2 Merger & Acquisitions
        3. 5.1.7.3 Joint Ventures
      8. 5.1.8 Major Players Financial Matrix
        1. 5.1.8.1 Sales and Operating Income
        2. 5.1.8.2 Major Players R&D Expenditure. 2023
    2. 5.2 Company Profiles
      1. 5.2.1 Tenaris (AR)
        1. 5.2.1.1 Financial Overview
        2. 5.2.1.2 Products Offered
        3. 5.2.1.3 Key Developments
        4. 5.2.1.4 SWOT Analysis
        5. 5.2.1.5 Key Strategies
      2. 5.2.2 National Oilwell Varco (US)
        1. 5.2.2.1 Financial Overview
        2. 5.2.2.2 Products Offered
        3. 5.2.2.3 Key Developments
        4. 5.2.2.4 SWOT Analysis
        5. 5.2.2.5 Key Strategies
      3. 5.2.3 OCTG (US)
        1. 5.2.3.1 Financial Overview
        2. 5.2.3.2 Products Offered
        3. 5.2.3.3 Key Developments
        4. 5.2.3.4 SWOT Analysis
        5. 5.2.3.5 Key Strategies
      4. 5.2.4 Valiant (US)
        1. 5.2.4.1 Financial Overview
        2. 5.2.4.2 Products Offered
        3. 5.2.4.3 Key Developments
        4. 5.2.4.4 SWOT Analysis
        5. 5.2.4.5 Key Strategies
      5. 5.2.5 JFE Steel Corporation (JP)
        1. 5.2.5.1 Financial Overview
        2. 5.2.5.2 Products Offered
        3. 5.2.5.3 Key Developments
        4. 5.2.5.4 SWOT Analysis
        5. 5.2.5.5 Key Strategies
      6. 5.2.6 United States Steel Corporation (US)
        1. 5.2.6.1 Financial Overview
        2. 5.2.6.2 Products Offered
        3. 5.2.6.3 Key Developments
        4. 5.2.6.4 SWOT Analysis
        5. 5.2.6.5 Key Strategies
      7. 5.2.7 Maverick Tube Corporation (US)
        1. 5.2.7.1 Financial Overview
        2. 5.2.7.2 Products Offered
        3. 5.2.7.3 Key Developments
        4. 5.2.7.4 SWOT Analysis
        5. 5.2.7.5 Key Strategies
      8. 5.2.8 TMK (RU)
        1. 5.2.8.1 Financial Overview
        2. 5.2.8.2 Products Offered
        3. 5.2.8.3 Key Developments
        4. 5.2.8.4 SWOT Analysis
        5. 5.2.8.5 Key Strategies
    3. 5.3 Appendix
      1. 5.3.1 References
      2. 5.3.2 Related Reports
  6. 6 LIST OF FIGURES
    1. 6.1 MARKET SYNOPSIS
    2. 6.2 US MARKET ANALYSIS BY TYPE
    3. 6.3 US MARKET ANALYSIS BY MATERIAL
    4. 6.4 US MARKET ANALYSIS BY MANUFACTURING PROCESS
    5. 6.5 US MARKET ANALYSIS BY APPLICATION
    6. 6.6 KEY BUYING CRITERIA OF CONSTRUCTION
    7. 6.7 RESEARCH PROCESS OF MRFR
    8. 6.8 DRO ANALYSIS OF CONSTRUCTION
    9. 6.9 DRIVERS IMPACT ANALYSIS: CONSTRUCTION
    10. 6.10 RESTRAINTS IMPACT ANALYSIS: CONSTRUCTION
    11. 6.11 SUPPLY / VALUE CHAIN: CONSTRUCTION
    12. 6.12 CONSTRUCTION, BY TYPE, 2024 (% SHARE)
    13. 6.13 CONSTRUCTION, BY TYPE, 2024 TO 2035 (USD Billion)
    14. 6.14 CONSTRUCTION, BY MATERIAL, 2024 (% SHARE)
    15. 6.15 CONSTRUCTION, BY MATERIAL, 2024 TO 2035 (USD Billion)
    16. 6.16 CONSTRUCTION, BY MANUFACTURING PROCESS, 2024 (% SHARE)
    17. 6.17 CONSTRUCTION, BY MANUFACTURING PROCESS, 2024 TO 2035 (USD Billion)
    18. 6.18 CONSTRUCTION, BY APPLICATION, 2024 (% SHARE)
    19. 6.19 CONSTRUCTION, BY APPLICATION, 2024 TO 2035 (USD Billion)
    20. 6.20 BENCHMARKING OF MAJOR COMPETITORS
  7. 7 LIST OF TABLES
    1. 7.1 LIST OF ASSUMPTIONS
  8. 7.1.1
    1. 7.2 US MARKET SIZE ESTIMATES; FORECAST
      1. 7.2.1 BY TYPE, 2025-2035 (USD Billion)
      2. 7.2.2 BY MATERIAL, 2025-2035 (USD Billion)
      3. 7.2.3 BY MANUFACTURING PROCESS, 2025-2035 (USD Billion)
      4. 7.2.4 BY APPLICATION, 2025-2035 (USD Billion)
    2. 7.3 PRODUCT LAUNCH/PRODUCT DEVELOPMENT/APPROVAL
  9. 7.3.1
    1. 7.4 ACQUISITION/PARTNERSHIP
  10. 7.4.1

US Construction Market Segmentation

Construction By Type (USD Billion, 2025-2035)

  • Casing
  • Tubing
  • Line Pipe
  • Drill Pipe

Construction By Material (USD Billion, 2025-2035)

  • Steel
  • Plastic
  • Composite
  • Alloy

Construction By Manufacturing Process (USD Billion, 2025-2035)

  • Seamless
  • Welded
  • Electric-Resistance Welded

Construction By Application (USD Billion, 2025-2035)

  • Onshore
  • Offshore
  • Coalbed Methane