US Portable Generator Market Segmentation
US Portable Generator Market By Type (USD Million, 2025-2035)
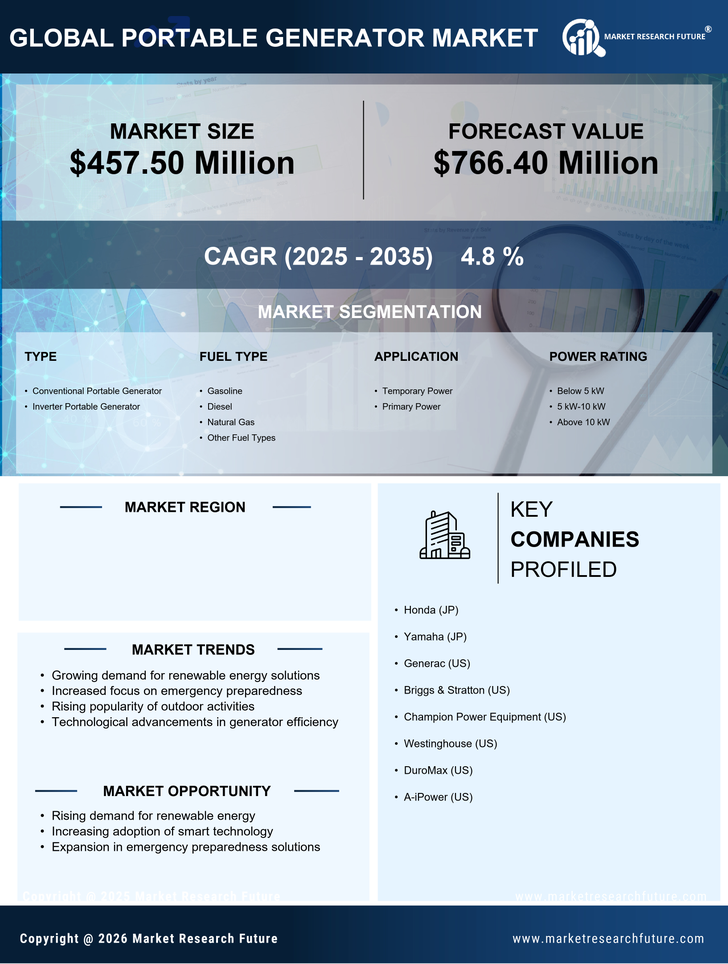
- Conventional Portable Generator
- Inverter Portable Generator
US Portable Generator Market By Fuel Type (USD Million, 2025-2035)
- Gasoline
- Diesel
- Natural Gas
- Other Fuel Types
US Portable Generator Market By Application (USD Million, 2025-2035)
- Temporary Power
- Primary Power
US Portable Generator Market By Power Rating (USD Million, 2025-2035)
- Below 5 kW
- 5 kW-10 kW
- Above 10 kW
US Portable Generator Market By End User (USD Million, 2025-2035)
- Residential
- Commercial
- Industrial