US Ride Sharing Market Segmentation
US Ride Sharing Market By US Ride Sharing Market Model (USD Billion, 2025-2035)
- Peer-to-Peer
- Business-to-Consumer
- Business-to-Business
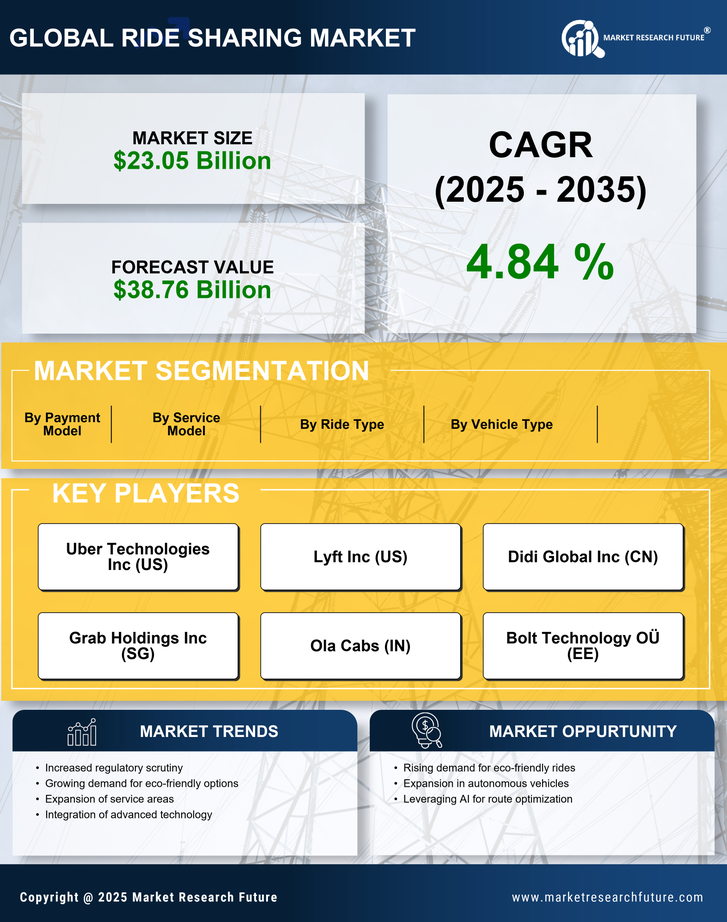
US Ride Sharing Market By Vehicle Type (USD Billion, 2025-2035)
- Sedan
- SUV
- Minivan
- Luxury Car
US Ride Sharing Market By Ride Type (USD Billion, 2025-2035)
- Pooling
- Private
- Luxury
US Ride Sharing Market By Payment Model (USD Billion, 2025-2035)
- Pay-as-You-Go
- Subscription-based
- On-Demand