US Shrimp Market Segmentation
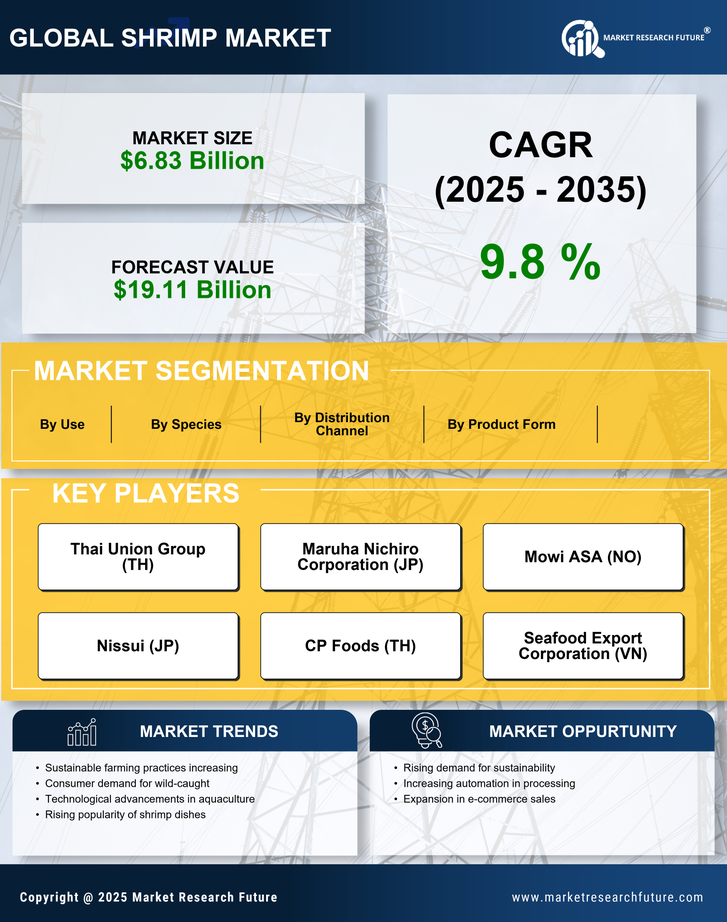
US Shrimp Market By Species (USD Billion, 2025-2035)
- Penaeus vannamei
- Penaeus monodon
- Metapenaeus ensis
- Litopenaeus setiferus
US Shrimp Market By Product Form (USD Billion, 2025-2035)
- Frozen
- Fresh
- Canned
- Cooked
- Dried
US Shrimp Market By Distribution Channel (USD Billion, 2025-2035)
- Supermarkets
- Online Retail
- Wholesale
- Specialty Stores
US Shrimp Market By Use (USD Billion, 2025-2035)
- Food Service
- Retail
- Industrial