US Superconductor Wire Market

ID: MRFR/EnP/16475-HCR
100 Pages
Garvit Vyas
Last Updated: April 06, 2026
US Superconductor Wire Market Research Report By Application (Magnetic Resonance Imaging, Particle Accelerators, Power Cables, Transformers, Energy Storage Systems), By Material Type (High-Temperature Superconductors, Low-Temperature Superconductors, Iron-Based Superconductors, Copper Oxide Superconductors, Magnesium Diboride), By End Use Industry (Healthcare, Energy, Telecommunications, Transportation, Research and Development) and By Form Factor (Round Wire, Flat Wire, Tape, Other Shapes) - Forecast to 2035
Download PDF ×

We do not share your information with anyone. However, we may send you emails based on your report interest from time to time. You may contact us at any time to opt-out.

US Superconductor Wire Market

Market Size

Forecast Period2025 - 2035
CAGR (2025 - 2035)6.19%
2024 Market Size$ 206.64 Million
2025 Market Size$ 219.43 Million
2035 Market Size$ 400 Million

Key Players

American Superconductor Corporation
Superconductor Technologies Inc.
Bruker Corporation
Sumitomo Electric Industries Ltd.
Furukawa Electric Co. Ltd.
Nexans S.A.
Opportunities
  • Increased Focus on Electric Vehicles
  • Expansion of High-Performance Computing
  • Rising Applications in Renewable Energy
  1. 1 SECTION I: EXECUTIVE SUMMARY AND KEY HIGHLIGHTS
    1. 1.1 EXECUTIVE SUMMARY
      1. 1.1.1 Market Overview
      2. 1.1.2 Key Findings
      3. 1.1.3 Market Segmentation
      4. 1.1.4 Competitive Landscape
      5. 1.1.5 Challenges and Opportunities
      6. 1.1.6 Future Outlook
  2. 2 SECTION II: SCOPING, METHODOLOGY AND MARKET STRUCTURE
    1. 2.1 MARKET INTRODUCTION
      1. 2.1.1 Definition
      2. 2.1.2 Scope of the study
        1. 2.1.2.1 Research Objective
        2. 2.1.2.2 Assumption
        3. 2.1.2.3 Limitations
    2. 2.2 RESEARCH METHODOLOGY
      1. 2.2.1 Overview
      2. 2.2.2 Data Mining
      3. 2.2.3 Secondary Research
      4. 2.2.4 Primary Research
        1. 2.2.4.1 Primary Interviews and Information Gathering Process
        2. 2.2.4.2 Breakdown of Primary Respondents
      5. 2.2.5 Forecasting Model
      6. 2.2.6 Market Size Estimation
        1. 2.2.6.1 Bottom-Up Approach
        2. 2.2.6.2 Top-Down Approach
      7. 2.2.7 Data Triangulation
      8. 2.2.8 Validation
  3. 3 SECTION III: QUALITATIVE ANALYSIS
    1. 3.1 MARKET DYNAMICS
      1. 3.1.1 Overview
      2. 3.1.2 Drivers
      3. 3.1.3 Restraints
      4. 3.1.4 Opportunities
    2. 3.2 MARKET FACTOR ANALYSIS
      1. 3.2.1 Value chain Analysis
      2. 3.2.2 Porter's Five Forces Analysis
        1. 3.2.2.1 Bargaining Power of Suppliers
        2. 3.2.2.2 Bargaining Power of Buyers
        3. 3.2.2.3 Threat of New Entrants
        4. 3.2.2.4 Threat of Substitutes
        5. 3.2.2.5 Intensity of Rivalry
      3. 3.2.3 COVID-19 Impact Analysis
        1. 3.2.3.1 Market Impact Analysis
        2. 3.2.3.2 Regional Impact
        3. 3.2.3.3 Opportunity and Threat Analysis
  4. 4 SECTION IV: QUANTITATIVE ANALYSIS
    1. 4.1 Construction, BY Application (USD Million)
      1. 4.1.1 Magnetic Resonance Imaging
      2. 4.1.2 Particle Accelerators
      3. 4.1.3 Power Cables
      4. 4.1.4 Transformers
      5. 4.1.5 Energy Storage Systems
    2. 4.2 Construction, BY Material Type (USD Million)
      1. 4.2.1 High-Temperature Superconductors
      2. 4.2.2 Low-Temperature Superconductors
      3. 4.2.3 Iron-Based Superconductors
      4. 4.2.4 Copper Oxide Superconductors
      5. 4.2.5 Magnesium Diboride
    3. 4.3 Construction, BY End Use Industry (USD Million)
      1. 4.3.1 Healthcare
      2. 4.3.2 Energy
      3. 4.3.3 Telecommunications
      4. 4.3.4 Transportation
      5. 4.3.5 Research and Development
    4. 4.4 Construction, BY Form Factor (USD Million)
      1. 4.4.1 Round Wire
      2. 4.4.2 Flat Wire
      3. 4.4.3 Tape
      4. 4.4.4 Other Shapes
  5. 5 SECTION V: COMPETITIVE ANALYSIS
    1. 5.1 Competitive Landscape
      1. 5.1.1 Overview
      2. 5.1.2 Competitive Analysis
      3. 5.1.3 Market share Analysis
      4. 5.1.4 Major Growth Strategy in the Construction
      5. 5.1.5 Competitive Benchmarking
      6. 5.1.6 Leading Players in Terms of Number of Developments in the Construction
      7. 5.1.7 Key developments and growth strategies
        1. 5.1.7.1 New Product Launch/Service Deployment
        2. 5.1.7.2 Merger & Acquisitions
        3. 5.1.7.3 Joint Ventures
      8. 5.1.8 Major Players Financial Matrix
        1. 5.1.8.1 Sales and Operating Income
        2. 5.1.8.2 Major Players R&D Expenditure. 2023
    2. 5.2 Company Profiles
      1. 5.2.1 American Superconductor Corporation (US)
        1. 5.2.1.1 Financial Overview
        2. 5.2.1.2 Products Offered
        3. 5.2.1.3 Key Developments
        4. 5.2.1.4 SWOT Analysis
        5. 5.2.1.5 Key Strategies
      2. 5.2.2 Superconductor Technologies Inc. (US)
        1. 5.2.2.1 Financial Overview
        2. 5.2.2.2 Products Offered
        3. 5.2.2.3 Key Developments
        4. 5.2.2.4 SWOT Analysis
        5. 5.2.2.5 Key Strategies
      3. 5.2.3 Bruker Corporation (US)
        1. 5.2.3.1 Financial Overview
        2. 5.2.3.2 Products Offered
        3. 5.2.3.3 Key Developments
        4. 5.2.3.4 SWOT Analysis
        5. 5.2.3.5 Key Strategies
      4. 5.2.4 Sumitomo Electric Industries Ltd. (JP)
        1. 5.2.4.1 Financial Overview
        2. 5.2.4.2 Products Offered
        3. 5.2.4.3 Key Developments
        4. 5.2.4.4 SWOT Analysis
        5. 5.2.4.5 Key Strategies
      5. 5.2.5 Furukawa Electric Co. Ltd. (JP)
        1. 5.2.5.1 Financial Overview
        2. 5.2.5.2 Products Offered
        3. 5.2.5.3 Key Developments
        4. 5.2.5.4 SWOT Analysis
        5. 5.2.5.5 Key Strategies
      6. 5.2.6 Nexans S.A. (FR)
        1. 5.2.6.1 Financial Overview
        2. 5.2.6.2 Products Offered
        3. 5.2.6.3 Key Developments
        4. 5.2.6.4 SWOT Analysis
        5. 5.2.6.5 Key Strategies
      7. 5.2.7 AMSC (US)
        1. 5.2.7.1 Financial Overview
        2. 5.2.7.2 Products Offered
        3. 5.2.7.3 Key Developments
        4. 5.2.7.4 SWOT Analysis
        5. 5.2.7.5 Key Strategies
      8. 5.2.8 Oxford Instruments plc (GB)
        1. 5.2.8.1 Financial Overview
        2. 5.2.8.2 Products Offered
        3. 5.2.8.3 Key Developments
        4. 5.2.8.4 SWOT Analysis
        5. 5.2.8.5 Key Strategies
    3. 5.3 Appendix
      1. 5.3.1 References
      2. 5.3.2 Related Reports
  6. 6 LIST OF FIGURES
    1. 6.1 MARKET SYNOPSIS
    2. 6.2 US MARKET ANALYSIS BY APPLICATION
    3. 6.3 US MARKET ANALYSIS BY MATERIAL TYPE
    4. 6.4 US MARKET ANALYSIS BY END USE INDUSTRY
    5. 6.5 US MARKET ANALYSIS BY FORM FACTOR
    6. 6.6 KEY BUYING CRITERIA OF CONSTRUCTION
    7. 6.7 RESEARCH PROCESS OF MRFR
    8. 6.8 DRO ANALYSIS OF CONSTRUCTION
    9. 6.9 DRIVERS IMPACT ANALYSIS: CONSTRUCTION
    10. 6.10 RESTRAINTS IMPACT ANALYSIS: CONSTRUCTION
    11. 6.11 SUPPLY / VALUE CHAIN: CONSTRUCTION
    12. 6.12 CONSTRUCTION, BY APPLICATION, 2024 (% SHARE)
    13. 6.13 CONSTRUCTION, BY APPLICATION, 2024 TO 2035 (USD Million)
    14. 6.14 CONSTRUCTION, BY MATERIAL TYPE, 2024 (% SHARE)
    15. 6.15 CONSTRUCTION, BY MATERIAL TYPE, 2024 TO 2035 (USD Million)
    16. 6.16 CONSTRUCTION, BY END USE INDUSTRY, 2024 (% SHARE)
    17. 6.17 CONSTRUCTION, BY END USE INDUSTRY, 2024 TO 2035 (USD Million)
    18. 6.18 CONSTRUCTION, BY FORM FACTOR, 2024 (% SHARE)
    19. 6.19 CONSTRUCTION, BY FORM FACTOR, 2024 TO 2035 (USD Million)
    20. 6.20 BENCHMARKING OF MAJOR COMPETITORS
  7. 7 LIST OF TABLES
    1. 7.1 LIST OF ASSUMPTIONS
  8. 7.1.1
    1. 7.2 US MARKET SIZE ESTIMATES; FORECAST
      1. 7.2.1 BY APPLICATION, 2025-2035 (USD Million)
      2. 7.2.2 BY MATERIAL TYPE, 2025-2035 (USD Million)
      3. 7.2.3 BY END USE INDUSTRY, 2025-2035 (USD Million)
      4. 7.2.4 BY FORM FACTOR, 2025-2035 (USD Million)
    2. 7.3 PRODUCT LAUNCH/PRODUCT DEVELOPMENT/APPROVAL
  9. 7.3.1
    1. 7.4 ACQUISITION/PARTNERSHIP
  10. 7.4.1

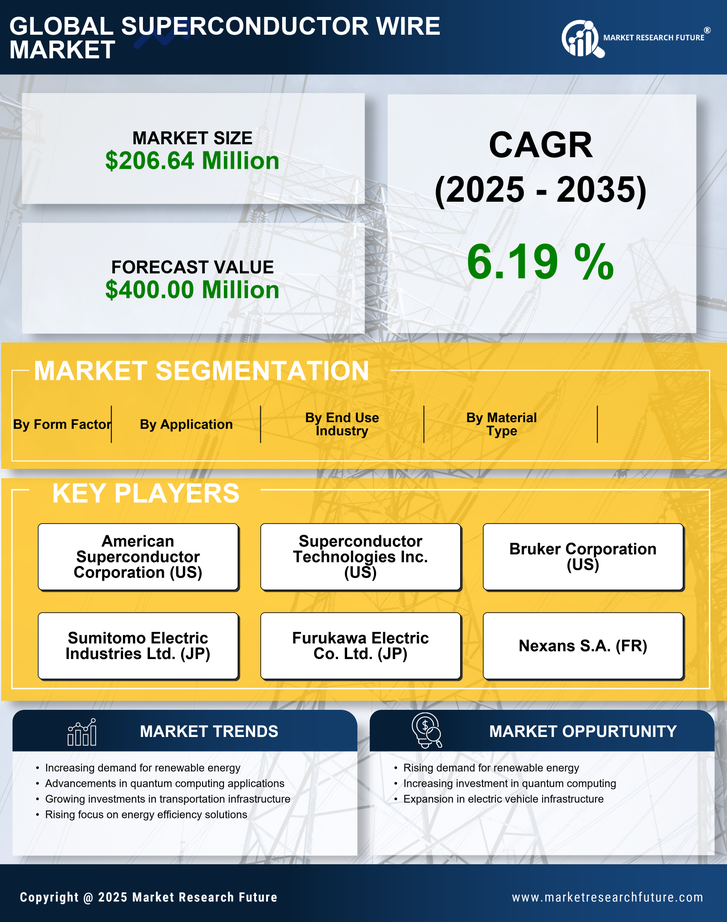
US Construction Market Segmentation

Construction By Application (USD Million, 2025-2035)

  • Magnetic Resonance Imaging
  • Particle Accelerators
  • Power Cables
  • Transformers
  • Energy Storage Systems

Construction By Material Type (USD Million, 2025-2035)

  • High-Temperature Superconductors
  • Low-Temperature Superconductors
  • Iron-Based Superconductors
  • Copper Oxide Superconductors
  • Magnesium Diboride

Construction By End Use Industry (USD Million, 2025-2035)

  • Healthcare
  • Energy
  • Telecommunications
  • Transportation
  • Research and Development

Construction By Form Factor (USD Million, 2025-2035)

  • Round Wire
  • Flat Wire
  • Tape
  • Other Shapes