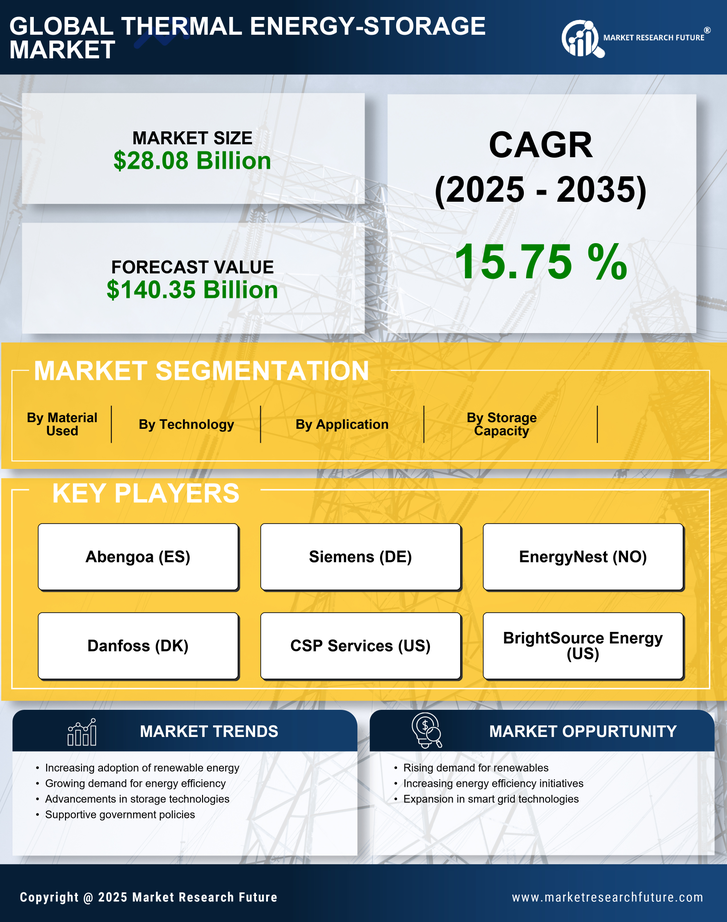
Request Free Sample ×

Kindly complete the form below to receive a free sample of this Report

* Please use a valid business email

Leading companies partner with us for data-driven Insights

clients tt-cursor
Hero Background

US Thermal Energy Storage Market

ID: MRFR/EnP/14122-HCR
100 Pages
Garvit Vyas
Last Updated: April 06, 2026
US Thermal Energy Storage Market Research Report By Technology (Molten Salt Storage, Water Thermal Storage, Phase Change Materials, Ice Storage), By Storage Capacity (Less than 100 MWh, 100-500 MWh, 500-1000 MWh, More than 1000 MWh), By Application (District Heating, Industrial Processes, Concentrated Solar Power, Building Heating and Cooling) and By Material Used (Concrete, Steel, Natural Materials, Composite Materials) - Forecast to 2035
Download PDF ×

We do not share your information with anyone. However, we may send you emails based on your report interest from time to time. You may contact us at any time to opt-out.

  1. 1 SECTION I: EXECUTIVE SUMMARY AND KEY HIGHLIGHTS
    1. 1.1 EXECUTIVE SUMMARY
      1. 1.1.1 Market Overview
      2. 1.1.2 Key Findings
      3. 1.1.3 Market Segmentation
      4. 1.1.4 Competitive Landscape
      5. 1.1.5 Challenges and Opportunities
      6. 1.1.6 Future Outlook
  2. 2 SECTION II: SCOPING, METHODOLOGY AND MARKET STRUCTURE
    1. 2.1 MARKET INTRODUCTION
      1. 2.1.1 Definition
      2. 2.1.2 Scope of the study
        1. 2.1.2.1 Research Objective
        2. 2.1.2.2 Assumption
        3. 2.1.2.3 Limitations
    2. 2.2 RESEARCH METHODOLOGY
      1. 2.2.1 Overview
      2. 2.2.2 Data Mining
      3. 2.2.3 Secondary Research
      4. 2.2.4 Primary Research
        1. 2.2.4.1 Primary Interviews and Information Gathering Process
        2. 2.2.4.2 Breakdown of Primary Respondents
      5. 2.2.5 Forecasting Model
      6. 2.2.6 Market Size Estimation
        1. 2.2.6.1 Bottom-Up Approach
        2. 2.2.6.2 Top-Down Approach
      7. 2.2.7 Data Triangulation
      8. 2.2.8 Validation
  3. 3 SECTION III: QUALITATIVE ANALYSIS
    1. 3.1 MARKET DYNAMICS
      1. 3.1.1 Overview
      2. 3.1.2 Drivers
      3. 3.1.3 Restraints
      4. 3.1.4 Opportunities
    2. 3.2 MARKET FACTOR ANALYSIS
      1. 3.2.1 Value chain Analysis
      2. 3.2.2 Porter's Five Forces Analysis
        1. 3.2.2.1 Bargaining Power of Suppliers
        2. 3.2.2.2 Bargaining Power of Buyers
        3. 3.2.2.3 Threat of New Entrants
        4. 3.2.2.4 Threat of Substitutes
        5. 3.2.2.5 Intensity of Rivalry
      3. 3.2.3 COVID-19 Impact Analysis
        1. 3.2.3.1 Market Impact Analysis
        2. 3.2.3.2 Regional Impact
        3. 3.2.3.3 Opportunity and Threat Analysis
  4. 4 SECTION IV: QUANTITATIVE ANALYSIS
    1. 4.1 Food, Beverages & Nutrition, BY Technology (USD Billion)
      1. 4.1.1 Molten Salt Storage
      2. 4.1.2 Water Thermal Storage
      3. 4.1.3 Phase Change Materials
      4. 4.1.4 Ice Storage
    2. 4.2 Food, Beverages & Nutrition, BY Storage Capacity (USD Billion)
      1. 4.2.1 Less than 100 MWh
      2. 4.2.2 100-500 MWh
      3. 4.2.3 500-1000 MWh
      4. 4.2.4 More than 1000 MWh
    3. 4.3 Food, Beverages & Nutrition, BY Application (USD Billion)
      1. 4.3.1 District Heating
      2. 4.3.2 Industrial Processes
      3. 4.3.3 Concentrated Solar Power
      4. 4.3.4 Building Heating and Cooling
    4. 4.4 Food, Beverages & Nutrition, BY Material Used (USD Billion)
      1. 4.4.1 Concrete
      2. 4.4.2 Steel
      3. 4.4.3 Natural Materials
      4. 4.4.4 Composite Materials
  5. 5 SECTION V: COMPETITIVE ANALYSIS
    1. 5.1 Competitive Landscape
      1. 5.1.1 Overview
      2. 5.1.2 Competitive Analysis
      3. 5.1.3 Market share Analysis
      4. 5.1.4 Major Growth Strategy in the Food, Beverages & Nutrition
      5. 5.1.5 Competitive Benchmarking
      6. 5.1.6 Leading Players in Terms of Number of Developments in the Food, Beverages & Nutrition
      7. 5.1.7 Key developments and growth strategies
        1. 5.1.7.1 New Product Launch/Service Deployment
        2. 5.1.7.2 Merger & Acquisitions
        3. 5.1.7.3 Joint Ventures
      8. 5.1.8 Major Players Financial Matrix
        1. 5.1.8.1 Sales and Operating Income
        2. 5.1.8.2 Major Players R&D Expenditure. 2023
    2. 5.2 Company Profiles
      1. 5.2.1 Abengoa (ES)
        1. 5.2.1.1 Financial Overview
        2. 5.2.1.2 Products Offered
        3. 5.2.1.3 Key Developments
        4. 5.2.1.4 SWOT Analysis
        5. 5.2.1.5 Key Strategies
      2. 5.2.2 Siemens (DE)
        1. 5.2.2.1 Financial Overview
        2. 5.2.2.2 Products Offered
        3. 5.2.2.3 Key Developments
        4. 5.2.2.4 SWOT Analysis
        5. 5.2.2.5 Key Strategies
      3. 5.2.3 EnergyNest (NO)
        1. 5.2.3.1 Financial Overview
        2. 5.2.3.2 Products Offered
        3. 5.2.3.3 Key Developments
        4. 5.2.3.4 SWOT Analysis
        5. 5.2.3.5 Key Strategies
      4. 5.2.4 Danfoss (DK)
        1. 5.2.4.1 Financial Overview
        2. 5.2.4.2 Products Offered
        3. 5.2.4.3 Key Developments
        4. 5.2.4.4 SWOT Analysis
        5. 5.2.4.5 Key Strategies
      5. 5.2.5 CSP Services (US)
        1. 5.2.5.1 Financial Overview
        2. 5.2.5.2 Products Offered
        3. 5.2.5.3 Key Developments
        4. 5.2.5.4 SWOT Analysis
        5. 5.2.5.5 Key Strategies
      6. 5.2.6 BrightSource Energy (US)
        1. 5.2.6.1 Financial Overview
        2. 5.2.6.2 Products Offered
        3. 5.2.6.3 Key Developments
        4. 5.2.6.4 SWOT Analysis
        5. 5.2.6.5 Key Strategies
      7. 5.2.7 SolarReserve (US)
        1. 5.2.7.1 Financial Overview
        2. 5.2.7.2 Products Offered
        3. 5.2.7.3 Key Developments
        4. 5.2.7.4 SWOT Analysis
        5. 5.2.7.5 Key Strategies
      8. 5.2.8 Aalborg CSP (DK)
        1. 5.2.8.1 Financial Overview
        2. 5.2.8.2 Products Offered
        3. 5.2.8.3 Key Developments
        4. 5.2.8.4 SWOT Analysis
        5. 5.2.8.5 Key Strategies
    3. 5.3 Appendix
      1. 5.3.1 References
      2. 5.3.2 Related Reports
  6. 6 LIST OF FIGURES
    1. 6.1 MARKET SYNOPSIS
    2. 6.2 US MARKET ANALYSIS BY TECHNOLOGY
    3. 6.3 US MARKET ANALYSIS BY STORAGE CAPACITY
    4. 6.4 US MARKET ANALYSIS BY APPLICATION
    5. 6.5 US MARKET ANALYSIS BY MATERIAL USED
    6. 6.6 KEY BUYING CRITERIA OF FOOD, BEVERAGES & NUTRITION
    7. 6.7 RESEARCH PROCESS OF MRFR
    8. 6.8 DRO ANALYSIS OF FOOD, BEVERAGES & NUTRITION
    9. 6.9 DRIVERS IMPACT ANALYSIS: FOOD, BEVERAGES & NUTRITION
    10. 6.10 RESTRAINTS IMPACT ANALYSIS: FOOD, BEVERAGES & NUTRITION
    11. 6.11 SUPPLY / VALUE CHAIN: FOOD, BEVERAGES & NUTRITION
    12. 6.12 FOOD, BEVERAGES & NUTRITION, BY TECHNOLOGY, 2024 (% SHARE)
    13. 6.13 FOOD, BEVERAGES & NUTRITION, BY TECHNOLOGY, 2024 TO 2035 (USD Billion)
    14. 6.14 FOOD, BEVERAGES & NUTRITION, BY STORAGE CAPACITY, 2024 (% SHARE)
    15. 6.15 FOOD, BEVERAGES & NUTRITION, BY STORAGE CAPACITY, 2024 TO 2035 (USD Billion)
    16. 6.16 FOOD, BEVERAGES & NUTRITION, BY APPLICATION, 2024 (% SHARE)
    17. 6.17 FOOD, BEVERAGES & NUTRITION, BY APPLICATION, 2024 TO 2035 (USD Billion)
    18. 6.18 FOOD, BEVERAGES & NUTRITION, BY MATERIAL USED, 2024 (% SHARE)
    19. 6.19 FOOD, BEVERAGES & NUTRITION, BY MATERIAL USED, 2024 TO 2035 (USD Billion)
    20. 6.20 BENCHMARKING OF MAJOR COMPETITORS
  7. 7 LIST OF TABLES
    1. 7.1 LIST OF ASSUMPTIONS
  8. 7.1.1
    1. 7.2 US MARKET SIZE ESTIMATES; FORECAST
      1. 7.2.1 BY TECHNOLOGY, 2025-2035 (USD Billion)
      2. 7.2.2 BY STORAGE CAPACITY, 2025-2035 (USD Billion)
      3. 7.2.3 BY APPLICATION, 2025-2035 (USD Billion)
      4. 7.2.4 BY MATERIAL USED, 2025-2035 (USD Billion)
    2. 7.3 PRODUCT LAUNCH/PRODUCT DEVELOPMENT/APPROVAL
  9. 7.3.1
    1. 7.4 ACQUISITION/PARTNERSHIP
  10. 7.4.1

US Food, Beverages & Nutrition Market Segmentation

Food, Beverages & Nutrition By Technology (USD Billion, 2025-2035)

  • Molten Salt Storage
  • Water Thermal Storage
  • Phase Change Materials
  • Ice Storage

Food, Beverages & Nutrition By Storage Capacity (USD Billion, 2025-2035)

  • Less than 100 MWh
  • 100-500 MWh
  • 500-1000 MWh
  • More than 1000 MWh

Food, Beverages & Nutrition By Application (USD Billion, 2025-2035)

  • District Heating
  • Industrial Processes
  • Concentrated Solar Power
  • Building Heating and Cooling

Food, Beverages & Nutrition By Material Used (USD Billion, 2025-2035)

  • Concrete
  • Steel
  • Natural Materials
  • Composite Materials