US Used Bike Market Segmentation
US Used Bike Market By Type (USD Billion, 2025-2035)
- Standard
- Sport
- Cruiser
- Touring
- Dual-Sport
US Used Bike Market By Condition (USD Billion, 2025-2035)
- Certified Pre-Owned
- Good Condition
- Fair Condition
- As-Is
US Used Bike Market By Engine Type (USD Billion, 2025-2035)
- Internal Combustion Engine
- Electric
- Hybrid
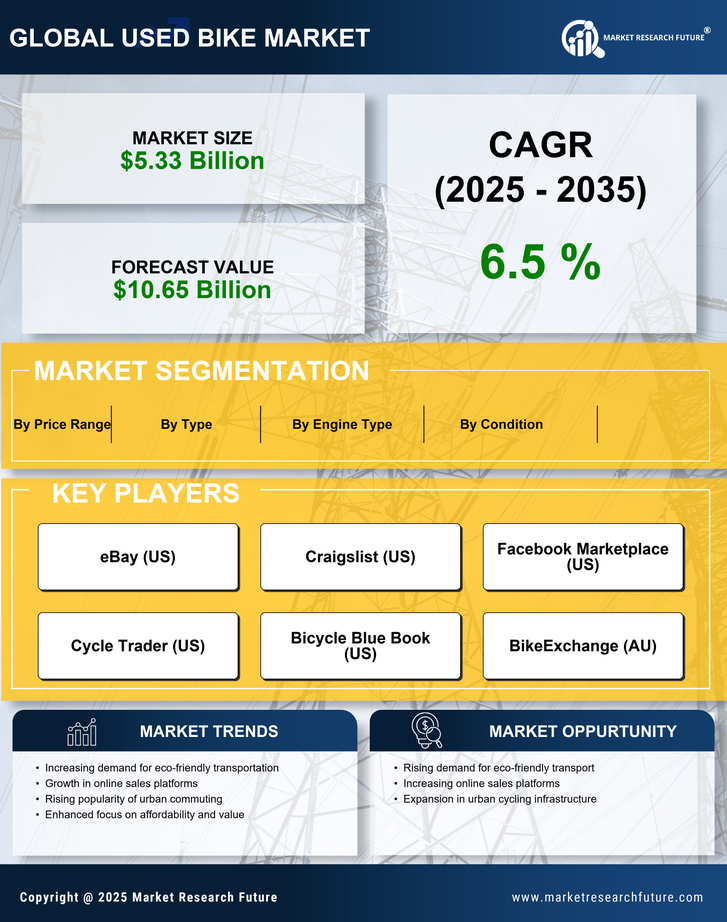
US Used Bike Market By Price Range (USD Billion, 2025-2035)
- Below $1,000
- $1,000 - $5,000
- $5,000 - $10,000
- Above $10,000