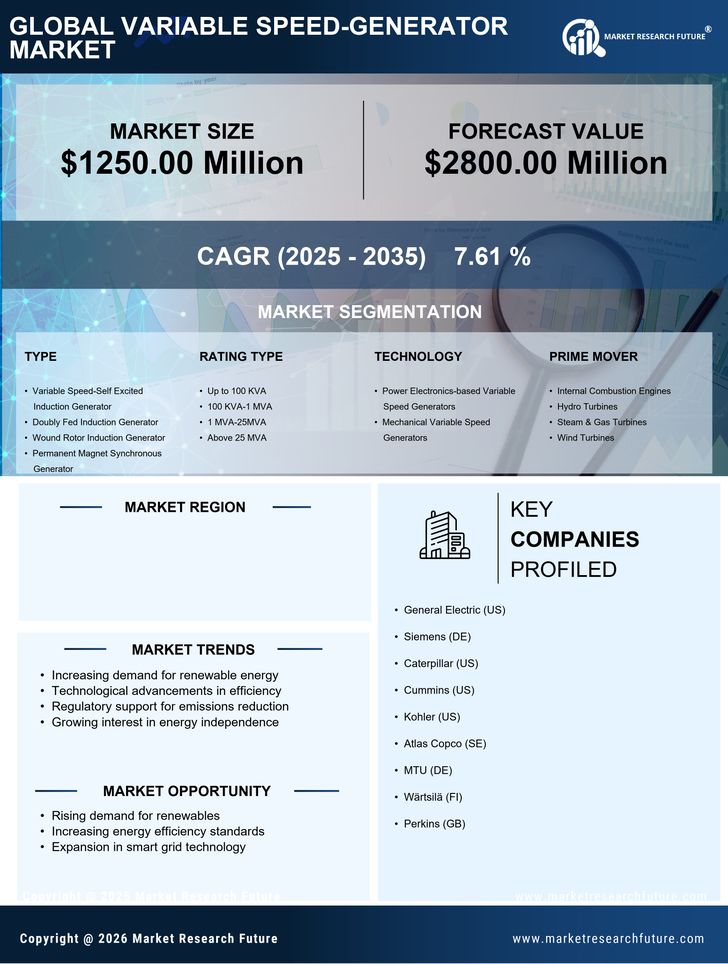
Request Free Sample ×

Kindly complete the form below to receive a free sample of this Report

* Please use a valid business email

Leading companies partner with us for data-driven Insights

clients tt-cursor
Hero Background

US Variable Speed Generator Market

ID: MRFR/EnP/12960-HCR
100 Pages
Snehal Singh
Last Updated: April 06, 2026
US Variable Speed Generator Market Research Report By Type (Variable Speed-Self Excited Induction Generator, Doubly Fed Induction Generator, Wound Rotor Induction Generator, Permanent Magnet Synchronous Generator), By Rating Type (Up to 100 KVA, 100 KVA-1 MVA, 1 MVA-25MVA, Above 25 MVA), By Technology (Power Electronics-based Variable Speed Generators, Mechanical Variable Speed Generators), By Prime Mover (Internal Combustion Engines, Hydro Turbines, Steam & Gas Turbines, Wind Turbines) and By End-User (Hydroelectric Power Generation, Renewable Power Generation, Oil & Gas And Mining, Aerospace And Telecommunications, Marine And Shipbuilding, Commercial And Residential) - Forecast to 2035
Download PDF ×

We do not share your information with anyone. However, we may send you emails based on your report interest from time to time. You may contact us at any time to opt-out.

  1. 1 SECTION I: EXECUTIVE SUMMARY AND KEY HIGHLIGHTS
    1. 1.1 EXECUTIVE SUMMARY
      1. 1.1.1 Market Overview
      2. 1.1.2 Key Findings
      3. 1.1.3 Market Segmentation
      4. 1.1.4 Competitive Landscape
      5. 1.1.5 Challenges and Opportunities
      6. 1.1.6 Future Outlook
  2. 2 SECTION II: SCOPING, METHODOLOGY AND MARKET STRUCTURE
    1. 2.1 MARKET INTRODUCTION
      1. 2.1.1 Definition
      2. 2.1.2 Scope of the study
        1. 2.1.2.1 Research Objective
        2. 2.1.2.2 Assumption
        3. 2.1.2.3 Limitations
    2. 2.2 RESEARCH METHODOLOGY
      1. 2.2.1 Overview
      2. 2.2.2 Data Mining
      3. 2.2.3 Secondary Research
      4. 2.2.4 Primary Research
        1. 2.2.4.1 Primary Interviews and Information Gathering Process
        2. 2.2.4.2 Breakdown of Primary Respondents
      5. 2.2.5 Forecasting Model
      6. 2.2.6 Market Size Estimation
        1. 2.2.6.1 Bottom-Up Approach
        2. 2.2.6.2 Top-Down Approach
      7. 2.2.7 Data Triangulation
      8. 2.2.8 Validation
  3. 3 SECTION III: QUALITATIVE ANALYSIS
    1. 3.1 MARKET DYNAMICS
      1. 3.1.1 Overview
      2. 3.1.2 Drivers
      3. 3.1.3 Restraints
      4. 3.1.4 Opportunities
    2. 3.2 MARKET FACTOR ANALYSIS
      1. 3.2.1 Value chain Analysis
      2. 3.2.2 Porter's Five Forces Analysis
        1. 3.2.2.1 Bargaining Power of Suppliers
        2. 3.2.2.2 Bargaining Power of Buyers
        3. 3.2.2.3 Threat of New Entrants
        4. 3.2.2.4 Threat of Substitutes
        5. 3.2.2.5 Intensity of Rivalry
      3. 3.2.3 COVID-19 Impact Analysis
        1. 3.2.3.1 Market Impact Analysis
        2. 3.2.3.2 Regional Impact
        3. 3.2.3.3 Opportunity and Threat Analysis
  4. 4 SECTION IV: QUANTITATIVE ANALYSIS
    1. 4.1 Life Sciences, BY Type (USD Million)
      1. 4.1.1 Variable Speed-Self Excited Induction Generator
      2. 4.1.2 Doubly Fed Induction Generator
      3. 4.1.3 Wound Rotor Induction Generator
      4. 4.1.4 Permanent Magnet Synchronous Generator
    2. 4.2 Life Sciences, BY Rating Type (USD Million)
      1. 4.2.1 Up to 100 KVA
      2. 4.2.2 100 KVA-1 MVA
      3. 4.2.3 1 MVA-25MVA
      4. 4.2.4 Above 25 MVA
    3. 4.3 Life Sciences, BY Technology (USD Million)
      1. 4.3.1 Power Electronics-based Variable Speed Generators
      2. 4.3.2 Mechanical Variable Speed Generators
    4. 4.4 Life Sciences, BY Prime Mover (USD Million)
      1. 4.4.1 Internal Combustion Engines
      2. 4.4.2 Hydro Turbines
      3. 4.4.3 Steam & Gas Turbines
      4. 4.4.4 Wind Turbines
    5. 4.5 Life Sciences, BY End-User (USD Million)
      1. 4.5.1 Hydroelectric Power Generation
      2. 4.5.2 Renewable Power Generation
      3. 4.5.3 Oil & Gas and Mining
      4. 4.5.4 Aerospace and Telecommunications
      5. 4.5.5 Marine and Shipbuilding
      6. 4.5.6 Commercial and Residential
  5. 5 SECTION V: COMPETITIVE ANALYSIS
    1. 5.1 Competitive Landscape
      1. 5.1.1 Overview
      2. 5.1.2 Competitive Analysis
      3. 5.1.3 Market share Analysis
      4. 5.1.4 Major Growth Strategy in the Life Sciences
      5. 5.1.5 Competitive Benchmarking
      6. 5.1.6 Leading Players in Terms of Number of Developments in the Life Sciences
      7. 5.1.7 Key developments and growth strategies
        1. 5.1.7.1 New Product Launch/Service Deployment
        2. 5.1.7.2 Merger & Acquisitions
        3. 5.1.7.3 Joint Ventures
      8. 5.1.8 Major Players Financial Matrix
        1. 5.1.8.1 Sales and Operating Income
        2. 5.1.8.2 Major Players R&D Expenditure. 2023
    2. 5.2 Company Profiles
      1. 5.2.1 General Electric (US)
        1. 5.2.1.1 Financial Overview
        2. 5.2.1.2 Products Offered
        3. 5.2.1.3 Key Developments
        4. 5.2.1.4 SWOT Analysis
        5. 5.2.1.5 Key Strategies
      2. 5.2.2 Siemens (DE)
        1. 5.2.2.1 Financial Overview
        2. 5.2.2.2 Products Offered
        3. 5.2.2.3 Key Developments
        4. 5.2.2.4 SWOT Analysis
        5. 5.2.2.5 Key Strategies
      3. 5.2.3 Caterpillar (US)
        1. 5.2.3.1 Financial Overview
        2. 5.2.3.2 Products Offered
        3. 5.2.3.3 Key Developments
        4. 5.2.3.4 SWOT Analysis
        5. 5.2.3.5 Key Strategies
      4. 5.2.4 Cummins (US)
        1. 5.2.4.1 Financial Overview
        2. 5.2.4.2 Products Offered
        3. 5.2.4.3 Key Developments
        4. 5.2.4.4 SWOT Analysis
        5. 5.2.4.5 Key Strategies
      5. 5.2.5 Kohler (US)
        1. 5.2.5.1 Financial Overview
        2. 5.2.5.2 Products Offered
        3. 5.2.5.3 Key Developments
        4. 5.2.5.4 SWOT Analysis
        5. 5.2.5.5 Key Strategies
      6. 5.2.6 Atlas Copco (SE)
        1. 5.2.6.1 Financial Overview
        2. 5.2.6.2 Products Offered
        3. 5.2.6.3 Key Developments
        4. 5.2.6.4 SWOT Analysis
        5. 5.2.6.5 Key Strategies
      7. 5.2.7 MTU (DE)
        1. 5.2.7.1 Financial Overview
        2. 5.2.7.2 Products Offered
        3. 5.2.7.3 Key Developments
        4. 5.2.7.4 SWOT Analysis
        5. 5.2.7.5 Key Strategies
      8. 5.2.8 Wärtsilä (FI)
        1. 5.2.8.1 Financial Overview
        2. 5.2.8.2 Products Offered
        3. 5.2.8.3 Key Developments
        4. 5.2.8.4 SWOT Analysis
        5. 5.2.8.5 Key Strategies
      9. 5.2.9 Perkins (GB)
        1. 5.2.9.1 Financial Overview
        2. 5.2.9.2 Products Offered
        3. 5.2.9.3 Key Developments
        4. 5.2.9.4 SWOT Analysis
        5. 5.2.9.5 Key Strategies
    3. 5.3 Appendix
      1. 5.3.1 References
      2. 5.3.2 Related Reports
  6. 6 LIST OF FIGURES
    1. 6.1 MARKET SYNOPSIS
    2. 6.2 US MARKET ANALYSIS BY TYPE
    3. 6.3 US MARKET ANALYSIS BY RATING TYPE
    4. 6.4 US MARKET ANALYSIS BY TECHNOLOGY
    5. 6.5 US MARKET ANALYSIS BY PRIME MOVER
    6. 6.6 US MARKET ANALYSIS BY END-USER
    7. 6.7 KEY BUYING CRITERIA OF LIFE SCIENCES
    8. 6.8 RESEARCH PROCESS OF MRFR
    9. 6.9 DRO ANALYSIS OF LIFE SCIENCES
    10. 6.10 DRIVERS IMPACT ANALYSIS: LIFE SCIENCES
    11. 6.11 RESTRAINTS IMPACT ANALYSIS: LIFE SCIENCES
    12. 6.12 SUPPLY / VALUE CHAIN: LIFE SCIENCES
    13. 6.13 LIFE SCIENCES, BY TYPE, 2024 (% SHARE)
    14. 6.14 LIFE SCIENCES, BY TYPE, 2024 TO 2035 (USD Million)
    15. 6.15 LIFE SCIENCES, BY RATING TYPE, 2024 (% SHARE)
    16. 6.16 LIFE SCIENCES, BY RATING TYPE, 2024 TO 2035 (USD Million)
    17. 6.17 LIFE SCIENCES, BY TECHNOLOGY, 2024 (% SHARE)
    18. 6.18 LIFE SCIENCES, BY TECHNOLOGY, 2024 TO 2035 (USD Million)
    19. 6.19 LIFE SCIENCES, BY PRIME MOVER, 2024 (% SHARE)
    20. 6.20 LIFE SCIENCES, BY PRIME MOVER, 2024 TO 2035 (USD Million)
    21. 6.21 LIFE SCIENCES, BY END-USER, 2024 (% SHARE)
    22. 6.22 LIFE SCIENCES, BY END-USER, 2024 TO 2035 (USD Million)
    23. 6.23 BENCHMARKING OF MAJOR COMPETITORS
  7. 7 LIST OF TABLES
    1. 7.1 LIST OF ASSUMPTIONS
  8. 7.1.1
    1. 7.2 US MARKET SIZE ESTIMATES; FORECAST
      1. 7.2.1 BY TYPE, 2025-2035 (USD Million)
      2. 7.2.2 BY RATING TYPE, 2025-2035 (USD Million)
      3. 7.2.3 BY TECHNOLOGY, 2025-2035 (USD Million)
      4. 7.2.4 BY PRIME MOVER, 2025-2035 (USD Million)
      5. 7.2.5 BY END-USER, 2025-2035 (USD Million)
    2. 7.3 PRODUCT LAUNCH/PRODUCT DEVELOPMENT/APPROVAL
  9. 7.3.1
    1. 7.4 ACQUISITION/PARTNERSHIP
  10. 7.4.1

US Life Sciences Market Segmentation

Life Sciences By Type (USD Million, 2025-2035)

  • Variable Speed-Self Excited Induction Generator
  • Doubly Fed Induction Generator
  • Wound Rotor Induction Generator
  • Permanent Magnet Synchronous Generator

Life Sciences By Rating Type (USD Million, 2025-2035)

  • Up to 100 KVA
  • 100 KVA-1 MVA
  • 1 MVA-25MVA
  • Above 25 MVA

Life Sciences By Technology (USD Million, 2025-2035)

  • Power Electronics-based Variable Speed Generators
  • Mechanical Variable Speed Generators

Life Sciences By Prime Mover (USD Million, 2025-2035)

  • Internal Combustion Engines
  • Hydro Turbines
  • Steam & Gas Turbines
  • Wind Turbines

Life Sciences By End-User (USD Million, 2025-2035)

  • Hydroelectric Power Generation
  • Renewable Power Generation
  • Oil & Gas and Mining
  • Aerospace and Telecommunications
  • Marine and Shipbuilding
  • Commercial and Residential