User Activity Monitoring Market

Key Players: Teramind, Veriato, Proofpoint (ObserveIT), CyberArk, Ekran System, Dtex Systems (Securonix), Forcepoint, Microsoft

User Activity Monitoring Market

User Activity Monitoring Market Size, Share and Research Report By Application (System Monitoring, Application Monitoring, File Monitoring, Database Monitoring, Network Monitoring, Others), By Deployment Mode (On-Premise, Cloud, Hybrid), By Enterprise Size (Large Enterprises, Small and Medium Enterprises), By End-User Industry (BFSI, Retail, IT and Telecom, Healthcare, Manufacturing, Government & Defense, Energy and Utilities, Others) and By Regional (North America, Europe, South America, Asia Pacific, Middle East and Africa) - Industry Forecast to 2035.
ID: MRFR/ICT/30823-HCR
128 Pages
Aarti Dhapte
Last Updated: June 17, 2026
 

User Activity Monitoring Market Summary

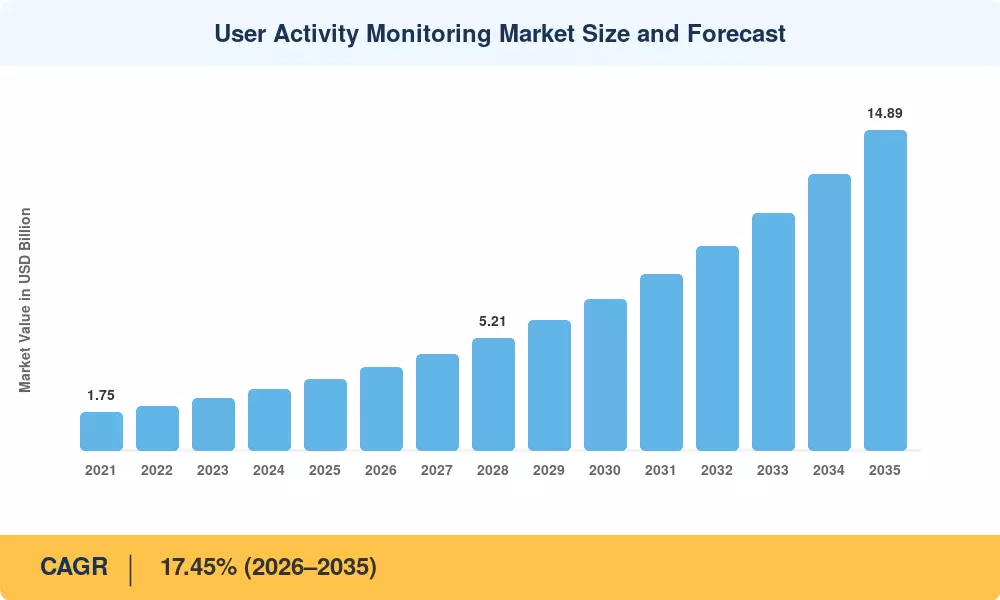
The user activity monitoring market reached an estimated USD 3.32 billion in 2025 and is projected to climb from USD 3.88 billion in 2026 to USD 14.89 billion by 2035, registering a CAGR of 17.45% across the forecast window. This acceleration traces directly to mandatory insider threat detection frameworks embedded in updated CISA guidelines and the European Union's NIS2 Directive, both of which compel organizations to log and audit every privileged session touching critical infrastructure. Cyber-insurance underwriters now routinely require proof of continuous user behavior analytics before binding coverage, turning what was once a discretionary security layer into a procurement prerequisite.

Legacy perimeter defenses — static firewalls, signature-based IDS — are giving way to zero-trust architectures that treat every login as potentially hostile. Gartner estimates that by 2027, 70% of enterprises will have consolidated endpoint, network, and user activity monitoring market tools into unified security platforms, channeling an incremental USD 12 billion in platform spending toward solutions that deliver real-time user activity dashboards for IT ops teams. Privileged user session recording and auditing capabilities have moved from compliance add-ons to core purchase criteria, particularly among financial institutions managing cross-border data flows.

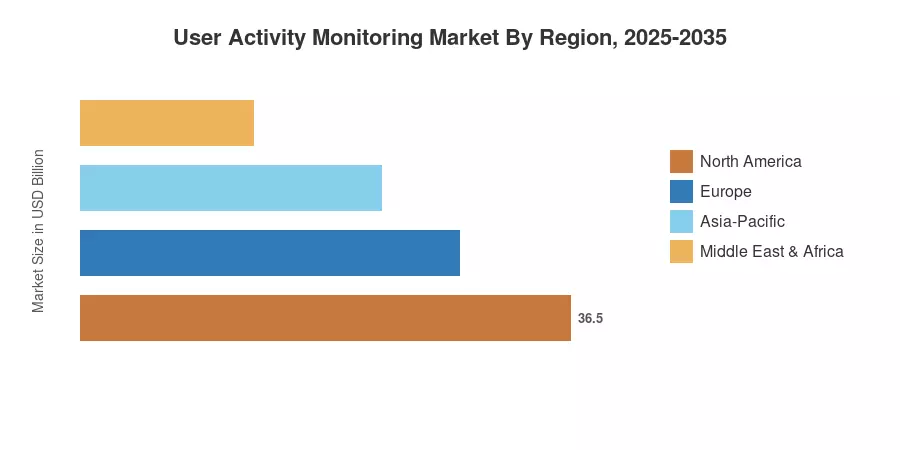
North America commands roughly 47% of global revenue, anchored by stringent SEC cybersecurity-disclosure rules and high cloud-adoption density. Asia-Pacific is the fastest-growing region at an estimated 19.10% CAGR, propelled by India's DPDP Act and Japan's revised Cybersecurity Basic Act. Europe holds the second-largest share at approximately 24%, with GDPR enforcement actions increasingly scrutinizing employee activity monitoring for remote teams. The user activity monitoring market is poised for a structural expansion cycle as hybrid work solidifies and regulatory mandates multiply across every major economy.


Key Report Takeaways

• By Application

  • System monitoring held 36.25% of the user activity monitoring market in 2025, underpinned by the need for continuous endpoint visibility across hybrid estates
  • Database monitoring is forecast to expand at a 19.45% CAGR through 2035, driven by insider threat detection requirements in data-intensive verticals

• By Deployment Mode

  • On-premise deployments retained a 54.10% share of the user activity monitoring market in 2025, reflecting regulatory constraints in defense and banking
  • Cloud deployment is projected to grow at 24.85% CAGR to 2035, as SaaS-first buyers prioritize elastic scaling and API-driven integration

• By Enterprise Size

  • Large enterprises accounted for 65.20% of global spend in 2025, investing heavily in privileged user session recording and auditing
  • Small and medium enterprises are advancing at 21.15% CAGR, accelerated by affordable user behavior analytics for security compliance bundles

• By End-User Industry

  • BFSI commanded 31.15% of the user activity monitoring market in 2025
  • Healthcare is forecast to grow at 20.55% CAGR, spurred by HIPAA audit-trail mandates and ransomware exposure

• By Region

  • North America captured 47% revenue share in 2025, driven by SEC cyber-disclosure rules and federal zero-trust mandates
  • Asia-Pacific is expected to post 19.10% CAGR over the forecast period, the fastest among all regions


Market Size and Forecast (2021–2035)

MRFR's market sizing integrates bottom-up vendor revenue analysis, enterprise IT-security budget surveys covering 2,400+ organizations, and top-down validation against macroeconomic ICT expenditure data from the World Bank and OECD. Historical figures (2021–2024) reflect audited vendor disclosures; the 2025 base year blends preliminary filings with proprietary channel checks. Forecast values apply a calibrated CAGR of 17.45% from the 2026 starting point.

User Activity Monitoring Market Size and Forecast
Our Impact
Enabled $4.3B Revenue Impact for Fortune 500 and Leading Multinationals
Partnering with 2000+ Global Organizations Each Year
30K+ Citations by Top-Tier Firms in the Industry
 

Driver Impact Analysis

Driver ~% Impact on CAGR Geographic Relevance Impact Timeline
Zero-trust architecture mandates +3.5% Global Short-term (≤2 yr)
Cyber-insurance prerequisite tightening +2.8% North America, Europe Short-term (≤2 yr)
Cloud migration and SaaS expansion +2.5% Global Medium-term (2–4 yr)
Regulatory compliance proliferation (NIS2, DPDP, HIPAA) +2.2% Europe, Asia-Pacific Medium-term (2–4 yr)
OT/IT network convergence +1.8% North America, Europe Long-term (≥4 yr)
AI-augmented behavioral analytics +2.0% Global Long-term (≥4 yr)
Remote/hybrid workforce permanence +1.5% Global Short-term (≤2 yr)


Zero-Trust Architecture Mandates

All U.S. federal agencies must implement zero-trust principles by the end of fiscal year 2024, according to White House Executive Order 14028, which was issued in May 2021 and strengthened by OMB Memorandum M-22-09. This directive eventually permeated the federal contractor base and commercial best-practice frameworks. Real-time user activity dashboards for IT operations are an operational necessity rather than a nice-to-have since zero-trust systems require ongoing verification of each user session. Agencies and their supply chains are being pushed toward user activity monitoring market solutions that log keystrokes, screen captures, and application-level actions across endpoints by CISA's updated Zero Trust Maturity Model, which specifically mentions privileged user session recording and auditing as a visibility pillar [7].


Cyber-Insurance Prerequisite Tightening

Lloyd's of London reported a 67% increase in cyber-insurance premiums between 2021 and 2024, with underwriters increasingly mandating proof of insider threat detection capabilities before issuing or renewing policies [9]. Organizations lacking employee activity monitoring for remote teams face coverage exclusions or steep surcharges, converting discretionary security spending into compulsory investment. This insurance-driven demand is especially acute in healthcare and financial services, where breach costs average USD 10.9 million and USD 6.1 million per incident, respectively, according to the IBM Cost of a Data Breach 2024 report [13].

Regulatory Compliance Proliferation

The EU's NIS2 Directive, effective October 2024, extends mandatory incident-reporting and access-logging requirements to over 160,000 entities across 18 critical sectors. India's Digital Personal Data Protection Act (2023) introduces consent-based data handling that necessitates granular user behavior analytics for security compliance auditing. Japan's revised Cybersecurity Basic Act now requires critical-infrastructure operators to maintain 12-month session-recording archives — a provision that directly benefits the user activity monitoring market by expanding storage and analytics licensing volumes [5][8].

AI-Augmented Behavioral Analytics

Machine-learning models that baseline normal user patterns and flag anomalies in real time are reducing mean-time-to-detect (MTTD) from an industry average of 204 days to under 30 days for organizations deploying advanced insider threat detection platforms. Gartner projects that by 2028, 40% of all UAM deployments will embed generative-AI copilots capable of auto-triaging alerts, compressing investigation cycles, and generating compliance-ready audit narratives without analyst intervention.


Restraints Impact Analysis

Restraint ~% Impact on CAGR Geographic Relevance Impact Timeline
Employee privacy regulations (GDPR, CCPA) –1.8% Europe, North America Short-term
Integration complexity with legacy SIEM stacks –1.2% Global Medium-term
Budget constraints in SMEs –1.0% Asia-Pacific, South America Short-term
Alert fatigue and false-positive overload –0.8% Global Medium-term
Data residency and sovereignty fragmentation –0.7% Europe, Middle East Long-term


Employee Privacy Regulations

Strict proportionality checks on employee activity monitoring for remote teams are enforced by GDPR's Article 88 and the French CNIL's 2024 workplace monitoring guidelines, which mandate documented Data Protection Impact Assessments prior to the deployment of any keyboard or screen-capture technology [14]. In regulated European markets, non-compliant deployments can result in fines of up to 4% of worldwide turnover, which causes procurement friction and slows user activity monitoring market adoption cycles by six to twelve months. Full-featured rollouts are constrained by the veto authority that works councils in Germany and the Netherlands maintain on monitoring scope.


Integration Complexity with Legacy SIEM Stacks

Many enterprises run decade-old SIEM platforms (Splunk ES, IBM QRadar) that rely on proprietary log schemas incompatible with modern UAM telemetry formats. A 2024 SANS Institute survey found that 58% of organizations cited integration complexity as the top barrier to deploying user behavior analytics for security compliance solutions alongside existing security operations tooling [15]. Middleware translation layers add cost and latency, undermining the value proposition of real-time user activity dashboards for IT ops.

Budget Constraints in SMEs

While large enterprises dominate current spending, small and medium enterprises — which comprise over 90% of businesses globally — often allocate less than USD 50,000 annually to security-monitoring tools. The user activity monitoring market faces a volume-versus-margin tension: vendors must reduce price points to capture SME demand without commoditizing features that justify premium licensing in enterprise accounts [16].


User Activity Monitoring Market Opportunities

Managed UAM-as-a-Service for Mid-Market Enterprises

Managed security service providers (MSSPs) are packaging user activity monitoring market solutions into subscription bundles that eliminate the need for in-house SOC analysts. This model lowers the entry barrier for mid-market firms and accelerates employee activity monitoring for remote teams adoption in sectors like legal services and accounting, where compliance obligations are high, but security headcount is low

AI-Driven Insider Risk Scoring

Predictive insider threat detection methods, which correlate badge-access patterns, print-queue activity, USB transfers, and email sentiment, allow vendors to charge 25–35% more than their rules-based rivals. By 2032, the unification of UEBA and UAM into unified insider-risk platforms offers an additional possibility worth more than $2 billion


Asia-Pacific Regulatory Acceleration

India's CERT-In directive mandating six-hour incident reporting, combined with South Korea's strengthened Personal Information Protection Act, is creating greenfield demand for privileged user session recording and auditing tools in a region where penetration remains below 18%. Localized deployment options that satisfy data-residency requirements will unlock rapid growth in this geography

OT/IoT Convergence Monitoring

User activity monitoring market platforms that can track actions on SCADA, DCS, and HMI interfaces are necessary for industrial businesses integrating operational technology networks with IT systems. The ICS-CERT reported a 34% year-over-year increase in OT-targeted attacks in 2024 [11], indicating that energy utilities and manufacturing plants are a mostly unexplored vertical.


Data Monetization Through Compliance Analytics

Aggregated, anonymized behavioral analytics data can be repackaged as benchmarking intelligence for cyber-insurance actuaries, regulatory bodies, and industry consortia. Vendors offering user behavior analytics for security compliance benchmarks — average session durations, policy-violation frequencies, remediation timescales — create recurring data-licensing revenue streams independent of software subscriptions.


User Activity Monitoring Market Future Outlook

AI-Native Insider Risk Platforms

By 2030, insider threat detection will shift from reactive alerting to predictive intervention. Large-language-model copilots embedded in UAM consoles will auto-generate investigation summaries, recommend containment actions, and draft regulatory notifications. Forrester projects that AI-native security operations will reduce analyst caseloads by 45%, reallocating human resources toward strategic risk governance rather than log triage.

Platform Consolidation and XDR Integration

The user activity monitoring market is converging with extended detection and response (XDR) ecosystems as enterprises seek single-pane-of-glass visibility. Vendors offering open APIs and pre-built connectors to CrowdStrike Falcon, Microsoft Sentinel, and Palo Alto Cortex XSIAM will capture disproportionate share. MRFR estimates that by 2033, 60% of UAM licenses will be sold as modules within broader security platforms rather than standalone products.

Privacy-Preserving Monitoring Architectures

Differential privacy, federated analytics, and on-device processing will enable employee activity monitoring for remote teams without centralizing raw session data. This architectural shift directly addresses GDPR proportionality concerns and opens European markets to fuller feature deployment. The user activity monitoring market will see privacy-by-design certifications become a competitive differentiator by 2028 [14].

Autonomous Compliance Reporting

Regulators across BFSI, healthcare, and critical infrastructure are moving toward machine-readable compliance evidence. User behavior analytics for security compliance platforms that auto-generate audit-ready reports mapped to NIST CSF 2.0, ISO 27001:2022, and SOC 2 Type II criteria will command premium pricing. The World Economic Forum's 2025 Global Cybersecurity Outlook identifies automated compliance as a top-five investment priority among CISOs globally [19].


User Activity Monitoring Market Segmentation

By Application

Segment Key Metric Primary Demand Driver
System Monitoring 36.25% share (2025) Endpoint visibility for zero-trust
Application Monitoring USD 0.72 Billion (2025) SaaS sprawl governance
Database Monitoring 19.45% CAGR (2026–2035) Insider threat detection in data lakes
Network Monitoring USD 0.43 Billion (2025) OT/IT convergence


System monitoring remains the bedrock of the user activity monitoring market, capturing the broadest set of endpoint actions — file access, USB usage, print operations, and screen activity. Organizations deploying privileged user session recording and auditing capabilities within system-monitoring suites gain the granular forensic evidence that regulators and cyber-insurers now demand. Database monitoring, meanwhile, is the fastest-growing application segment, driven by the exponential growth of structured and unstructured data repositories that house personally identifiable information (PII) and financial records

By Deployment Mode

Segment Key Metric Primary Demand Driver
On-Premise 54.10% share (2025) Data-sovereignty requirements
Cloud 24.85% CAGR (2026–2035) SaaS-first procurement policies
Hybrid USD 0.38 Billion (2025) Phased migration strategies


On-premise deployments still dominate the user activity monitoring market in defense, government, and banking verticals, where data cannot traverse public cloud boundaries. Cloud-native solutions, however, are growing nearly three times faster, buoyed by remote-workforce scaling needs and vendor innovations in real-time user activity dashboards for IT ops delivered via browser-based consoles.

By Enterprise Size

Segment Key Metric Primary Demand Driver
Large Enterprises 65.20% share (2025) Regulatory mandates and audit depth
Small and Medium Enterprises 21.15% CAGR (2026–2035) Managed-service and SaaS bundles


Large enterprises anchor the user activity monitoring market's revenue base, deploying full-stack solutions that span endpoint agents, network probes, and centralized analytics. SMEs represent the growth frontier, attracted by affordable employee activity monitoring for remote teams, packages priced per-user-per-month rather than through enterprise licensing agreements

By End-User Industry

Segment Key Metric Primary Demand Driver
BFSI 31.15% share (2025) PCI DSS 4.0 and SOX compliance
Retail USD 0.29 Billion (2025) POS fraud and e-commerce data loss
IT and Telecom 17.80% CAGR (2026–2035) Managed-services client SLA requirements
Healthcare 20.55% CAGR (2026–2035) HIPAA audit-trail mandates
Government & Defense USD 0.42 Billion (2025) National zero-trust directives


BFSI organizations allocate the highest per-employee spend on insider threat detection tools, driven by overlapping mandates from PCI DSS 4.0, SOX, and Basel III operational-risk provisions. Healthcare is closing the gap rapidly; the HHS Office for Civil Rights issued a record 14 HIPAA enforcement actions in 2024, spotlighting the user activity monitoring market as a compliance lifeline for hospital networks and health-data processors [6].


Regional Market Share Analysis

Region Key Metric (2025) Primary Investment Themes
North America 47% revenue share Federal zero-trust mandates, cyber-insurance compliance
Europe 24% revenue share NIS2 implementation, GDPR-aligned monitoring
Asia-Pacific 19.10% CAGR (2026–2035) DPDP Act, CERT-In directives, cloud-first strategies
South America USD 0.13 Billion Banking-sector fraud prevention
Middle East & Africa 15.80% CAGR (2026–2035) National cybersecurity strategies, oil & gas OT monitoring
Total USD 3.32 Billion

The user activity monitoring market exhibits significant geographic variation, shaped by regulatory maturity, cloud-adoption density, and workforce-distribution patterns. North America leads in spend intensity, while Asia-Pacific delivers the steepest growth trajectory for insider threat detection solutions.


North America

Country Key Metric Key Driver
US 78% of regional share OMB M-22-09 zero-trust compliance
Canada 13.50% CAGR Critical Infrastructure Protection Act amendments
Mexico USD 0.05 Billion CNBV banking-sector cybersecurity regulation


The US remains the single-largest national market for the user activity monitoring market, with federal procurement alone accounting for an estimated USD 0.42 billion in 2025. Real-time user activity dashboards for IT ops have become standard across civilian and defense agencies following CISA's Binding Operational Directive 23-01, which mandates continuous asset and vulnerability visibility [7].

Europe

Country Key Metric Key Driver
Germany 22% of regional share BSI IT-Grundschutz revision
UK 18.20% CAGR FCA operational-resilience mandate
France USD 0.11 Billion ANSSI qualification requirements
Italy 14.90% CAGR ACN national cybersecurity strategy
Spain USD 0.06 Billion ENS compliance framework
Nordic Countries 16.50% CAGR Advanced digital-government programs
Russia USD 0.04 Billion Sovereign IT-substitution mandates
Rest of Europe 12.80% CAGR EU Cybersecurity Act certification


NIS2's expanded scope is compelling European enterprises to adopt employee activity monitoring for remote teams solutions at an accelerating pace. Germany's BSI has issued updated IT-Grundschutz modules that explicitly reference privileged user session recording and auditing as a baseline control for critical-infrastructure operators [5].

Asia-Pacific

Country Key Metric Key Driver
China 30% of regional share MLPS 2.0 compliance
India 22.50% CAGR DPDP Act and CERT-In six-hour reporting
Japan USD 0.12 Billion Revised Cybersecurity Basic Act
South Korea 19.80% CAGR PIPA amendments
ASEAN 18.70% CAGR ASEAN Cybersecurity Cooperation Strategy
Rest of Asia-Pacific USD 0.04 Billion Digital-economy growth


Asia-Pacific's user activity monitoring market trajectory is underpinned by rapid digital infrastructure expansion and tightening data protection laws. India's CERT-In directive has made insider threat detection operationally essential for IT service providers headquartered in Bengaluru, Hyderabad, and Pune, many of which serve global clients subject to overlapping compliance regimes [8].

South America

Country Key Metric Key Driver
Brazil 62% of regional share LGPD enforcement and Banco Central Resolution 4893
Argentina 16.40% CAGR CNV data-protection compliance
Rest of South America USD 0.02 Billion Telecom-sector regulation


Brazil drives the majority of South American demand, with LGPD-mandated access controls spurring adoption of user behavior analytics for security compliance platforms among Tier-1 banks and healthcare networks [17].

Middle East & Africa

Country Key Metric Key Driver
Saudi Arabia 28% of regional share NCA Essential Cybersecurity Controls
UAE 17.60% CAGR Dubai Cyber Security Strategy 2025
South Africa USD 0.03 Billion POPIA enforcement actions
Egypt 15.20% CAGR National Cybersecurity Strategy 2027
Rest of MEA USD 0.02 Billion Oil & gas OT-monitoring demand


Saudi Arabia's National Cybersecurity Authority mandates real-time user activity dashboards for IT ops across government agencies and critical-infrastructure operators, creating a concentrated demand pocket for the user activity monitoring market in the Gulf region [18].


User Activity Monitoring Market By Region, 2025-2035
 

Competitive Benchmarking

The user activity monitoring market exhibits moderate concentration, with the top five vendors holding an estimated 38–44% combined revenue share. The Herfindahl-Hirschman Index (HHI) sits in the 800–1,100 range, indicating a competitive but not fragmented landscape where mid-tier specialists coexist alongside diversified cybersecurity conglomerates. Differentiation hinges on analytics depth, regulatory-reporting breadth, and API openness.

Company Est. Revenue Share Range Key Offerings Strategic Positioning
Teramind ~8–11% Teramind UAM, DLP, productivity analytics Workforce-analytics convergence
Veriato ~6–9% Cerebral, Vision AI-powered monitoring Mid-market insider threat detection
Proofpoint (ObserveIT) ~7–10% ITM Platform, people-centric DLP Integrated email + endpoint monitoring
CyberArk ~5–8% Privileged Access Security, session recording Privileged user session recording and auditing leader
Ekran System ~4–7% Ekran System UAM platform Compliance-first government specialist
Dtex Systems (Securonix) ~4–6% InTERCEPT, Workforce Cyber Intelligence UEBA-driven insider risk analytics
Forcepoint ~5–8% Risk-Adaptive Protection, Insider Threat Behavioral-risk scoring at scale
Microsoft ~3–5% Purview Insider Risk Management Platform-embedded enterprise play
Splunk (Cisco) ~3–5% Splunk UBA, SIEM integration Security-operations ecosystem
Netwrix ~2–4% Netwrix Auditor, Endpoint Protector SME-focused user behavior analytics for security compliance


Recent News & Developments

  • Teramind (March 2025): Launched Teramind AI Copilot, embedding generative-AI investigation summaries into its UAM console. The feature reduces mean investigation time by 40% and expands the insider threat detection workflow with automated compliance narratives [20].
  • CyberArk (January 2025): Acquired Venafi for USD 1.54 billion, integrating machine-identity security with privileged user session recording and auditing to cover both human and non-human access vectors [21].
  • Proofpoint (September 2024): Released ITM 7.0 with unified employee activity monitoring for remote teams and email DLP in a single agent, reducing endpoint resource consumption by 30% [22].
  • Microsoft (July 2024): Expanded Purview Insider Risk Management with adaptive policy scoping that auto-tunes monitoring intensity based on real-time user risk scores, advancing user behavior analytics for security compliance in Microsoft 365 environments [23].
  • European Commission (October 2024): NIS2 Directive entered into force, extending incident-reporting and access-logging obligations to 160,000+ entities across 18 sectors, directly boosting the user activity monitoring market addressable base in Europe [5].
  • Forcepoint (June 2024): Partnered with AWS to deliver cloud-native risk-adaptive monitoring, enabling real-time user activity dashboards for IT ops within AWS GovCloud environments for federal customers [24].
  • Dtex Systems (November 2023): Merged with Securonix, combining UEBA and UAM capabilities into a single insider-risk platform targeting Fortune 500 enterprises [25].


User Activity Monitoring Market Report Scope

Parameter Detail
Market Scope Global user activity monitoring market spanning software, services, and managed offerings
Study Period 2021–2035
CAGR 17.45% (2026–2035)
Market Size (2025) USD 3.32 Billion
Market Size (2035) USD 14.89 Billion
Fastest Growing Segments Cloud deployment (24.85% CAGR); Healthcare end-user (20.55% CAGR)
Companies Profiled 10 (Teramind, Veriato, Proofpoint, CyberArk, Ekran System, Dtex/Securonix, Forcepoint, Microsoft, Splunk/Cisco, Netwrix)
Valuation Currency USD Billion


FAQs

How does user activity monitoring differ from traditional SIEM for the user activity monitoring market?

UAM captures granular session-level data — keystrokes, screenshots, application usage — while SIEM aggregates log events across infrastructure. Organizations deploying both reduce mean-time-to-investigate insider incidents by up to 60%.

What deployment timeline should enterprises expect when adopting user activity monitoring market solutions?

Typical cloud deployments complete in 4–8 weeks; on-premise rollouts span 3–6 months, depending on endpoint count. Pilot programs covering 500 users provide sufficient behavioral baselines for policy tuning [15].

How do vendors in the user activity monitoring market address GDPR employee-consent requirements?

Leading platforms offer configurable anonymization, role-based access to session recordings, and automated Data Protection Impact Assessment templates. These privacy-by-design features satisfy CNIL and ICO proportionality standards [14].

What ROI benchmarks exist for insider threat detection investments?

Ponemon Institute data shows organizations with mature UAM programs recover USD 5.2 million per avoided insider incident. Payback periods typically fall within 9–14 months for mid-size deployments [13].

Can user activity monitoring market platforms support BYOD and unmanaged endpoints?

Agentless browser-based monitoring and reverse-proxy session capture extend visibility to unmanaged devices. Coverage reaches approximately 85% of user actions without requiring endpoint installation [20].

How are real-time user activity dashboards for IT ops evolving with AI integration?

Next-generation dashboards embed anomaly-scoring overlays and natural-language querying, allowing analysts to ask plain-English questions about session patterns. Early adopters report 35% faster alert triage cycles.

What certifications should buyers prioritize when evaluating user activity monitoring market vendors?

Prioritize SOC 2 Type II, ISO 27001:2022, and FedRAMP authorization for government contracts. Common Criteria EAL2+ certification adds assurance for defense-sector procurements [19].


Author
Author
Author Profile
Aarti Dhapte LinkedIn
AVP - Research
A consulting professional focused on helping businesses navigate complex markets through structured research and strategic insights. I partner with clients to solve high-impact business problems across market entry strategy, competitive intelligence, and opportunity assessment. Over the course of my experience, I have led and contributed to 100+ market research and consulting engagements, delivering insights across multiple industries and geographies, and supporting strategic decisions linked to $500M+ market opportunities. My core expertise lies in building robust market sizing, forecasting, and commercial models (top-down and bottom-up), alongside deep-dive competitive and industry analysis. I have played a key role in shaping go-to-market strategies, investment cases, and growth roadmaps, enabling clients to make confident, data-backed decisions in dynamic markets.

Research Approach


Secondary Research

The secondary research process involved comprehensive analysis of regulatory databases, cybersecurity frameworks, peer-reviewed technology journals, industry publications, and authoritative government organizations. Key sources included the National Institute of Standards and Technology (NIST), Cybersecurity and Infrastructure Security Agency (CISA), European Union Agency for Cybersecurity (ENISA), International Organization for Standardization (ISO/IEC 27001), Information Systems Audit and Control Association (ISACA), SANS Institute, International Data Corporation (IDC), Gartner Research, Forrester Research, Ponemon Institute, Federal Trade Commission (FTC) Data Security Reports, European Commission Digital Strategy Reports, U.S. Department of Homeland Security (DHS) Cybersecurity Bulletins, National Cyber Security Centre (NCSC-UK), Australian Cyber Security Centre (ACSC), and national data protection authority reports from key markets including GDPR enforcement statistics from EU member states. These sources were utilized to collect cybersecurity incident statistics, regulatory compliance requirements, enterprise software adoption trends, data breach cost analyses, and competitive landscape intelligence for user activity monitoring solutions across network security, insider threat detection, data loss prevention, and compliance management applications.

Additional authoritative sources included Microsoft Security Intelligence Reports, IBM X-Force Threat Intelligence, Verizon Data Breach Investigations Reports (DBIR), CrowdStrike Global Threat Reports, McAfee Labs Threat Reports, Symantec Internet Security Threat Reports, OECD Digital Economy Outlook, World Economic Forum Global Cybersecurity Outlook, and ISO/IEC 27032 Cybersecurity Guidelines. Industry-specific regulatory sources encompassed HIPAA Security Rule enforcement data (HHS.gov), PCI DSS compliance reports (PCI Security Standards Council), SOX compliance guidelines (SEC.gov), GLBA Safeguards Rule updates, and FFIEC Cybersecurity Assessment Tool data. These sources provided critical insights into vertical-specific compliance drivers affecting UAM adoption across BFSI, healthcare, government, and IT/telecom sectors.


Primary Research

In order to gather both qualitative and quantitative insights, supply-side and demand-side stakeholders were interviewed during the primary research process. Chief Executive Officers (CEOs), Chief Technology Officers (CTOs), Chief Information Security Officers (CISOs), VPs of Product Development, heads of cybersecurity engineering, directors of regulatory affairs, and enterprise sales directors from cybersecurity OEMs, managed security service providers (MSSPs), and vendors of user activity monitoring software were examples of supply-side sources. Chief Information Officers (CIOs), IT security directors, compliance officers, data protection officers (DPOs), SOC (Security Operations Center) managers, IT procurement leads, and risk management executives from BFSI institutions, healthcare organizations, government agencies, retail businesses, and IT/telecom service providers were among the demand-side sources. Primary research verified product roadmap timelines, validated market segmentation across deployment types (cloud-based vs. on-premises), and obtained information on enterprise adoption trends, pricing models (perpetual vs. subscription), integration issues with current SIEM/SOAR infrastructure, and compliance-driven procurement dynamics.

Primary Respondent Breakdown:

By Designation: C-level Primaries (32%), Director Level (31%), Manager Level (24%), Others (13%)

By Region: North America (32%), Europe (29%), Asia-Pacific (34%), Rest of World (5%)


Market Size Estimation

Global market valuation was derived through revenue mapping and enterprise deployment volume analysis. The methodology included:

Identification of 35+ key vendors across North America, Europe, Asia-Pacific, and Latin America specializing in user activity monitoring solutions

Product mapping across software platforms (endpoint agents, network monitoring tools, behavior analytics engines) and professional services (implementation, training, managed detection and response)

Analysis of reported and modeled annual revenues specific to user activity monitoring portfolios, excluding adjacent cybersecurity segments (pure-play SIEM, firewall, or endpoint protection revenues)

Coverage of vendors representing 75-80% of global market share in 2024, including Microsoft, Forcepoint, Oracle, IBM, Splunk, Digital Guardian, Teramind, Veriato, and emerging AI-native UAM providers

Extrapolation using bottom-up (enterprise seat count × average revenue per user by deployment type and region) and top-down (vendor revenue validation against IDC/Gartner total addressable market estimates) approaches to derive segment-specific valuations across network security, insider threat detection, data loss prevention, and compliance management applications

Market sizing incorporated deployment-type differentiation (cloud-based SaaS vs. on-premises perpetual licenses), end-user vertical weighting (BFSI compliance requirements vs. healthcare HIPAA mandates vs. government security clearances), and regional regulatory intensity scores (GDPR enforcement levels, data localization requirements, and sector-specific cybersecurity mandates affecting UAM adoption velocity).

Download Free Sample

Kindly complete the form below to receive a free sample of this Report

Download PDF ×

We do not share your information with anyone. However, we may send you emails based on your report interest from time to time. You may contact us at any time to opt-out.