×
Hero Background
English
Chinese
French
Japanese
Korean
German
Spanish

Vapor Recovery Units Market Size

ID: MRFR/EnP/8543-CR
155 Pages
Anshula Mandaokar
February 2021

Vapor Recovery Units Market Research Report Information By Horsepower (Up to 50 HP, 51-200 HP, 201-500 HP, 501-1000 HP, Above 1000 HP), By Application (Oil Tank Vapors, Marine Loading Terminals, Barge Degassing, Truck Loading, Vapor Particulate Filter, Railcar Loading, Storage Terminals), By End-Use (Oil & Gas, Landfill, Chemicals & Petrochemicals, Pharmaceuticals) And By Region (North America, Europe, Asia-Pacific, And Rest Of The World) –Market Forecast Till 2035

Share:
Download PDF ×

We do not share your information with anyone. However, we may send you emails based on your report interest from time to time. You may contact us at any time to opt-out.

Vapor Recovery Units Market Infographic
Purchase Options

Vapor Recovery Units Size

Vapor Recovery Units Market Growth Projections and Opportunities

The storage of oil within the oil and gas industry offers a significant opportunity for the market of vapor recovery units. These units play a crucial role when installed on onshore oil storage tanks, as they help recover volatile organic compound (VOC) emissions from the tanks. This process is essential for both environmental and economic reasons. In simple terms, the vapor recovery units function by drawing out hydrocarbon vapors from the oil storage tanks under low pressure, typically ranging from 4 ounces to 2 pounds per square inch (psi). Once extracted, these vapors are directed to a separator suction scrubber, also known as a knock-out pot. This scrubber serves the purpose of separating any liquids that may be concentrated in the piping network. From the knock-out pot, the vapors then pass through a compressor that facilitates the low-pressure suction for the entire system. The vapor recovery units are designed with a control pilot to prevent the formation of a vacuum in the top of the storage tank. This is a critical safety measure to ensure the stability of the entire system. After passing through the compressor, the vapors are metered and removed from the system. There are two main destinations for these recovered vapors: pipeline sale or onsite fuel supply. This means that the hydrocarbon vapors, which would otherwise contribute to environmental pollution, are efficiently captured and repurposed for further use, contributing to sustainable practices within the industry. One notable feature of vapor recovery units is their high efficiency. These units are capable of recovering more than 95% of the hydrocarbon vapors from the storage tanks. This not only helps in environmental conservation by preventing the release of harmful compounds into the atmosphere but also has economic benefits by reclaiming valuable hydrocarbons that can be utilized in various applications. In the context of geographical usage, several countries in the Middle East, including Saudi Arabia, the UAE, and Qatar, have embraced the adoption of vapor recovery units. This trend is particularly prominent because these countries are key players in the global oil and gas industry. By incorporating vapor recovery units into their oil storage facilities, they demonstrate a commitment to sustainable and responsible practices in the extraction and storage of oil. The widespread use of vapor recovery units in these regions can be attributed to the presence of significant market players in the oil and gas industry. These companies recognize the importance of implementing advanced technologies to minimize the environmental impact of their operations. vapor recovery units play a crucial role in the oil and gas industry, especially in the storage of oil. By efficiently capturing and repurposing hydrocarbon vapors, these units contribute to both environmental preservation and economic sustainability. The high efficiency of vapor recovery units, recovering over 95% of the vapors, makes them a valuable asset in mitigating the environmental impact of the oil and gas sector. The adoption of these units in key regions such as the Middle East signifies a positive shift towards responsible and sustainable practices within the industry.
Vapor Recovery Units Market Size Graph
Author
Anshula Mandaokar
Team Lead - Research

Anshula Mandaokar holds an academic degree in Chemical Engineering and has been contributing to the field for more than 5 years. She has expertise in Market Research and Business Consulting and serves as a Team Lead for a reputed Market Research firm under the Chemicals and Materials domain spectrum. She has worked on multiple projects, generating explicit results in a quick turnaround time. Her understanding of data interpretation justifies her role as a leader.

Leave a Comment

FAQs

What is the projected market valuation of the Vapor Recovery Units Market by 2035?

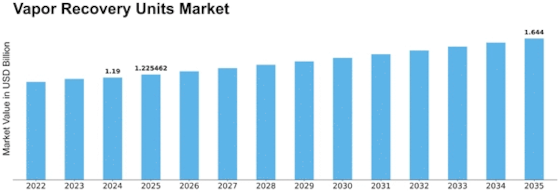
The Vapor Recovery Units Market is projected to reach a valuation of 1.644 USD Billion by 2035.

What was the market valuation of the Vapor Recovery Units Market in 2024?

In 2024, the Vapor Recovery Units Market was valued at 1.19 USD Billion.

What is the expected CAGR for the Vapor Recovery Units Market during the forecast period 2025 - 2035?

The expected CAGR for the Vapor Recovery Units Market during the forecast period 2025 - 2035 is 2.98%.

Which companies are considered key players in the Vapor Recovery Units Market?

Key players in the Vapor Recovery Units Market include Cameron International, Emerson Electric Co., Honeywell International Inc., and Schneider Electric SE.

What segment of horsepower shows the highest valuation in the Vapor Recovery Units Market?

The 51-200 HP segment shows the highest valuation, ranging from 0.3575 to 0.4825 USD Billion.

Which application segment has the highest projected valuation in the Vapor Recovery Units Market?

The Oil Tank Vapors application segment has the highest projected valuation, estimated between 0.35 and 0.48 USD Billion.

Market Summary

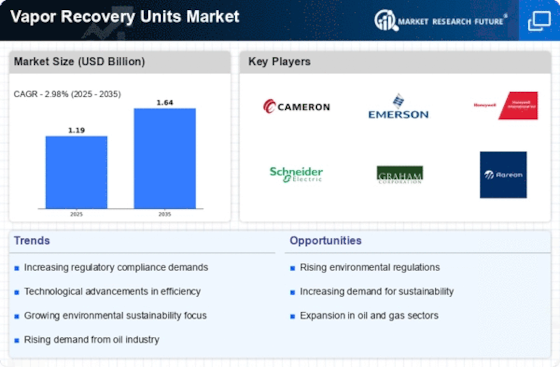
As per MRFR analysis, the Vapor Recovery Units Market Size was estimated at 1.19 USD Billion in 2024. The Vapor Recovery Units industry is projected to grow from 1.225 in 2025 to 1.644 by 2035, exhibiting a compound annual growth rate (CAGR) of 2.98 during the forecast period 2025 - 2035.

Key Market Trends & Highlights

The Vapor Recovery Units Market is poised for growth driven by regulatory compliance and technological advancements.

  • North America remains the largest market for vapor recovery units, driven by stringent regulatory compliance and environmental standards. The Asia-Pacific region is emerging as the fastest-growing market, fueled by increasing industrialization and environmental awareness. The Up to 50 HP segment dominates the market, while the 501-1000 HP segment is experiencing rapid growth due to rising demand. Key market drivers include regulatory compliance and an increased focus on sustainability, which are shaping industry dynamics.

Market Size & Forecast

2024 Market Size 1.19 (USD Billion)
2035 Market Size 1.644 (USD Billion)
CAGR (2025 - 2035) 2.98%
Largest Regional Market Share in 2024 Asia Pacific

Major Players

<p>Cameron International (US), <a href="https://go.emersonautomation.com/PFM-VaporRecovery">Emerson Electric Co</a>. (US), Honeywell International Inc. (US), Schneider Electric SE (FR), Graham Corporation (US), <a href="https://aereon.com/emissions_reduction/gas-vapor-recovery-systems/">Aereon</a> (US), John Zink Hamworthy Combustion (US), Veolia Environnement S.A. (FR), Sierra Instruments, Inc. (US)</p>

Market Trends

The Vapor Recovery Units Market is currently experiencing a notable transformation, driven by increasing environmental regulations and a growing emphasis on sustainability. Industries are increasingly adopting vapor recovery technologies to minimize emissions and enhance operational efficiency. This shift appears to be influenced by both governmental policies and corporate social responsibility initiatives, which prioritize reducing the carbon footprint. As a result, manufacturers are innovating and developing advanced vapor recovery systems that not only comply with regulations but also offer improved performance and reliability. Moreover, the market seems to be witnessing a rise in demand from various sectors, including oil and gas, chemical processing, and waste management. These industries are recognizing the potential benefits of vapor recovery units in capturing and reusing volatile organic compounds, thereby reducing waste and improving profitability. The integration of smart technologies, such as IoT and automation, is also likely to enhance the functionality of these units, making them more appealing to end-users. Overall, the Vapor Recovery Units Market is poised for growth as stakeholders increasingly prioritize environmental stewardship and operational efficiency.

Regulatory Compliance and Environmental Standards

The increasing stringency of environmental regulations is compelling industries to adopt vapor recovery units. Compliance with these standards not only mitigates environmental impact but also enhances corporate reputation.

Technological Advancements

Innovations in vapor recovery technology are driving market growth. Enhanced efficiency, reliability, and integration with smart systems are making these units more attractive to various sectors.

Rising Demand from Diverse Industries

The demand for vapor recovery units is expanding across multiple sectors, including oil and gas and chemical processing. This trend indicates a broader recognition of the benefits associated with emission reduction and resource recovery.

Vapor Recovery Units Market Market Drivers

Technological Advancements

Technological advancements play a pivotal role in shaping the Vapor Recovery Units Market. Innovations in vapor recovery technologies, such as improved efficiency and enhanced recovery rates, are driving market growth. The integration of advanced sensors and automation systems allows for real-time monitoring and optimization of vapor recovery processes, thereby increasing operational efficiency. Furthermore, the development of more compact and modular vapor recovery units is making them more accessible to smaller enterprises, expanding the market reach. According to recent estimates, the adoption of these advanced technologies could lead to a reduction in operational costs by up to 20%, making vapor recovery systems more attractive to a broader range of industries. Consequently, the Vapor Recovery Units Market is poised for significant growth as companies increasingly invest in cutting-edge technologies to enhance their environmental performance.

Increased Focus on Sustainability

An increased focus on sustainability is significantly influencing the Vapor Recovery Units Market. As businesses and consumers alike become more environmentally conscious, there is a growing expectation for companies to adopt sustainable practices. Vapor recovery units are essential in reducing greenhouse gas emissions and improving air quality, aligning with the sustainability goals of many organizations. This trend is particularly evident in industries such as petrochemicals and manufacturing, where the implementation of vapor recovery systems is seen as a proactive measure to enhance corporate social responsibility. Furthermore, the market is likely to benefit from the rising trend of corporate sustainability reporting, which often highlights emissions reduction efforts. As a result, the Vapor Recovery Units Market is expected to expand as more companies recognize the importance of integrating sustainability into their operational strategies.

Rising Demand from Diverse Industries

The Vapor Recovery Units Market is witnessing rising demand from a variety of sectors, including oil and gas, chemical processing, and waste management. As industries strive to minimize emissions and comply with environmental regulations, the need for effective vapor recovery solutions has become paramount. The oil and gas sector, in particular, is a major contributor to market growth, with an increasing number of facilities implementing vapor recovery systems to capture and reuse vapors during production and transportation. Additionally, the chemical processing industry is adopting these units to mitigate the release of harmful substances into the atmosphere. Market analysis indicates that the demand from these sectors is expected to grow at a rate of 5% annually, further solidifying the position of the Vapor Recovery Units Market as a critical component in achieving sustainability goals.

Economic Incentives and Funding Opportunities

Economic incentives and funding opportunities are emerging as key drivers for the Vapor Recovery Units Market. Various governments and financial institutions are offering grants, subsidies, and tax incentives to encourage the adoption of environmentally friendly technologies, including vapor recovery systems. These financial incentives can significantly lower the initial investment costs for companies, making it more feasible for them to implement vapor recovery solutions. Additionally, the availability of funding for research and development in this sector is fostering innovation and the introduction of more efficient systems. Market projections suggest that the presence of such economic incentives could lead to a 15% increase in market penetration over the next few years. Consequently, the Vapor Recovery Units Market stands to benefit from these supportive economic measures, facilitating broader adoption across multiple sectors.

Regulatory Compliance and Environmental Standards

The Vapor Recovery Units Market is experiencing a notable surge due to stringent regulatory compliance and environmental standards. Governments across various regions are implementing laws aimed at reducing emissions and promoting sustainable practices. For instance, regulations concerning volatile organic compounds (VOCs) have necessitated the adoption of vapor recovery systems in industries such as oil and gas, chemical manufacturing, and waste management. This regulatory landscape is expected to drive the market, as companies seek to avoid penalties and enhance their environmental credentials. The market is projected to grow at a compound annual growth rate (CAGR) of approximately 6% over the next five years, reflecting the increasing emphasis on compliance and sustainability. As such, the Vapor Recovery Units Market is likely to witness heightened investment and innovation in response to these evolving standards.

Market Segment Insights

By Horsepower: Up to 50 HP (Largest) vs. 501-1000 HP (Fastest-Growing)

<p>In the Vapor Recovery Units Market, the distribution of market share among different horsepower segments reveals that the 'Up to 50 HP' category dominates the current landscape, capturing a significant portion of the total demand. This segment is primarily favored for smaller operations and applications requiring minimal vapor recovery capacity, making it a staple in many industries. Conversely, the '501-1000 HP' segment is emerging rapidly, indicating a growing need for higher capacity systems amid increasing regulatory pressures on emissions and vapor recovery in larger industrial setups. Growth trends within the horsepower segments are shaped by various industry dynamics. Demand for higher horsepower units is driven by the expansion of industries requiring rigorous compliance with environmental standards. Additionally, technological advancements are enhancing the efficiency and reliability of larger units, making the '501-1000 HP' segment attractive. As larger enterprises seek to optimize their operations while managing compliance, the market for higher horsepower vapor recovery units is expected to expand significantly over the coming years.</p>

<p>Up to 50 HP (Dominant) vs. 201-500 HP (Emerging)</p>

<p>The 'Up to 50 HP' segment serves as the dominant player in the Vapor Recovery Units Market, primarily targeting smaller-scale operations where compact and efficient vapor recovery solutions are needed. This segment's popularity stems from its ability to address lower-capacity needs while remaining cost-effective. In contrast, the '201-500 HP' range is categorized as an emerging segment, positioning itself as an intermediary solution that caters to medium-sized operations. The growth of this segment is driven by rising manufacturing activities and the need for balanced vapor recovery systems that can handle moderate volumes without incurring excessive costs. Together, these segments illustrate a diverse market aiming to accommodate various industrial needs.</p>

By Application: Oil Tank Vapors (Largest) vs. Marine Loading Terminals (Fastest-Growing)

<p>In the Vapor Recovery Units Market, the application segment is characterized by varying levels of market share, with Oil Tank Vapors holding the largest share due to its extensive usage in managing emissions from storage tanks. This segment benefits from stringent regulations surrounding air quality and the oil and gas industry's demand for effective vapor handling solutions. Following closely, Marine Loading Terminals are gaining traction and are identified as the fastest-growing application segment, propelled by the increasing shipping activities and the need for sustainable practices in marine operations.</p>

<p>Oil Tank Vapors (Dominant) vs. Marine Loading Terminals (Emerging)</p>

<p>Oil Tank Vapors represent the dominant application segment in the Vapor Recovery Units Market, primarily because of their critical role in reducing volatile organic compounds (VOCs) released during the storage and transfer processes in oil operations. This segment is well-established and is supported by existing infrastructure and technology. Conversely, Marine Loading Terminals, while still emerging compared to oil tank vapors, are rapidly evolving due to rising environmental concerns and regulatory pressures on marine shipping. This segment is increasingly adopting advanced vapor recovery solutions to mitigate emissions, showcasing a significant growth potential as the maritime industry prioritizes sustainability and compliance with global emissions standards.</p>

By End-Use: Oil & Gas (Largest) vs. Chemicals & Petrochemicals (Fastest-Growing)

<p>The Vapor Recovery Units Market is primarily segmented by end-use, which includes Oil &amp; Gas, Landfill, Chemicals &amp; Petrochemicals, and Pharmaceuticals. The Oil &amp; Gas sector holds the largest share, driven by increasing environmental regulations and the need for efficient gas recovery processes. Following this, the Chemicals &amp; Petrochemicals segment is rapidly gaining traction, reflecting a shift towards sustainable production practices across various industries. Growth trends in this segment are influenced by factors such as technological advancements, stricter emissions regulations, and the push for greener energy solutions. Specifically, the ongoing industrialization and urbanization in emerging economies contribute to the increased adoption of vapor recovery units in the Chemicals &amp; Petrochemicals sector. The Pharmaceutical industry is also adopting these units to align with environmental norms, albeit at a slower pace than Oil &amp; Gas and Chemicals.</p>

<p>Oil &amp; Gas: Dominant vs. Chemicals &amp; Petrochemicals: Emerging</p>

<p>The Oil &amp; Gas segment is the dominant player in the Vapor Recovery Units Market, characterized by its mature infrastructure and significant investments in gas recovery technologies. This segment benefits from a well-defined regulatory framework that emphasizes emissions reduction, compelling companies to prioritize vapor recovery solutions. On the other hand, the Chemicals &amp; Petrochemicals segment is emerging, driven by increased focus on sustainable practices and waste management. Companies in this sector are adopting advanced vapor recovery systems to maximize operational efficiency while minimizing environmental impacts. This dual focus on profitability and compliance positions Chemicals &amp; Petrochemicals as a rapidly evolving field in the vapor recovery landscape.</p>

Get more detailed insights about Vapor Recovery Units Market Research Report - Global Forecast till 2035

Regional Insights

North America : Market Leader in Innovation

North America is the largest market for Vapor Recovery Units Market (VRUs), accounting for approximately 45% of the global market share. The region's growth is driven by stringent environmental regulations and a rising demand for efficient emission control technologies. The U.S. leads in market size, followed by Canada, which contributes around 15% to the market. Regulatory frameworks such as the Clean Air Act further catalyze the adoption of VRUs, ensuring compliance with emission standards. The competitive landscape in North America is robust, featuring key players like Cameron International, Emerson Electric, and Honeywell International. These companies are at the forefront of technological advancements, focusing on innovative solutions to enhance efficiency and reduce emissions. The presence of established firms and a strong regulatory environment fosters a dynamic market, encouraging continuous improvement and investment in vapor recovery technologies.

Europe : Regulatory-Driven Market Growth

Europe is a significant player in the Vapor Recovery Units Market, holding approximately 30% of the global share. The region's growth is primarily driven by stringent environmental regulations aimed at reducing greenhouse gas emissions. Countries like Germany and France are leading the charge, with Germany accounting for about 12% of the market. The European Union's commitment to sustainability and initiatives like the European Green Deal are pivotal in promoting the adoption of VRUs across various industries. The competitive landscape in Europe is characterized by the presence of major players such as Schneider Electric and Veolia Environnement. These companies are actively involved in developing innovative solutions that align with regulatory requirements. The market is also witnessing increased collaboration between manufacturers and regulatory bodies to enhance compliance and promote sustainable practices, ensuring a robust growth trajectory for VRUs in the region.

Asia-Pacific : Emerging Market Potential

Asia-Pacific is rapidly emerging as a key market for Vapor Recovery Units Market, contributing around 20% to the global market share. The region's growth is fueled by increasing industrialization, urbanization, and a growing focus on environmental sustainability. Countries like China and India are at the forefront, with China alone accounting for approximately 10% of the market. Government initiatives aimed at reducing air pollution and enhancing energy efficiency are significant drivers of demand for VRUs in this region. The competitive landscape in Asia-Pacific is evolving, with both local and international players vying for market share. Companies are increasingly investing in research and development to tailor solutions that meet regional needs. The presence of key players such as Aereon and John Zink Hamworthy Combustion further strengthens the market, as they bring advanced technologies and expertise to the region, fostering growth and innovation in vapor recovery solutions.

Middle East and Africa : Resource-Rich Market Dynamics

The Middle East and Africa region is gradually developing its Vapor Recovery Units Market, holding about 5% of the global share. The growth is primarily driven by increasing oil and gas exploration activities and a rising awareness of environmental regulations. Countries like Saudi Arabia and South Africa are leading the market, with Saudi Arabia contributing approximately 3% to the overall share. The region's focus on sustainable practices and compliance with international standards is fostering demand for VRUs. The competitive landscape in the Middle East and Africa is characterized by a mix of local and international players. Companies are increasingly focusing on partnerships and collaborations to enhance their market presence. The involvement of key players in the region is crucial for driving innovation and improving the efficiency of vapor recovery technologies, ensuring that the market continues to evolve in line with global trends.

Key Players and Competitive Insights

The Vapor Recovery Units Market is currently characterized by a dynamic competitive landscape, driven by increasing regulatory pressures and a growing emphasis on environmental sustainability. Key players such as Cameron International (US), Emerson Electric Co. (US), and Honeywell International Inc. (US) are strategically positioning themselves through innovation and technological advancements. These companies are not only enhancing their product offerings but are also focusing on regional expansion and partnerships to strengthen their market presence. The collective strategies of these firms contribute to a moderately fragmented market structure, where competition is intensifying as companies seek to differentiate themselves through advanced solutions and customer-centric approaches.

In terms of business tactics, companies are increasingly localizing manufacturing and optimizing their supply chains to enhance operational efficiency. This trend is particularly evident in the Vapor Recovery Units Market, where firms are adapting to regional demands and regulatory requirements. The competitive structure remains moderately fragmented, with several players vying for market share. The influence of key players is significant, as they leverage their technological capabilities and market knowledge to establish a foothold in various geographical regions.

In August 2025, Emerson Electric Co. (US) announced the launch of a new line of vapor recovery units designed to meet stringent environmental regulations. This strategic move underscores Emerson's commitment to innovation and sustainability, positioning the company as a leader in providing advanced solutions that align with global environmental goals. The introduction of these units is expected to enhance Emerson's competitive edge, particularly in markets with rigorous emissions standards.

In July 2025, Honeywell International Inc. (US) entered into a partnership with a leading oil and gas company to develop integrated vapor recovery solutions. This collaboration aims to enhance operational efficiency and reduce emissions across the supply chain. By leveraging Honeywell's technological expertise and the partner's industry knowledge, this strategic alliance is likely to yield significant advancements in vapor recovery technologies, further solidifying Honeywell's position in the market.

In September 2025, Cameron International (US) expanded its manufacturing capabilities by investing in a new facility dedicated to the production of vapor recovery units. This investment reflects Cameron's strategic focus on increasing production capacity to meet rising demand. The establishment of this facility is anticipated to enhance supply chain reliability and reduce lead times, thereby improving customer satisfaction and strengthening Cameron's competitive position.

As of October 2025, the Vapor Recovery Units Market is witnessing trends such as digitalization, sustainability, and the integration of artificial intelligence in operational processes. These trends are reshaping the competitive landscape, as companies increasingly prioritize innovation over price-based competition. Strategic alliances are becoming more prevalent, enabling firms to pool resources and expertise to develop cutting-edge solutions. Looking ahead, competitive differentiation is likely to evolve, with a greater emphasis on technological advancements and supply chain resilience, positioning companies to better meet the challenges of a rapidly changing market.

Key Companies in the Vapor Recovery Units Market market include

Industry Developments

  • Q3 2024: EFC gases and advanced materials announces $210 million investment for new manufacturing facility in McGregor, Texas EFC gases and advanced materials revealed a strategic investment of $210 million to establish a state-of-the-art manufacturing facility in McGregor, Texas, aimed at supporting the rapidly growing U.S. semiconductor industry and expanding vapor recovery unit production capacity.[3]
  • Q1 2025: Taiyo Oil selects Honeywell UOP Ethanol jo jet technology for sustainable aviation fuel production in Okinawa, Japan Honeywell announced that Taiyo Oil has chosen its UOP Ethanol jo jet technology to produce sustainable aviation fuel at Taiyo's Okinawa operations, integrating advanced vapor recovery solutions for improved environmental compliance.[3]

Future Outlook

Vapor Recovery Units Market Future Outlook

<p>The Vapor Recovery Units Market is projected to grow at a 2.98% CAGR from 2024 to 2035, driven by regulatory pressures, environmental concerns, and technological advancements.</p>

New opportunities lie in:

  • <p>Expansion into emerging markets with stringent emission regulations.</p><p>Development of advanced VRU systems for oil and gas applications.</p><p>Integration of IoT technology for real-time monitoring and efficiency.</p>

<p>By 2035, the market is expected to solidify its position as a critical component in emission control strategies.</p>

Market Segmentation

Vapor Recovery Units Market End-Use Outlook

  • Oil & Gas
  • Landfill
  • Chemicals & Petrochemicals
  • Pharmaceuticals

Vapor Recovery Units Market Horsepower Outlook

  • Up to 50 HP
  • 51-200 HP
  • 201-500 HP
  • 501-1000 HP
  • Above 1000 HP

Vapor Recovery Units Market Application Outlook

  • Oil Tank Vapors
  • Marine Loading Terminals
  • Barge Degassing
  • Truck Loading
  • Vapor Particulate Filter
  • Railcar Loading
  • Storage Terminals

Report Scope

MARKET SIZE 20241.19(USD Billion)
MARKET SIZE 20251.225(USD Billion)
MARKET SIZE 20351.644(USD Billion)
COMPOUND ANNUAL GROWTH RATE (CAGR)2.98% (2024 - 2035)
REPORT COVERAGERevenue Forecast, Competitive Landscape, Growth Factors, and Trends
BASE YEAR2024
Market Forecast Period2025 - 2035
Historical Data2019 - 2024
Market Forecast UnitsUSD Billion
Key Companies ProfiledMarket analysis in progress
Segments CoveredMarket segmentation analysis in progress
Key Market OpportunitiesIncreasing regulatory pressures on emissions create growth opportunities in the Vapor Recovery Units Market.
Key Market DynamicsRising regulatory pressures drive demand for Vapor Recovery Units, enhancing environmental compliance and operational efficiency.
Countries CoveredNorth America, Europe, APAC, South America, MEA

FAQs

What is the projected market valuation of the Vapor Recovery Units Market by 2035?

The Vapor Recovery Units Market is projected to reach a valuation of 1.644 USD Billion by 2035.

What was the market valuation of the Vapor Recovery Units Market in 2024?

In 2024, the Vapor Recovery Units Market was valued at 1.19 USD Billion.

What is the expected CAGR for the Vapor Recovery Units Market during the forecast period 2025 - 2035?

The expected CAGR for the Vapor Recovery Units Market during the forecast period 2025 - 2035 is 2.98%.

Which companies are considered key players in the Vapor Recovery Units Market?

Key players in the Vapor Recovery Units Market include Cameron International, Emerson Electric Co., Honeywell International Inc., and Schneider Electric SE.

What segment of horsepower shows the highest valuation in the Vapor Recovery Units Market?

The 51-200 HP segment shows the highest valuation, ranging from 0.3575 to 0.4825 USD Billion.

Which application segment has the highest projected valuation in the Vapor Recovery Units Market?

The Oil Tank Vapors application segment has the highest projected valuation, estimated between 0.35 and 0.48 USD Billion.

  1. SECTION I: EXECUTIVE SUMMARY AND KEY HIGHLIGHTS
    1. EXECUTIVE SUMMARY
      1. Market Overview
      2. Key Findings
      3. Market Segmentation
      4. Competitive Landscape
      5. Challenges and Opportunities
      6. Future Outlook 2
  2. SECTION II: SCOPING, METHODOLOGY AND MARKET STRUCTURE
    1. MARKET INTRODUCTION
      1. Definition
      2. Scope of the study
    2. RESEARCH METHODOLOGY
      1. Overview
      2. Data Mining
      3. Secondary Research
      4. Primary Research
      5. Forecasting Model
      6. Market Size Estimation
      7. Data Triangulation
      8. Validation 3
  3. SECTION III: QUALITATIVE ANALYSIS
    1. MARKET DYNAMICS
      1. Overview
      2. Drivers
      3. Restraints
      4. Opportunities
    2. MARKET FACTOR ANALYSIS
      1. Value chain Analysis
      2. Porter's Five Forces Analysis
      3. COVID-19 Impact Analysis
  4. SECTION IV: QUANTITATIVE ANALYSIS
    1. Energy & Power, BY Horsepower (USD Billion)
      1. Up to 50 HP
      2. 51-200 HP
      3. 201-500 HP
      4. 501-1000 HP
      5. Above 1000 HP
    2. Energy & Power, BY Application (USD Billion)
      1. Oil Tank Vapors
      2. Marine Loading Terminals
      3. Barge Degassing
      4. Truck Loading
      5. Vapor Particulate Filter
      6. Railcar Loading
      7. Storage Terminals
    3. Energy & Power, BY End-Use (USD Billion)
      1. Oil & Gas
      2. Landfill
      3. Chemicals & Petrochemicals
      4. Pharmaceuticals
    4. Energy & Power, BY Region (USD Billion)
      1. North America
      2. Europe
      3. APAC
      4. South America
      5. MEA
  5. SECTION V: COMPETITIVE ANALYSIS
    1. Competitive Landscape
      1. Overview
      2. Competitive Analysis
      3. Market share Analysis
      4. Major Growth Strategy in the Energy & Power
      5. Competitive Benchmarking
      6. Leading Players in Terms of Number of Developments in the Energy & Power
      7. Key developments and growth strategies
      8. Major Players Financial Matrix
    2. Company Profiles
      1. Cameron International (US)
      2. Emerson Electric Co. (US)
      3. Honeywell International Inc. (US)
      4. Schneider Electric SE (FR)
      5. Graham Corporation (US)
      6. Aereon (US)
      7. John Zink Hamworthy Combustion (US)
      8. Veolia Environnement S.A. (FR)
      9. Sierra Instruments, Inc. (US)
    3. Appendix
      1. References
      2. Related Reports 6 LIST OF FIGURES
    4. MARKET SYNOPSIS
    5. NORTH AMERICA MARKET ANALYSIS
    6. US MARKET ANALYSIS BY HORSEPOWER
    7. US MARKET ANALYSIS BY APPLICATION
    8. US MARKET ANALYSIS BY END-USE
    9. CANADA MARKET ANALYSIS BY HORSEPOWER
    10. CANADA MARKET ANALYSIS BY APPLICATION
    11. CANADA MARKET ANALYSIS BY END-USE
    12. EUROPE MARKET ANALYSIS
    13. GERMANY MARKET ANALYSIS BY HORSEPOWER
    14. GERMANY MARKET ANALYSIS BY APPLICATION
    15. GERMANY MARKET ANALYSIS BY END-USE
    16. UK MARKET ANALYSIS BY HORSEPOWER
    17. UK MARKET ANALYSIS BY APPLICATION
    18. UK MARKET ANALYSIS BY END-USE
    19. FRANCE MARKET ANALYSIS BY HORSEPOWER
    20. FRANCE MARKET ANALYSIS BY APPLICATION
    21. FRANCE MARKET ANALYSIS BY END-USE
    22. RUSSIA MARKET ANALYSIS BY HORSEPOWER
    23. RUSSIA MARKET ANALYSIS BY APPLICATION
    24. RUSSIA MARKET ANALYSIS BY END-USE
    25. ITALY MARKET ANALYSIS BY HORSEPOWER
    26. ITALY MARKET ANALYSIS BY APPLICATION
    27. ITALY MARKET ANALYSIS BY END-USE
    28. SPAIN MARKET ANALYSIS BY HORSEPOWER
    29. SPAIN MARKET ANALYSIS BY APPLICATION
    30. SPAIN MARKET ANALYSIS BY END-USE
    31. REST OF EUROPE MARKET ANALYSIS BY HORSEPOWER
    32. REST OF EUROPE MARKET ANALYSIS BY APPLICATION
    33. REST OF EUROPE MARKET ANALYSIS BY END-USE
    34. APAC MARKET ANALYSIS
    35. CHINA MARKET ANALYSIS BY HORSEPOWER
    36. CHINA MARKET ANALYSIS BY APPLICATION
    37. CHINA MARKET ANALYSIS BY END-USE
    38. INDIA MARKET ANALYSIS BY HORSEPOWER
    39. INDIA MARKET ANALYSIS BY APPLICATION
    40. INDIA MARKET ANALYSIS BY END-USE
    41. JAPAN MARKET ANALYSIS BY HORSEPOWER
    42. JAPAN MARKET ANALYSIS BY APPLICATION
    43. JAPAN MARKET ANALYSIS BY END-USE
    44. SOUTH KOREA MARKET ANALYSIS BY HORSEPOWER
    45. SOUTH KOREA MARKET ANALYSIS BY APPLICATION
    46. SOUTH KOREA MARKET ANALYSIS BY END-USE
    47. MALAYSIA MARKET ANALYSIS BY HORSEPOWER
    48. MALAYSIA MARKET ANALYSIS BY APPLICATION
    49. MALAYSIA MARKET ANALYSIS BY END-USE
    50. THAILAND MARKET ANALYSIS BY HORSEPOWER
    51. THAILAND MARKET ANALYSIS BY APPLICATION
    52. THAILAND MARKET ANALYSIS BY END-USE
    53. INDONESIA MARKET ANALYSIS BY HORSEPOWER
    54. INDONESIA MARKET ANALYSIS BY APPLICATION
    55. INDONESIA MARKET ANALYSIS BY END-USE
    56. REST OF APAC MARKET ANALYSIS BY HORSEPOWER
    57. REST OF APAC MARKET ANALYSIS BY APPLICATION
    58. REST OF APAC MARKET ANALYSIS BY END-USE
    59. SOUTH AMERICA MARKET ANALYSIS
    60. BRAZIL MARKET ANALYSIS BY HORSEPOWER
    61. BRAZIL MARKET ANALYSIS BY APPLICATION
    62. BRAZIL MARKET ANALYSIS BY END-USE
    63. MEXICO MARKET ANALYSIS BY HORSEPOWER
    64. MEXICO MARKET ANALYSIS BY APPLICATION
    65. MEXICO MARKET ANALYSIS BY END-USE
    66. ARGENTINA MARKET ANALYSIS BY HORSEPOWER
    67. ARGENTINA MARKET ANALYSIS BY APPLICATION
    68. ARGENTINA MARKET ANALYSIS BY END-USE
    69. REST OF SOUTH AMERICA MARKET ANALYSIS BY HORSEPOWER
    70. REST OF SOUTH AMERICA MARKET ANALYSIS BY APPLICATION
    71. REST OF SOUTH AMERICA MARKET ANALYSIS BY END-USE
    72. MEA MARKET ANALYSIS
    73. GCC COUNTRIES MARKET ANALYSIS BY HORSEPOWER
    74. GCC COUNTRIES MARKET ANALYSIS BY APPLICATION
    75. GCC COUNTRIES MARKET ANALYSIS BY END-USE
    76. SOUTH AFRICA MARKET ANALYSIS BY HORSEPOWER
    77. SOUTH AFRICA MARKET ANALYSIS BY APPLICATION
    78. SOUTH AFRICA MARKET ANALYSIS BY END-USE
    79. REST OF MEA MARKET ANALYSIS BY HORSEPOWER
    80. REST OF MEA MARKET ANALYSIS BY APPLICATION
    81. REST OF MEA MARKET ANALYSIS BY END-USE
    82. KEY BUYING CRITERIA OF ENERGY & POWER
    83. RESEARCH PROCESS OF MRFR
    84. DRO ANALYSIS OF ENERGY & POWER
    85. DRIVERS IMPACT ANALYSIS: ENERGY & POWER
    86. RESTRAINTS IMPACT ANALYSIS: ENERGY & POWER
    87. SUPPLY / VALUE CHAIN: ENERGY & POWER
    88. ENERGY & POWER, BY HORSEPOWER, 2024 (% SHARE)
    89. ENERGY & POWER, BY HORSEPOWER, 2024 TO 2035 (USD Billion)
    90. ENERGY & POWER, BY APPLICATION, 2024 (% SHARE)
    91. ENERGY & POWER, BY APPLICATION, 2024 TO 2035 (USD Billion)
    92. ENERGY & POWER, BY END-USE, 2024 (% SHARE)
    93. ENERGY & POWER, BY END-USE, 2024 TO 2035 (USD Billion)
    94. BENCHMARKING OF MAJOR COMPETITORS 7 LIST OF TABLES
    95. LIST OF ASSUMPTIONS
    96. North America MARKET SIZE ESTIMATES; FORECAST
      1. BY HORSEPOWER, 2025-2035 (USD Billion)
      2. BY APPLICATION, 2025-2035 (USD Billion)
      3. BY END-USE, 2025-2035 (USD Billion)
    97. US MARKET SIZE ESTIMATES; FORECAST
      1. BY HORSEPOWER, 2025-2035 (USD Billion)
      2. BY APPLICATION, 2025-2035 (USD Billion)
      3. BY END-USE, 2025-2035 (USD Billion)
    98. Canada MARKET SIZE ESTIMATES; FORECAST
      1. BY HORSEPOWER, 2025-2035 (USD Billion)
      2. BY APPLICATION, 2025-2035 (USD Billion)
      3. BY END-USE, 2025-2035 (USD Billion)
    99. Europe MARKET SIZE ESTIMATES; FORECAST
      1. BY HORSEPOWER, 2025-2035 (USD Billion)
      2. BY APPLICATION, 2025-2035 (USD Billion)
      3. BY END-USE, 2025-2035 (USD Billion)
    100. Germany MARKET SIZE ESTIMATES; FORECAST
      1. BY HORSEPOWER, 2025-2035 (USD Billion)
      2. BY APPLICATION, 2025-2035 (USD Billion)
      3. BY END-USE, 2025-2035 (USD Billion)
    101. UK MARKET SIZE ESTIMATES; FORECAST
      1. BY HORSEPOWER, 2025-2035 (USD Billion)
      2. BY APPLICATION, 2025-2035 (USD Billion)
      3. BY END-USE, 2025-2035 (USD Billion)
    102. France MARKET SIZE ESTIMATES; FORECAST
      1. BY HORSEPOWER, 2025-2035 (USD Billion)
      2. BY APPLICATION, 2025-2035 (USD Billion)
      3. BY END-USE, 2025-2035 (USD Billion)
    103. Russia MARKET SIZE ESTIMATES; FORECAST
      1. BY HORSEPOWER, 2025-2035 (USD Billion)
      2. BY APPLICATION, 2025-2035 (USD Billion)
      3. BY END-USE, 2025-2035 (USD Billion)
    104. Italy MARKET SIZE ESTIMATES; FORECAST
      1. BY HORSEPOWER, 2025-2035 (USD Billion)
      2. BY APPLICATION, 2025-2035 (USD Billion)
      3. BY END-USE, 2025-2035 (USD Billion)
    105. Spain MARKET SIZE ESTIMATES; FORECAST
      1. BY HORSEPOWER, 2025-2035 (USD Billion)
      2. BY APPLICATION, 2025-2035 (USD Billion)
      3. BY END-USE, 2025-2035 (USD Billion)
    106. Rest of Europe MARKET SIZE ESTIMATES; FORECAST
      1. BY HORSEPOWER, 2025-2035 (USD Billion)
      2. BY APPLICATION, 2025-2035 (USD Billion)
      3. BY END-USE, 2025-2035 (USD Billion)
    107. APAC MARKET SIZE ESTIMATES; FORECAST
      1. BY HORSEPOWER, 2025-2035 (USD Billion)
      2. BY APPLICATION, 2025-2035 (USD Billion)
      3. BY END-USE, 2025-2035 (USD Billion)
    108. China MARKET SIZE ESTIMATES; FORECAST
      1. BY HORSEPOWER, 2025-2035 (USD Billion)
      2. BY APPLICATION, 2025-2035 (USD Billion)
      3. BY END-USE, 2025-2035 (USD Billion)
    109. India MARKET SIZE ESTIMATES; FORECAST
      1. BY HORSEPOWER, 2025-2035 (USD Billion)
      2. BY APPLICATION, 2025-2035 (USD Billion)
      3. BY END-USE, 2025-2035 (USD Billion)
    110. Japan MARKET SIZE ESTIMATES; FORECAST
      1. BY HORSEPOWER, 2025-2035 (USD Billion)
      2. BY APPLICATION, 2025-2035 (USD Billion)
      3. BY END-USE, 2025-2035 (USD Billion)
    111. South Korea MARKET SIZE ESTIMATES; FORECAST
      1. BY HORSEPOWER, 2025-2035 (USD Billion)
      2. BY APPLICATION, 2025-2035 (USD Billion)
      3. BY END-USE, 2025-2035 (USD Billion)
    112. Malaysia MARKET SIZE ESTIMATES; FORECAST
      1. BY HORSEPOWER, 2025-2035 (USD Billion)
      2. BY APPLICATION, 2025-2035 (USD Billion)
      3. BY END-USE, 2025-2035 (USD Billion)
    113. Thailand MARKET SIZE ESTIMATES; FORECAST
      1. BY HORSEPOWER, 2025-2035 (USD Billion)
      2. BY APPLICATION, 2025-2035 (USD Billion)
      3. BY END-USE, 2025-2035 (USD Billion)
    114. Indonesia MARKET SIZE ESTIMATES; FORECAST
      1. BY HORSEPOWER, 2025-2035 (USD Billion)
      2. BY APPLICATION, 2025-2035 (USD Billion)
      3. BY END-USE, 2025-2035 (USD Billion)
    115. Rest of APAC MARKET SIZE ESTIMATES; FORECAST
      1. BY HORSEPOWER, 2025-2035 (USD Billion)
      2. BY APPLICATION, 2025-2035 (USD Billion)
      3. BY END-USE, 2025-2035 (USD Billion)
    116. South America MARKET SIZE ESTIMATES; FORECAST
      1. BY HORSEPOWER, 2025-2035 (USD Billion)
      2. BY APPLICATION, 2025-2035 (USD Billion)
      3. BY END-USE, 2025-2035 (USD Billion)
    117. Brazil MARKET SIZE ESTIMATES; FORECAST
      1. BY HORSEPOWER, 2025-2035 (USD Billion)
      2. BY APPLICATION, 2025-2035 (USD Billion)
      3. BY END-USE, 2025-2035 (USD Billion)
    118. Mexico MARKET SIZE ESTIMATES; FORECAST
      1. BY HORSEPOWER, 2025-2035 (USD Billion)
      2. BY APPLICATION, 2025-2035 (USD Billion)
      3. BY END-USE, 2025-2035 (USD Billion)
    119. Argentina MARKET SIZE ESTIMATES; FORECAST
      1. BY HORSEPOWER, 2025-2035 (USD Billion)
      2. BY APPLICATION, 2025-2035 (USD Billion)
      3. BY END-USE, 2025-2035 (USD Billion)
    120. Rest of South America MARKET SIZE ESTIMATES; FORECAST
      1. BY HORSEPOWER, 2025-2035 (USD Billion)
      2. BY APPLICATION, 2025-2035 (USD Billion)
      3. BY END-USE, 2025-2035 (USD Billion)
    121. MEA MARKET SIZE ESTIMATES; FORECAST
      1. BY HORSEPOWER, 2025-2035 (USD Billion)
      2. BY APPLICATION, 2025-2035 (USD Billion)
      3. BY END-USE, 2025-2035 (USD Billion)
    122. GCC Countries MARKET SIZE ESTIMATES; FORECAST
      1. BY HORSEPOWER, 2025-2035 (USD Billion)
      2. BY APPLICATION, 2025-2035 (USD Billion)
      3. BY END-USE, 2025-2035 (USD Billion)
    123. South Africa MARKET SIZE ESTIMATES; FORECAST
      1. BY HORSEPOWER, 2025-2035 (USD Billion)
      2. BY APPLICATION, 2025-2035 (USD Billion)
      3. BY END-USE, 2025-2035 (USD Billion)
    124. Rest of MEA MARKET SIZE ESTIMATES; FORECAST
      1. BY HORSEPOWER, 2025-2035 (USD Billion)
      2. BY APPLICATION, 2025-2035 (USD Billion)
      3. BY END-USE, 2025-2035 (USD Billion)
    125. PRODUCT LAUNCH/PRODUCT DEVELOPMENT/APPROVAL
    126. ACQUISITION/PARTNERSHIP

Vapor Recovery Units Market Segmentation

Vapor Recovery Units Market By Horsepower Outlook (USD Billion, 2018-2032)

Up to 50 HP

51-200 HP

201-500 HP

501-1000 HP

Above 1000 HP

Vapor Recovery Units Market By Application Outlook (USD Billion, 2018-2032)

Oil Tank Vapors

Marine Loading Terminals

Barge Degassing

Truck Loading

Vapor Particulate Filter

Railcar Loading

Storage Terminals

Vapor Recovery Units Market By End-Use Outlook (USD Billion, 2018-2032)

Oil & Gas

Landfill

Chemicals & Petrochemicals

Pharmaceuticals

Vapor Recovery Units Market Regional Outlook (USD Billion, 2018-2032)

North America Outlook (USD Billion, 2018-2032)

  •  

North America Vapor Recovery Units Market By Horsepower

Up to 50 HP

51-200 HP

201-500 HP

501-1000 HP

Above 1000 HP

North America Vapor Recovery Units Market By Application

  •  
    •  

Oil Tank Vapors

Marine Loading Terminals

Barge Degassing

Truck Loading

Vapor Particulate Filter

Railcar Loading

Storage Terminals

  •  

North America Vapor Recovery Units Market By End-Use

Oil & Gas

Landfill

Chemicals & Petrochemicals

Pharmaceuticals

US Outlook (USD Billion, 2018-2032)

US Vapor Recovery Units Market By Horsepower

Up to 50 HP

51-200 HP

201-500 HP

501-1000 HP

Above 1000 HP

US Vapor Recovery Units Market By Application

Oil Tank Vapors

Marine Loading Terminals

Barge Degassing

Truck Loading

Vapor Particulate Filter

Railcar Loading

Storage Terminals

US Vapor Recovery Units Market By End-Use

Oil & Gas

Landfill

Chemicals & Petrochemicals

Pharmaceuticals

CANADA Outlook (USD Billion, 2018-2032)

CANADA Vapor Recovery Units Market By Horsepower

Up to 50 HP

51-200 HP

201-500 HP

501-1000 HP

Above 1000 HP

CANADA Vapor Recovery Units Market By Application

Oil Tank Vapors

Marine Loading Terminals

Barge Degassing

Truck Loading

Vapor Particulate Filter

Railcar Loading

Storage Terminals

CANADA Vapor Recovery Units Market By End-Use

Oil & Gas

Landfill

Chemicals & Petrochemicals

Pharmaceuticals

Europe Outlook (USD Billion, 2018-2032)

  •  

Europe Vapor Recovery Units Market By Horsepower

Up to 50 HP

51-200 HP

201-500 HP

501-1000 HP

Above 1000 HP

Europe Vapor Recovery Units Market By Application

Oil Tank Vapors

Marine Loading Terminals

Barge Degassing

Truck Loading

Vapor Particulate Filter

Railcar Loading

Storage Terminals

Europe Vapor Recovery Units Market By End-Use

Oil & Gas

Landfill

Chemicals & Petrochemicals

Pharmaceuticals

Germany Outlook (USD Billion, 2018-2032)

Germany Vapor Recovery Units Market By Horsepower

Up to 50 HP

51-200 HP

201-500 HP

501-1000 HP

Above 1000 HP

Germany Vapor Recovery Units Market By Application

Oil Tank Vapors

Marine Loading Terminals

Barge Degassing

Truck Loading

Vapor Particulate Filter

Railcar Loading

Storage Terminals

Germany Vapor Recovery Units Market By End-Use

Oil & Gas

Landfill

Chemicals & Petrochemicals

Pharmaceuticals

France Outlook (USD Billion, 2018-2032)

France Vapor Recovery Units Market By Horsepower

Up to 50 HP

51-200 HP

201-500 HP

501-1000 HP

Above 1000 HP

France Vapor Recovery Units Market By Application

Oil Tank Vapors

Marine Loading Terminals

Barge Degassing

Truck Loading

Vapor Particulate Filter

Railcar Loading

Storage Terminals

France Vapor Recovery Units Market By End-Use

Oil & Gas

Landfill

Chemicals & Petrochemicals

Pharmaceuticals

UK Outlook (USD Billion, 2018-2032)

UK Vapor Recovery Units Market By Horsepower

Up to 50 HP

51-200 HP

201-500 HP

501-1000 HP

Above 1000 HP

UK Vapor Recovery Units Market By Application

Oil Tank Vapors

Marine Loading Terminals

Barge Degassing

Truck Loading

Vapor Particulate Filter

Railcar Loading

Storage Terminals

UK Vapor Recovery Units Market By End-Use

Oil & Gas

Landfill

Chemicals & Petrochemicals

Pharmaceuticals

ITALY Outlook (USD Billion, 2018-2032)

ITALY Vapor Recovery Units Market By Horsepower

Up to 50 HP

51-200 HP

201-500 HP

501-1000 HP

Above 1000 HP

ITALY Vapor Recovery Units Market By Application

Oil Tank Vapors

Marine Loading Terminals

Barge Degassing

Truck Loading

Vapor Particulate Filter

Railcar Loading

Storage Terminals

ITALY Vapor Recovery Units Market By End-Use

Oil & Gas

Landfill

Chemicals & Petrochemicals

Pharmaceuticals

SPAIN Outlook (USD Billion, 2018-2032)

Spain Vapor Recovery Units Market By Horsepower

Up to 50 HP

51-200 HP

201-500 HP

501-1000 HP

Above 1000 HP

Spain Vapor Recovery Units Market By Application

Oil Tank Vapors

Marine Loading Terminals

Barge Degassing

Truck Loading

Vapor Particulate Filter

Railcar Loading

Storage Terminals

Spain Vapor Recovery Units Market By End-Use

Oil & Gas

Landfill

Chemicals & Petrochemicals

Pharmaceuticals

Rest Of Europe Outlook (USD Billion, 2018-2032)

Rest Of Europe Vapor Recovery Units Market By Horsepower

Up to 50 HP

51-200 HP

201-500 HP

501-1000 HP

Above 1000 HP

REST OF EUROPE Vapor Recovery Units Market By Application

Oil Tank Vapors

Marine Loading Terminals

Barge Degassing

Truck Loading

Vapor Particulate Filter

Railcar Loading

Storage Terminals

REST OF EUROPE Vapor Recovery Units Market By End-Use

Oil & Gas

Landfill

Chemicals & Petrochemicals

Pharmaceuticals

  • Asia-Pacific Outlook (USD Billion, 2018-2032)

Asia-Pacific Vapor Recovery Units Market By Horsepower

Up to 50 HP

51-200 HP

201-500 HP

501-1000 HP

Above 1000 HP

Asia-Pacific Vapor Recovery Units Market By Application

Oil Tank Vapors

Marine Loading Terminals

Barge Degassing

Truck Loading

Vapor Particulate Filter

Railcar Loading

Storage Terminals

Asia-Pacific Vapor Recovery Units Market By End-Use

Oil & Gas

Landfill

Chemicals & Petrochemicals

Pharmaceuticals

China Outlook (USD Billion, 2018-2032)

China Vapor Recovery Units Market By Horsepower

Up to 50 HP

51-200 HP

201-500 HP

501-1000 HP

Above 1000 HP

China Vapor Recovery Units Market By Application

Oil Tank Vapors

Marine Loading Terminals

Barge Degassing

Truck Loading

Vapor Particulate Filter

Railcar Loading

Storage Terminals

China Vapor Recovery Units Market By End-Use

Oil & Gas

Landfill

Chemicals & Petrochemicals

Pharmaceuticals

Japan Outlook (USD Billion, 2018-2032)

Japan Vapor Recovery Units Market By Horsepower

Up to 50 HP

51-200 HP

201-500 HP

501-1000 HP

Above 1000 HP

Japan Vapor Recovery Units Market By Application

Oil Tank Vapors

Marine Loading Terminals

Barge Degassing

Truck Loading

Vapor Particulate Filter

Railcar Loading

Storage Terminals

Japan Vapor Recovery Units Market By End-Use

Oil & Gas

Landfill

Chemicals & Petrochemicals

Pharmaceuticals

India Outlook (USD Billion, 2018-2032)

India Vapor Recovery Units Market By Horsepower

Up to 50 HP

51-200 HP

201-500 HP

501-1000 HP

Above 1000 HP

India Vapor Recovery Units Market By Application

Oil Tank Vapors

Marine Loading Terminals

Barge Degassing

Truck Loading

Vapor Particulate Filter

Railcar Loading

Storage Terminals

India Vapor Recovery Units Market By End-Use

Oil & Gas

Landfill

Chemicals & Petrochemicals

Pharmaceuticals

Australia Outlook (USD Billion, 2018-2032)

Australia Vapor Recovery Units Market By Horsepower

Up to 50 HP

51-200 HP

201-500 HP

501-1000 HP

Above 1000 HP

Australia Vapor Recovery Units Market By Application

Oil Tank Vapors

Marine Loading Terminals

Barge Degassing

Truck Loading

Vapor Particulate Filter

Railcar Loading

Storage Terminals

Australia Vapor Recovery Units Market By End-Use

Oil & Gas

Landfill

Chemicals & Petrochemicals

Pharmaceuticals

Rest of Asia-Pacific Outlook (USD Billion, 2018-2032)

Rest of Asia-Pacific Vapor Recovery Units Market By Horsepower

Up to 50 HP

51-200 HP

201-500 HP

501-1000 HP

Above 1000 HP

Rest of Asia-Pacific Vapor Recovery Units Market By Application

Oil Tank Vapors

Marine Loading Terminals

Barge Degassing

Truck Loading

Vapor Particulate Filter

Railcar Loading

Storage Terminals

Rest of Asia-Pacific Vapor Recovery Units Market By End-Use

Oil & Gas

Landfill

Chemicals & Petrochemicals

Pharmaceuticals

Rest of the World Outlook (USD Billion, 2018-2032)

Rest of the World Vapor Recovery Units Market By Horsepower

Up to 50 HP

51-200 HP

201-500 HP

501-1000 HP

Above 1000 HP

Rest of the World Vapor Recovery Units Market By Application

Oil Tank Vapors

Marine Loading Terminals

Barge Degassing

Truck Loading

Vapor Particulate Filter

Railcar Loading

Storage Terminals

Rest of the World Vapor Recovery Units Market By End-Use

Oil & Gas

Landfill

Chemicals & Petrochemicals

Pharmaceuticals

Middle East Outlook (USD Billion, 2018-2032)

Middle East Vapor Recovery Units Market By Horsepower

Up to 50 HP

51-200 HP

201-500 HP

501-1000 HP

Above 1000 HP

Middle East Vapor Recovery Units Market By Application

Oil Tank Vapors

Marine Loading Terminals

Barge Degassing

Truck Loading

Vapor Particulate Filter

Railcar Loading

Storage Terminals

Middle East Vapor Recovery Units Market By End-Use

Oil & Gas

Landfill

Chemicals & Petrochemicals

Pharmaceuticals

Africa Outlook (USD Billion, 2018-2032)

Africa Vapor Recovery Units Market By Horsepower

Up to 50 HP

51-200 HP

201-500 HP

501-1000 HP

Above 1000 HP

Africa Vapor Recovery Units Market By Application

Oil Tank Vapors

Marine Loading Terminals

Barge Degassing

Truck Loading

Vapor Particulate Filter

Railcar Loading

Storage Terminals

Africa Vapor Recovery Units Market By End-Use

Oil & Gas

Landfill

Chemicals & Petrochemicals

Pharmaceuticals

Latin America Outlook (USD Billion, 2018-2032)

Latin America Vapor Recovery Units Market By Horsepower

Up to 50 HP

51-200 HP

201-500 HP

501-1000 HP

Above 1000 HP

Latin America Vapor Recovery Units Market By Application

Oil Tank Vapors

Marine Loading Terminals

Barge Degassing

Truck Loading

Vapor Particulate Filter

Railcar Loading

Storage Terminals

Latin America Vapor Recovery Units Market By End-Use

Oil & Gas

Landfill

Chemicals & Petrochemicals

Pharmaceuticals

Infographic

Free Sample Request

Kindly complete the form below to receive a free sample of this Report

Get Free Sample

Customer Strories

“I am very pleased with how market segments have been defined in a relevant way for my purposes (such as "Portable Freezers & refrigerators" and "last-mile"). In general the report is well structured. Thanks very much for your efforts.”

Victoria Milne

Founder

Compare Licence

×
Features License Type
Single User Multiuser License Enterprise User
Price $4,950 $5,950 $7,250
Maximum User Access Limit 1 User Upto 10 Users Unrestricted Access Throughout the Organization
Free Customization
Direct Access to Analyst
Deliverable Format
Platform Access
Discount on Next Purchase 10% 15% 15%
Printable Versions