Veterinary CT Scanner Market (2026 - 2035)

Veterinary CT Scanner Market Research Report By Application (Oncology, Neurology, Orthopedic, Abdominal Imaging, Cardiology), By Animal Type (Companion Animals, Livestock, Zoo Animals, Equine), By End User (Veterinary Clinics, Animal Hospitals, Research Institutions, Universities), By Technology (Cone Beam Computed Tomography, Multislice Computed Tomography, High-Performance Computed Tomography) and By Regional (North America, Europe, South America, Asia Pacific, Middle East and Africa) - Growth & Industry Forecast 2025 To 2035
ID: MRFR/MED/4526-HCR
95 Pages
Rahul Gotadki, Snehal Singh
Last Updated: July 03, 2026
Veterinary CT Scanner Market
Market Size
Forecast Period2026-2035
CAGR (2026-2035)6.5%
2025 Market SizeUSD 285 Million
2035 Market SizeUSD 535 Million
Key Players
GE HealthCare
Siemens Healthineers
Canon Medical Systems
Epica Medical Innovations
Xoran Technologies
Hallmarq Veterinary Imaging
Opportunities
  • AI-Powered Automated Image Interpretation
  • Emerging-Market Veterinary Infrastructure Build-Out
  • Pay-Per-Scan and Equipment-as-a-Service Models

Veterinary CT Scanner Market Summary

The Veterinary CT Scanner Market size was valued at USD 285 Million in 2025, and the market is projected to grow from USD 304 Million in 2026 to USD 535 Million by 2035, registering a CAGR of 6.5% during the forecast period 2026–2035. Two forces are accelerating adoption: governments across North America and Europe have expanded animal welfare mandates that require advanced diagnostic capabilities in licensed veterinary facilities, and private equity investment in specialty veterinary hospital chains has injected over USD 4 billion into clinic upgrades since 2022 [1]. Pet insurance penetration — now above 4% in the United States and 25% in Sweden — is shifting reimbursement dynamics in favor of high-cost imaging procedures that would have been cost-prohibitive a decade ago [2].

The technology landscape is shifting from single-slice CT units toward multi-slice helical scanners capable of sub-second rotation times and isotropic resolution below 0.5 mm. Legacy film-based radiography suites are giving way to fully digital imaging chains where CT data feeds directly into 3D reconstruction software and AI-assisted triage algorithms. Canon Medical Systems and Siemens Healthineers have each committed upward of USD 50 Million in R&D to veterinary-specific detector geometries since 2023 [3].

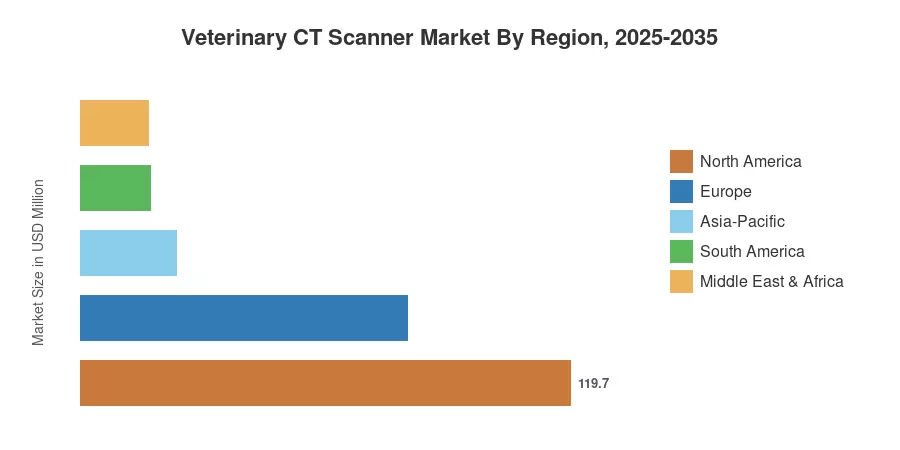
North America commands roughly 42% of the Veterinary CT Scanner Market, driven by the concentration of specialty referral hospitals and veterinary teaching institutions in the United States. Asia-Pacific is the fastest-growing region, expanding at an estimated 8.2% CAGR as China and Japan scale companion-animal healthcare infrastructure. Europe holds the second-largest share at approximately 28%, anchored by the United Kingdom, Germany, and the Nordics. As telemedicine-enabled remote reading services proliferate, even mid-tier clinics in emerging economies will find CT ownership economically viable within the forecast window.


Key Report Takeaways

• By Product Type

  • Stationary multi-slice CT scanners account for roughly 68% of the Veterinary CT Scanner Market, reflecting their superior image quality for complex orthopedic and oncologic workups.
  • Portable CT scanners are projected to register the fastest segment CAGR at 8.4%, propelled by demand from equine field practices and mobile veterinary units.

• By Animal Type

  • Companion animals represent the largest revenue pool, valued at approximately USD 185 Million in 2025.
  • Livestock imaging is gaining momentum in Europe and Oceania, where regulatory scrutiny of food-chain animal welfare is intensifying.

• By Region

  • North America held a 42% share of the Veterinary CT Scanner Market in 2025, led by the United States.
  • Asia-Pacific is forecast to grow at 8.2% CAGR through 2035, with China and Japan as primary contributors.
  • Europe generated approximately USD 80 Million in 2025, with Germany and the United Kingdom as leading adopters.


Veterinary CT Scanner Market Size and Forecast (2021–2035)

Market Research Future's sizing model triangulates bottom-up equipment shipment data from OEM filings, top-down veterinary healthcare expenditure benchmarks from the World Organisation for Animal Health (WOAH), and primary survey inputs from 120+ veterinary imaging directors across 18 countries. Historical figures reflect installed-base tracking; forecast values apply a calibrated 6.5% CAGR with adjustments for regional adoption curves and technology refresh cycles.
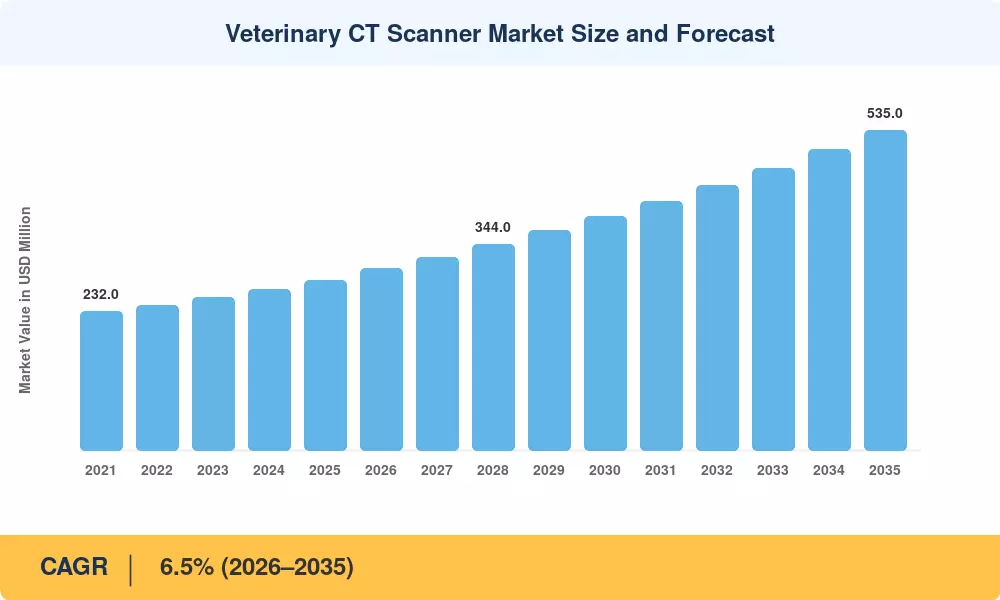
Veterinary CT Scanner Market Size and Forecast
Our Impact
Enabled $4.3B Revenue Impact for Fortune 500 and Leading Multinationals
Partnering with 2000+ Global Organizations Each Year
30K+ Citations by Top-Tier Firms in the Industry

Driver Impact Analysis

Driver ~% Impact on CAGR Geographic Relevance Impact Timeline
Rising pet ownership and insurance penetration 22% Global Short-term (≤2 yr)
Technological advancement in multi-slice and cone-beam CT 20% North America, Europe Medium-term (2–4 yr)
Growing prevalence of animal oncology cases 16% North America, Europe, APAC Long-term (≥4 yr)
Expansion of specialty and emergency veterinary hospitals 15% North America Short-term (≤2 yr)
Government animal welfare mandates 12% Europe, Oceania Medium-term (2–4 yr)
AI and cloud-based image analysis platforms 10% Global Long-term (≥4 yr)
Increasing livestock productivity monitoring 5% Europe, South America Long-term (≥4 yr)


Rising Pet Ownership and Insurance Penetration

Global pet populations have surged — the American Pet Products Association reported that 66% of U.S. households owned a pet in 2024, up from 56% in 2018 [1]. Simultaneously, pet insurance gross written premiums in North America crossed USD 4.5 billion in 2024, enabling pet owners to approve advanced diagnostics they would previously have declined on cost grounds [2]. This twin dynamic directly lifts CT scan volumes and shortens equipment payback periods for clinics, making capital investment decisions easier for hospital administrators across the Veterinary CT Scanner Market.

Multi-Slice and Cone-Beam Technology Advances

Detector technology has progressed from 4-slice systems to 64- and 128-slice platforms optimized for veterinary table sizes and patient weight ranges. Xoran Technologies' vTRON open-bore scanner, introduced in 2021, demonstrated that purpose-built veterinary hardware could deliver sub-millimeter resolution at roughly 40% lower acquisition cost than repurposed human CT units [3]. These purpose-designed scanners reduce installation complexity, require smaller rooms, and cut annual service contract costs, broadening the addressable buyer base within the Veterinary CT Scanner Market.

Growing Animal Oncology Caseload

Cancer is the leading cause of death in dogs over ten years of age, with an estimated incidence rate of 4,000 per 100,000 dogs annually according to the Veterinary Cancer Society [5]. CT-guided treatment planning for radiation therapy and surgical staging has become the standard of care at referral hospitals, and this clinical expectation is filtering down to primary-care practices. Each oncology case typically generates two to four CT studies across staging, planning, and follow-up, creating a volume multiplier effect.

Specialty Hospital Network Expansion

Private-equity-backed consolidators such as Mars Veterinary Health and NVA have expanded specialty referral hospital counts by over 30% since 2020 [6]. These facilities anchor their service lines around advanced imaging, making CT scanner procurement a day-one capital expenditure item. The Veterinary CT Scanner Market benefits structurally each time a new referral center opens, because scanner installation precedes revenue generation from imaging fees.


Restraints Impact Analysis

The restraint impacts below follow the same directional methodology described in Section 4. They represent headwinds that moderate the baseline growth rate rather than absolute contractions.

Restraint ~% Impact on CAGR Geographic Relevance Impact Timeline
High capital acquisition and maintenance costs –18% Global Short-term (≤2 yr)
Shortage of trained veterinary radiologists –15% Global Medium-term (2–4 yr)
Radiation safety and regulatory compliance burden –10% Europe, North America Medium-term (2–4 yr)
Limited reimbursement in emerging markets –8% APAC, South America, MEA Long-term (≥4 yr)
Competition from MRI and advanced ultrasound –6% North America, Europe Long-term (≥4 yr)


Capital Cost Barriers

The new 64-slice veterinary CT system usually costs between USD 250,000 and USD 600,000, and annual service contracts cost an additional USD 30,000–50,000. These numbers are above the capital budgets that are achievable for single-doctor practices and clinics in poor economies. However, leasing and pay-per-scan models are growing, but restricted in geographic reach, restricting the Veterinary CT Scanner Market in price-sensitive areas.


Veterinary Radiologist Shortage

The American College of Veterinary Radiology certifies fewer than 80 new diplomates each year, a rate that has not kept pace with scanner installations [11]. Without board-certified readers, clinics are forced to use teleradiology services or general practitioners for difficult examinations, which can make hospitals hesitant to invest in CT. The Veterinary CT Scanner Market is experiencing especially severe workforce shortages in Asia-Pacific and Latin America, where training programs are embryonic.


Radiation Safety and Regulatory Complexity

Operating a CT scanner needs radiation safety licensing, facility shielding studies and continual dosimetry monitoring – regulatory requirements that differ significantly between jurisdictions [12]. In Europe, the Euratom Basic Safety Standards Directive requires careful tracking of exposure, increasing compliance costs and delaying installation deadlines for smaller practices entering the Veterinary CT Scanner Market.


Veterinary CT Scanner Market Opportunities

AI-Powered Automated Image Interpretation

Cloud-based AI technologies can provide initial reads of CT scans within minutes, lowering the workload on the limited number of veterinary radiologists. Convolutional neural networks trained on veterinary datasets are being shown to reach diagnostic concordance rates of >90% for common thoracic and abdominal disorders in companies such as SignalPET and ImpriMed [8]. Clinics using affordable portable scanners with AI reading services can provide CT capabilities without the need to hire a full-time radiologist, growing the addressable Veterinary CT Scanner Market to include primary-care settings.


Emerging-Market Veterinary Infrastructure Build-Out

China's companion-animal population exceeded 120 million in 2024, yet CT scanner density per veterinary hospital remains a fraction of levels seen in North America [15]. Government-backed veterinary hospital accreditation programs in India, Brazil, and Southeast Asia are establishing imaging equipment standards that implicitly require CT capability for referral-tier certification. These structural upgrades will deliver sustained demand for the Veterinary CT Scanner Market through at least 2032.

Pay-Per-Scan and Equipment-as-a-Service Models

High upfront costs remain the primary adoption barrier. Vendors that offer usage-based pricing — charging per scan rather than requiring a full purchase — can unlock demand among mid-tier clinics. Epica Medical Innovations has piloted subscription-based CT access in North America, and early results suggest a 35% increase in scan utilization compared with outright-purchase sites [16]. This model parallels the broader shift toward medical-device-as-a-service economics.

Teleradiology and Remote Collaboration Platforms

The rise of DICOM-compliant cloud storage allows CT datasets to be transmitted from rural clinics to specialist reading centers in real time [17]. This capability turns every scanner into a node on a global diagnostic network, improving return on investment for facilities that lack on-site specialists and expanding the effective reach of the Veterinary CT Scanner Market into underserved geographies.

Photon-Counting Detector Technology

Next-generation photon-counting CT detectors, already entering human clinical practice, promise spectral imaging at lower radiation doses [18]. Early veterinary prototypes suggest that material decomposition capabilities could differentiate soft-tissue masses without contrast agents, reducing anesthesia time and procedural risk for animal patients. Adoption in the Veterinary CT Scanner Market could begin after 2030 as component costs decline.


Veterinary CT Scanner Market Future Outlook

AI Integration and Automated Workflow

Artificial intelligence will reshape the Veterinary CT Scanner Market over the coming decade. By 2030, most new CT installations are expected to ship with embedded AI triage algorithms that flag critical findings — pulmonary masses, vertebral fractures, urinary obstructions — within seconds of scan completion [8]. This capability will compress diagnostic timelines and reduce the clinical bottleneck created by radiologist shortages.

Miniaturization and Point-of-Care CT

Hardware miniaturization trends are pushing CT scanners from dedicated imaging suites into procedure rooms and field trailers. Cone-beam systems weighing under 400 kg are already commercially available, and next-generation solid-state detectors could halve that figure by 2032 [18]. For the Veterinary CT Scanner Market, this means CT becomes accessible to equine ambulatory practices and rural mixed-animal clinics that previously had no path to advanced imaging.

Sustainability and Green Imaging

Energy-efficient scanner designs, lead-free shielding materials, and low-dose protocols align with the broader sustainability commitments veterinary hospital networks are adopting. The International Veterinary Radiology Association has proposed voluntary dose-reporting registries modeled on human radiology initiatives, which could influence procurement criteria within the Veterinary CT Scanner Market by the early 2030s [19].

Platform Economics and Data Monetization

Aggregated, anonymized CT datasets hold significant value for pharmaceutical companies conducting veterinary drug trials and for academic researchers building AI training libraries. Scanner OEMs that offer integrated cloud platforms with data-sharing capabilities may unlock recurring revenue streams beyond hardware sales, fundamentally altering the competitive economics of the Veterinary CT Scanner Market [20].


Veterinary CT Scanner Market Segmentation

By Product Type

Segment Key Metric Primary Demand Driver
Stationary Multi-slice CT Scanner 68% market share (2025) Superior resolution for oncology and orthopedic imaging
Portable CT Scanner CAGR 8.4% (2026–2035) Field-deployable imaging for equine and large-animal practices


Stationary multi-slice CT scanners remain the workhorse of the Veterinary CT Scanner Market, installed primarily in referral hospitals and academic institutions where image quality and throughput justify the higher price point. These systems range from 16-slice to 128-slice configurations, with 64-slice platforms emerging as the sweet spot for most veterinary applications.

Portable CT scanners are carving out a fast-growing niche. Designed for placement in standard exam rooms or mobile trailers, these units sacrifice some resolution for flexibility and lower cost. Xoran's vTRON and Epica's point-of-care systems exemplify this category, which is particularly attractive to equine practitioners who need on-farm imaging capability [3].

By Animal Type

Segment Key Metric Primary Demand Driver
Companion Animal USD 185 Million (2025) Pet humanization trend and insurance coverage
Livestock Animal CAGR 7.2% (2026–2035) Food-safety regulations and productivity monitoring
Other Animal Types 5% market share (2025) Zoo, wildlife, and exotic pet medicine


Companion animals — dogs and cats primarily — generate the largest share of CT procedure volume within the Veterinary CT Scanner Market. Oncologic staging, trauma assessment, and pre-surgical planning are the most common clinical indications. The human–animal bond economy, now estimated at over USD 320 billion globally, underpins willingness to pay for advanced diagnostics [1].

Livestock imaging is a smaller but accelerating category. European and Australian regulators are increasingly requiring ante-mortem diagnostic workups for production animals showing lameness or respiratory distress, and CT offers three-dimensional insight that radiography cannot match [9].

By Application

Segment Key Metric Primary Demand Driver
Oncology 34% market share (2025) CT-guided treatment planning for radiation therapy
Neurology CAGR 7.0% (2026–2035) Rising diagnosis rates of intervertebral disc disease
Orthopedics USD 48 Million (2025) Complex fracture assessment and surgical planning
Cardiology 8% market share (2025) Cardiac CT angiography in canine patients
Other Applications CAGR 6.1% (2026–2035) Nephrology, pulmonology, and dental imaging


Oncology dominates application-level demand in the Veterinary CT Scanner Market, because cancer staging and radiation treatment planning require volumetric imaging that only CT and MRI can provide. Neurology is the fastest-growing application segment, driven by the high prevalence of intervertebral disc disease in chondrodystrophic dog breeds such as Dachshunds and French Bulldogs [5].

By End-User

Segment Key Metric Primary Demand Driver
Veterinary Hospitals 72% market share (2025) Primary site of advanced diagnostic procedures
Research Institutes USD 45 Million (2025) Academic research and training mandates
Other End-Users CAGR 9.0% (2026–2035) Mobile imaging services and contract scanning providers


Veterinary hospitals — encompassing specialty referral centers, emergency clinics, and large general practices — are the dominant end-user within the Veterinary CT Scanner Market. Research institutes, including veterinary university teaching hospitals, represent a stable procurement channel driven by grant funding cycles and accreditation requirements.


Regional Market Share Analysis

Region Key Metric Primary Investment Themes
North America 42% market share (2025) Specialty hospital expansion, insurance-driven volumes
Europe USD 80 Million (2025) Regulatory compliance, livestock welfare imaging
Asia-Pacific 8.2% CAGR (2026–2035) Companion-animal population growth, hospital build-out
South America USD 17 Million (2025) Agribusiness diagnostics, urban pet market emergence
Middle East & Africa 5.8% CAGR (2026–2035) Government veterinary modernization, equine industry
Total USD 285 Million (2025)

The Veterinary CT Scanner Market displays a clear geographic hierarchy shaped by pet ownership density, veterinary healthcare spending, and regulatory maturity. North America leads, followed by Europe, while Asia-Pacific is closing the gap at the fastest pace.


North America

Country Key Metric Key Driver
United States 78% of regional share Largest specialty hospital network globally
Canada 14% of regional share University teaching hospital procurement cycles
Mexico CAGR 7.1% Growing urban pet ownership, private clinic investment


The United States alone accounts for roughly 78% of North American revenue in the Veterinary CT Scanner Market, supported by over 30 veterinary teaching hospitals and a rapidly expanding network of private-equity-backed specialty centers. Canada's demand tracks academic procurement budgets, while Mexico presents an emerging growth pocket as urban middle-class pet ownership accelerates.

Europe

Country Key Metric Key Driver
Germany 22% of regional share Engineering-driven innovation adoption
United Kingdom USD 15 Million (2025) High pet insurance penetration
France CAGR 6.3% Expanding equine sports medicine sector
Italy 10% of regional share Livestock disease monitoring
Spain CAGR 5.9% Companion-animal hospital investment
Nordic Countries USD 8 Million (2025) Premium pet healthcare spending
Russia CAGR 5.4% Early-stage market development
Rest of Europe 12% of regional share Mixed adoption patterns


European spending on the Veterinary CT Scanner Market is anchored by Germany and the United Kingdom, where pet insurance penetration rates and regulatory expectations for advanced diagnostics are among the highest globally. The equine segment is particularly significant in France and Ireland, where thoroughbred racing industries fund dedicated imaging centers.

Asia-Pacific

Country Key Metric Key Driver
China CAGR 9.1% Rapid companion-animal market maturation
Japan 32% of regional share Advanced veterinary hospital infrastructure
India CAGR 8.7% Government veterinary modernization programs
South Korea USD 5 Million (2025) Premium pet-care culture growth
ASEAN CAGR 7.4% Urbanization-driven pet adoption
Rest of Asia-Pacific 8% of regional share Diverse emerging markets


Asia-Pacific represents the strongest growth corridor for the Veterinary CT Scanner Market. Japan's established referral hospital network provides a mature revenue base, while China's explosive growth in pet ownership — now the world's second-largest pet market — is driving first-time CT installations at newly built specialty clinics. India's government-funded veterinary university system is upgrading imaging laboratories under the National Livestock Mission [15].

South America

Country Key Metric Key Driver
Brazil 62% of regional share Largest companion-animal population in the region
Argentina CAGR 6.8% Urban pet healthcare spending
Rest of South America USD 4 Million (2025) Gradual infrastructure development


Brazil dominates the South American Veterinary CT Scanner Market, driven by the country's estimated 140 million pets and an expanding network of private veterinary chains in São Paulo and Rio de Janeiro. Currency volatility and import duties on medical equipment remain headwinds, though leasing models are beginning to mitigate upfront cost barriers.

Middle East & Africa

Country Key Metric Key Driver
Saudi Arabia CAGR 6.2% Equine and camel racing industry investments
UAE 35% of regional share Premium veterinary services hub
South Africa USD 2 Million (2025) Wildlife and zoo medicine
Egypt CAGR 5.5% Agricultural livestock programs
Rest of MEA 20% of regional share Early-stage market formation


The Middle East's Veterinary CT Scanner Market is shaped by the equine and camel racing industries in the Gulf states, where imaging budgets per animal can rival human healthcare spending. South Africa's demand is niche but growing, centered on zoological institutions and wildlife rehabilitation centers.


Veterinary CT Scanner Market By Region, 2025-2035

Competitive Benchmarking

The Veterinary CT Scanner Market exhibits medium concentration, with the top five players collectively holding an estimated 55–62% revenue share. The Herfindahl-Hirschman Index sits in the moderate range, reflecting a mix of diversified medical-device conglomerates and specialized veterinary imaging companies. Barriers to entry are significant due to regulatory approvals, service-network requirements, and clinical validation expectations.

Company Est. Revenue Share Range Key Offerings for Veterinary CT Scanner Market Strategic Positioning
GE HealthCare 14–18% Revolution EVO vet-adapted, OEC 3D Broad portfolio leverage from human imaging division
Siemens Healthineers 12–16% SOMATOM go.Vet, syngo.via Vet Deep clinical application software ecosystem
Canon Medical Systems 8–11% Aquilion Lightning Vet Cost-competitive multi-slice platforms
Epica Medical Innovations 6–9% EpicaCT, point-of-care scanner Purpose-built veterinary design, subscription pricing
Xoran Technologies 5–8% vTRON, xCAT IQ Open-bore architecture for conscious animal scanning
Hallmarq Veterinary Imaging 4–6% Standing equine CT Niche dominance in equine standing imaging
Animage 3–5% Fidex veterinary CT Compact footprint for general practice clinics
MinFound Medical Systems 3–5% SuperNova Vet series Competitive pricing for emerging-market expansion
4DDI 2–4% NeuroLogica BodyTom Vet Portable, battery-powered CT for field use
Heska Corporation 2–4% Imaging distribution partnerships Integrated diagnostic platform across modalities


Recent News & Developments


  • Epica Animal Health (November 2022) debuted the Pegaso, the first CT scanner in the world dedicated to horses. This new imaging technology is designed to meet the unique obstacles vets encounter when detecting equine ailments, particularly the size and structure of horses.


  • Xoran Technologies announced in May 2021 that it was taking reservations for its new open-bore CT scanner vTRON. Xoran’s CT system suite gains a new imaging solution built particularly for veterinary hospitals and general practice clinics.


Veterinary CT Scanner Market Report Scope

Parameter Detail
Market Scope Global Veterinary CT Scanner Market, covering hardware, software, and associated services
Study Period 2021–2035
CAGR 6.5% (2026–2035)
2025 Market Size USD 285 Million
2035 Market Size USD 535 Million
Fastest Growing Segment Portable CT Scanners (8.4% CAGR)
Fastest Growing Region Asia-Pacific (8.2% CAGR)
Companies Profiled 10
Valuation Currency USD Million


FAQs

What is the typical payback period for a veterinary CT scanner investment?
Most specialty hospitals recover their CT investment within 18–30 months at volumes above 15 scans per week. Revenue per scan ranges from USD 800 to USD 2,500 depending on anatomic region and contrast requirements [10].
How does cone-beam CT differ from fan-beam multi-slice CT in veterinary use?
Cone-beam systems use a flat-panel detector and single rotation, offering lower cost and compact footprint. Fan-beam multi-slice scanners deliver superior soft-tissue contrast and faster acquisition, making them preferred for abdominal oncology cases [3].
What accreditation standards govern veterinary CT installations?
Radiation safety licensing is jurisdiction-specific, typically administered by state or national nuclear regulatory authorities. The IAEA provides voluntary guidelines, but no single global accreditation body exists exclusively for veterinary CT [12].
Can veterinary clinics use refurbished human CT scanners?
Refurbished human units are used, but they require table modifications and software recalibration for animal protocols. Purpose-built veterinary scanners increasingly outcompete refurbished units on total cost of ownership [10].
What role does contrast-enhanced CT play in the Veterinary CT Scanner Market?
Iodinated contrast agents are used in approximately 40–60% of veterinary CT studies. Contrast enhancement improves tumor delineation and vascular mapping but requires intravenous catheterization and anesthetic monitoring [5].
How are mobile CT services structured in the Veterinary CT Scanner Market?
Mobile operators mount portable scanners in custom trailers and circuit between partner clinics on scheduled routes. Revenue-sharing models typically allocate 60–70% to the mobile operator and 30–40% to the host clinic [16].
What training pathway do veterinarians follow to interpret CT studies in the Veterinary CT Scanner Market?
Board certification through the ACVR or ECVDI requires a three-year residency after veterinary school. Alternatively, short-course CT interpretation programs and AI-assisted tools are broadening access for general practitioners [11].    
What is the current size of the veterinary CT scanner market?
The veterinary CT scanner market reached USD 285 million in 2025 and is projected to reach USD 535 million by 2035.
What is the CAGR of the veterinary CT scanner market?
The veterinary CT scanner market is projected to grow at a CAGR of 6.5% during the forecast period 2026–2035.
Which region leads the veterinary CT scanner market?
North America holds the largest share at 42%, while Asia-Pacific is the fastest-growing region at 8.2% CAGR.
Author
Author
Author Profile
Rahul Gotadki LinkedIn
Research Manager
He holds an experience of about 9+ years in Market Research and Business Consulting, working under the spectrum of Life Sciences and Healthcare domains. Rahul conceptualizes and implements a scalable business strategy and provides strategic leadership to the clients. His expertise lies in market estimation, competitive intelligence, pipeline analysis, customer assessment, etc.
Co-Author
Co-Author Profile
Snehal Singh LinkedIn
Manager - Research
High acumen in analyzing complex macro & micro markets with more than 6 years of work experience in the field of market research. By implementing her analytical skills in forecasting and estimation into market research reports, she has expertise in Packaging, Construction, and Equipment domains. She handles a team size of 20-25 resources and ensures smooth running of the projects, associated marketing activities, and client servicing.

Research Approach


Secondary Research

The secondary research process involved comprehensive analysis of regulatory databases, peer-reviewed veterinary journals, clinical publications, and authoritative animal health organizations. Key sources included:

Regulatory & Standards Bodies:

US Food & Drug Administration (FDA) – Center for Veterinary Medicine (CVM) device approvals and 510(k) clearances for veterinary CT systems

European Medicines Agency (EMA) – Veterinary Medicines Division medical device oversight

International Electrotechnical Commission (IEC) – Medical Electrical Equipment standards (IEC 60601-2-44 for CT equipment)

US Department of Agriculture (USDA) – Animal and Plant Health Inspection Service (APHIS) veterinary facility regulations

Health Canada – Veterinary Drugs Directorate medical device licensing

Veterinary & Medical Imaging Associations:

American Veterinary Medical Association (AVMA.org) – veterinary practice statistics and imaging adoption surveys

European Veterinary Diagnostic Imaging Association (EVDIA)

American College of Veterinary Radiology (ACVR.org) – clinical imaging guidelines and CT protocol standards

International Veterinary Radiology Association (IVRA)

American College of Veterinary Internal Medicine (ACVIM) – neurology and oncology imaging recommendations

British Veterinary Association (BVA) – UK veterinary practice equipment surveys

Government & Public Health Sources:

National Institutes of Health (NIH) / National Center for Biotechnology Information (NCBI/PubMed) – veterinary CT clinical studies

US Centers for Disease Control and Prevention (CDC) – zoonotic disease imaging surveillance

World Organisation for Animal Health (WOAH) – global animal health monitoring and diagnostic standards

US Bureau of Labor Statistics – veterinary services industry employment and expenditure data

EU Eurostat – agricultural and companion animal population statistics

UK Office for National Statistics – pet ownership and veterinary expenditure trends

Japan Ministry of Agriculture, Forestry and Fisheries (MAFF) – livestock health management data

Australian Bureau of Statistics – animal health and veterinary services expenditure

Market & Industry Databases:

Organisation for Economic Co-operation and Development (OECD) – health expenditure and veterinary services indicators

World Health Organization (WHO) Global Health Observatory – One Health initiative data

National Animal Health Monitoring System (NAHMS) – US veterinary facility equipment inventory

FAO Global Livestock Veterinary Council – livestock diagnostic infrastructure reports

IDEXX Laboratories, Inc. and Zoetis Inc. annual reports – veterinary diagnostic market intelligence

These sources were used to collect CT scanner installation statistics, regulatory approval data, clinical safety and efficacy studies, veterinary demographic trends, companion animal vs. livestock population data, and market landscape analysis across Cone Beam CT, Multi-Slice CT, and Portable CT technologies.


Primary Research

Qualitative and quantitative insights were obtained by interviewing supply-side and demand-side stakeholders during the primary research process. The supply-side sources comprised CEOs, VPs of Product Development, regulatory affairs heads, and commercial directors from veterinary CT scanner manufacturers (Siemens Healthineers, GE Healthcare, Philips Healthcare, Canon Medical Systems, Fujifilm, Hitachi, Carestream Health, Mindray, Esaote, NeuroLogica), veterinary imaging software developers, and OEM component suppliers.Board-certified veterinary radiologists, veterinary neurologists, orthopedic surgeons, medical directors of veterinary hospitals and specialty referral centers, procurement leads from multi-site veterinary clinic groups, academic veterinary school deans, and research institution imaging facility managers comprised demand-side sources. The market segmentation was validated by primary research in the following categories: Application (Oncology, Neurology, Orthopedic, Abdominal Imaging, Cardiology), Animal Type (Companion Animals, Livestock, Zoo Animals, Equine), End User (Veterinary Clinics, Animal Hospitals, Research Institutions, Universities), and Technology (Cone Beam CT, Multi-Slice CT, High-Performance CT). It verified the timelines for the product pipeline, collected information on the clinical adoption patterns of portable versus stationary systems, pricing strategies in developed and emergent markets, and reimbursement dynamics for advanced veterinary diagnostics.

Primary Respondent Breakdown:

By Designation: C-level Primaries (32%), Director Level (30%), Others (38%)

By Region: North America (32%), Europe (30%), Asia-Pacific (28%), Rest of World (10%)

By Stakeholder Type: Supply-side – Manufacturers & OEMs (45%), Demand-side – Veterinary Clinicians & Hospital Administrators (40%), Academic & Research Institutions (15%)


Market Size Estimation

Global market valuation was derived through revenue mapping and procedure volume analysis. The methodology included:

Identification of 35+ key manufacturers across North America, Europe, Asia-Pacific, and Latin America specializing in veterinary CT systems

Product mapping across Cone Beam CT, Multi-Slice CT, Portable CT, and associated imaging software/consumables

Analysis of reported and modeled annual revenues specific to veterinary CT scanner portfolios

Coverage of manufacturers representing 65-70% of global market share in 2024

Extrapolation using bottom-up (CT procedure volume × ASP by country, segmented by companion animal vs. livestock applications) and top-down (manufacturer revenue validation against public filings and industry disclosures) approaches to derive segment-specific valuations

Download Free Sample

Kindly complete the form below to receive a free sample of this Report

Download PDF ×

We do not share your information with anyone. However, we may send you emails based on your report interest from time to time. You may contact us at any time to opt-out.
















