Video Game Market

ID: MRFR/ICT/9113-HCR
200 Pages
Aarti Dhapte
Last Updated: June 17, 2026
Video Game Market Size, Share and Research Report By Device Type (Mobile, Console, Computer, Cloud-Gaming Devices), By Genre (Action, Shooter, Role-Playing, Sports, Adventure), By Revenue Model (Free-To-Play, Pay-To-Play (Premium), Subscription-Based, In-Game Advertising), By End-User (Casual Gamers, Hardcore / Competitive Gamers, Professional Esports Athletes) and By Region (North America, Europe, South America, Asia Pacific, Middle East and Africa) - Industry Forecast to 2035.
Download PDF ×

We do not share your information with anyone. However, we may send you emails based on your report interest from time to time. You may contact us at any time to opt-out.

  1. 1 Market Overview |
    1. 1.1 Study Assumptions & Market Definition |
    2. 1.2 Scope of the Study |
    3. 1.3 Research Methodology
  2. 2 Market Summary & Key Takeaways
  3. 3 Market Dynamics |
    1. 3.1 Market Drivers Analysis | |
      1. 3.1.1 5G & Broadband Infrastructure Expansion | |
      2. 3.1.2 Subscription & Cloud-Gaming Uptake | |
      3. 3.1.3 Generative-AI Content Tooling | |
      4. 3.1.4 Esports Commercialization & Media Rights | |
      5. 3.1.5 Smartphone Penetration in Emerging Markets | |
      6. 3.1.6 Cross-Platform Play Standardization | |
      7. 3.1.7 Government Digital Entertainment Incentives |
    2. 3.2 Market Restraints Analysis | |
      1. 3.2.1 Mobile Platform Fee Disputes & Regulation | |
      2. 3.2.2 Rising Customer-Acquisition Costs | |
      3. 3.2.3 Regulatory Crackdowns on Loot Boxes / Minors' Playtime | |
      4. 3.2.4 Talent Wage Inflation & Studio Layoffs | |
      5. 3.2.5 Data Privacy & Age-Verification Mandates |
    3. 3.3 Market Opportunity Analysis | |
      1. 3.3.1 Emerging-Market Mobile-First Expansion | |
      2. 3.3.2 In-Game Advertising & Data Monetization | |
      3. 3.3.3 Cloud-Gaming as a Distribution Equalizer | |
      4. 3.3.4 Esports & Virtual Events as Revenue Platforms | |
      5. 3.3.5 AR/VR & Spatial Computing Integration |
    4. 3.4 Industry Value Chain Analysis |
    5. 3.5 Porter's Five Forces Analysis
  4. 4 Global Video Game Market Size & Forecast (2021–2035) |
    1. 4.1 Historical Market Size (2021–2025) |
    2. 4.2 Current & Forecast Market Size (2026–2035) |
    3. 4.3 Market Size by Revenue (USD Billion) |
    4. 4.4 Year-over-Year Growth Analysis
  5. 5 Segmentation Analysis |
    1. 5.1 By Device Type | |
      1. 5.1.1 Mobile | |
      2. 5.1.2 Console | |
      3. 5.1.3 Computer | |
      4. 5.1.4 Cloud-Gaming Devices |
    2. 5.2 By Genre | |
      1. 5.2.1 Action | |
      2. 5.2.2 Shooter | |
      3. 5.2.3 Role-Playing | |
      4. 5.2.4 Sports | |
      5. 5.2.5 Adventure |
    3. 5.3 By Revenue Model | |
      1. 5.3.1 Free-To-Play | |
      2. 5.3.2 Pay-To-Play (Premium) | |
      3. 5.3.3 Subscription-Based | |
      4. 5.3.4 In-Game Advertising |
    4. 5.4 By End-User | |
      1. 5.4.1 Casual Gamers | |
      2. 5.4.2 Hardcore / Competitive Gamers | |
      3. 5.4.3 Professional Esports Athletes
  6. 6 Regional Analysis |
    1. 6.1 North America | |
      1. 6.1.1 United States | |
      2. 6.1.2 Canada | |
      3. 6.1.3 Mexico |
    2. 6.2 Europe | |
      1. 6.2.1 Germany | |
      2. 6.2.2 United Kingdom | |
      3. 6.2.3 France | |
      4. 6.2.4 Italy | |
      5. 6.2.5 Spain | |
      6. 6.2.6 Nordic Countries | |
      7. 6.2.7 Russia | |
      8. 6.2.8 Rest of Europe |
    3. 6.3 Asia-Pacific | |
      1. 6.3.1 China | |
      2. 6.3.2 India | |
      3. 6.3.3 Japan | |
      4. 6.3.4 South Korea | |
      5. 6.3.5 ASEAN | |
      6. 6.3.6 Rest of Asia-Pacific |
    4. 6.4 South America | |
      1. 6.4.1 Brazil | |
      2. 6.4.2 Argentina | |
      3. 6.4.3 Rest of South America |
    5. 6.5 Middle East & Africa | |
      1. 6.5.1 Saudi Arabia | |
      2. 6.5.2 UAE | |
      3. 6.5.3 South Africa | |
      4. 6.5.4 Egypt | |
      5. 6.5.5 Rest of MEA
  7. 7 Competitive Landscape |
    1. 7.1 Market Share Analysis (2025) |
    2. 7.2 Competitive Benchmarking Matrix |
    3. 7.3 Company Profiles | |
      1. 7.3.1 Tencent Holdings | |
      2. 7.3.2 Sony Interactive Entertainment | |
      3. 7.3.3 Microsoft (Xbox / Activision Blizzard) | |
      4. 7.3.4 Nintendo | |
      5. 7.3.5 NetEase | |
      6. 7.3.6 Electronic Arts | |
      7. 7.3.7 Take-Two Interactive | |
      8. 7.3.8 Epic Games | |
      9. 7.3.9 Ubisoft | |
      10. 7.3.10 Valve Corporation
  8. 8 Future Outlook & Strategic Recommendations (2026–2035) |
    1. 8.1 AI-Driven Game Design & Procedural Content |
    2. 8.2 Platform Economics & Ecosystem Lock-In |
    3. 8.3 Immersive Hardware & Spatial Computing |
    4. 8.4 Sustainability & Digital Responsibility
  9. 9 Recent Developments & News
  10. 10 Frequently Asked Questions (FAQs)
  11. 11 Report Scope & Methodology |
    1. 11.1 Study Period & Base Year |
    2. 11.2 Data Sources & Citations |
    3. 11.3 Abbreviations
  12. 12 LIST OF TABLES |
  13. TABLE 1 Global Video Game Market Size & Forecast, by Revenue (USD Billion), 2021–2035 |
  14. TABLE 2 Global Video Game Market — Year-over-Year Growth Analysis, 2021–2035 |
  15. TABLE 3 Global Video Game Market — Driver Impact Analysis |
  16. TABLE 4 Global Video Game Market — Restraint Impact Analysis |
  17. TABLE 5 Global Video Game Market Size, by Device Type, 2021–2035 (USD Billion) |
  18. TABLE 6 Global Video Game Market Size, by Genre, 2021–2035 (USD Billion) |
  19. TABLE 7 Global Video Game Market Size, by Revenue Model, 2021–2035 (USD Billion) |
  20. TABLE 8 Global Video Game Market Size, by End-User, 2021–2035 (USD Billion) |
  21. TABLE 9 Global Video Game Market Size, by Region, 2021–2035 (USD Billion) |
  22. TABLE 10 North America Video Game Market Size, by Country, 2021–2035 (USD Billion) |
  23. TABLE 11 Europe Video Game Market Size, by Country, 2021–2035 (USD Billion) |
  24. TABLE 12 Asia-Pacific Video Game Market Size, by Country, 2021–2035 (USD Billion) |
  25. TABLE 13 South America Video Game Market Size, by Country, 2021–2035 (USD Billion) |
  26. TABLE 14 Middle East & Africa Video Game Market Size, by Country, 2021–2035 (USD Billion) |
  27. TABLE 15 Competitive Benchmarking Matrix — Global Video Game Market, 2025 |
  28. TABLE 16 Company Profiles — Key Players, Global Video Game Market |
  29. TABLE 17 Recent Developments & Strategic Announcements, 2023–2025 |
  30. TABLE 18 North America Video Game Market Size, by Device Type, 2021–2035 (USD Billion) |
  31. TABLE 19 North America Video Game Market Size, by Genre, 2021–2035 (USD Billion) |
  32. TABLE 20 North America Video Game Market Size, by Revenue Model, 2021–2035 (USD Billion) |
  33. TABLE 21 North America Video Game Market Size, by End-User, 2021–2035 (USD Billion) |
  34. TABLE 22 Europe Video Game Market Size, by Device Type, 2021–2035 (USD Billion) |
  35. TABLE 23 Europe Video Game Market Size, by Genre, 2021–2035 (USD Billion) |
  36. TABLE 24 Europe Video Game Market Size, by Revenue Model, 2021–2035 (USD Billion) |
  37. TABLE 25 Europe Video Game Market Size, by End-User, 2021–2035 (USD Billion) |
  38. TABLE 26 Asia-Pacific Video Game Market Size, by Device Type, 2021–2035 (USD Billion) |
  39. TABLE 27 Asia-Pacific Video Game Market Size, by Genre, 2021–2035 (USD Billion) |
  40. TABLE 28 Asia-Pacific Video Game Market Size, by Revenue Model, 2021–2035 (USD Billion) |
  41. TABLE 29 Asia-Pacific Video Game Market Size, by End-User, 2021–2035 (USD Billion) |
  42. TABLE 30 South America Video Game Market Size, by Device Type, 2021–2035 (USD Billion) |
  43. TABLE 31 South America Video Game Market Size, by Genre, 2021–2035 (USD Billion) |
  44. TABLE 32 South America Video Game Market Size, by Revenue Model, 2021–2035 (USD Billion) |
  45. TABLE 33 South America Video Game Market Size, by End-User, 2021–2035 (USD Billion) |
  46. TABLE 34 Middle East & Africa Video Game Market Size, by Device Type, 2021–2035 (USD Billion) |
  47. TABLE 35 Middle East & Africa Video Game Market Size, by Genre, 2021–2035 (USD Billion) |
  48. TABLE 36 Middle East & Africa Video Game Market Size, by Revenue Model, 2021–2035 (USD Billion) |
  49. TABLE 37 Middle East & Africa Video Game Market Size, by End-User, 2021–2035 (USD Billion) |
  50. TABLE 38 United States Video Game Market Size, by Device Type, 2021–2035 (USD Billion) |
  51. TABLE 39 United States Video Game Market Size, by Genre, 2021–2035 (USD Billion) |
  52. TABLE 40 United States Video Game Market Size, by Revenue Model, 2021–2035 (USD Billion) |
  53. TABLE 41 United States Video Game Market Size, by End-User, 2021–2035 (USD Billion) |
  54. TABLE 42 Canada Video Game Market Size, by Device Type, 2021–2035 (USD Billion) |
  55. TABLE 43 Canada Video Game Market Size, by Genre, 2021–2035 (USD Billion) |
  56. TABLE 44 Canada Video Game Market Size, by Revenue Model, 2021–2035 (USD Billion) |
  57. TABLE 45 Canada Video Game Market Size, by End-User, 2021–2035 (USD Billion) |
  58. TABLE 46 Mexico Video Game Market Size, by Device Type, 2021–2035 (USD Billion) |
  59. TABLE 47 Mexico Video Game Market Size, by Genre, 2021–2035 (USD Billion) |
  60. TABLE 48 Mexico Video Game Market Size, by Revenue Model, 2021–2035 (USD Billion) |
  61. TABLE 49 Mexico Video Game Market Size, by End-User, 2021–2035 (USD Billion) |
  62. TABLE 50 China Video Game Market Size, by Device Type, 2021–2035 (USD Billion) |
  63. TABLE 51 China Video Game Market Size, by Genre, 2021–2035 (USD Billion) |
  64. TABLE 52 China Video Game Market Size, by Revenue Model, 2021–2035 (USD Billion) |
  65. TABLE 53 China Video Game Market Size, by End-User, 2021–2035 (USD Billion) |
  66. TABLE 54 India Video Game Market Size, by Device Type, 2021–2035 (USD Billion) |
  67. TABLE 55 India Video Game Market Size, by Genre, 2021–2035 (USD Billion) |
  68. TABLE 56 India Video Game Market Size, by Revenue Model, 2021–2035 (USD Billion) |
  69. TABLE 57 India Video Game Market Size, by End-User, 2021–2035 (USD Billion) |
  70. TABLE 58 Japan Video Game Market Size, by Device Type, 2021–2035 (USD Billion) |
  71. TABLE 59 Japan Video Game Market Size, by Genre, 2021–2035 (USD Billion) |
  72. TABLE 60 Japan Video Game Market Size, by Revenue Model, 2021–2035 (USD Billion) |
  73. TABLE 61 Japan Video Game Market Size, by End-User, 2021–2035 (USD Billion) |
  74. TABLE 62 South Korea Video Game Market Size, by Device Type, 2021–2035 (USD Billion) |
  75. TABLE 63 South Korea Video Game Market Size, by Genre, 2021–2035 (USD Billion) |
  76. TABLE 64 South Korea Video Game Market Size, by Revenue Model, 2021–2035 (USD Billion) |
  77. TABLE 65 South Korea Video Game Market Size, by End-User, 2021–2035 (USD Billion) |
  78. TABLE 66 ASEAN Video Game Market Size, by Device Type, 2021–2035 (USD Billion) |
  79. TABLE 67 ASEAN Video Game Market Size, by Genre, 2021–2035 (USD Billion) |
  80. TABLE 68 ASEAN Video Game Market Size, by Revenue Model, 2021–2035 (USD Billion) |
  81. TABLE 69 ASEAN Video Game Market Size, by End-User, 2021–2035 (USD Billion) |
  82. TABLE 70 Germany Video Game Market Size, by Device Type, 2021–2035 (USD Billion) |
  83. TABLE 71 Germany Video Game Market Size, by Genre, 2021–2035 (USD Billion) |
  84. TABLE 72 Germany Video Game Market Size, by Revenue Model, 2021–2035 (USD Billion) |
  85. TABLE 73 Germany Video Game Market Size, by End-User, 2021–2035 (USD Billion) |
  86. TABLE 74 United Kingdom Video Game Market Size, by Device Type, 2021–2035 (USD Billion) |
  87. TABLE 75 United Kingdom Video Game Market Size, by Genre, 2021–2035 (USD Billion) |
  88. TABLE 76 United Kingdom Video Game Market Size, by Revenue Model, 2021–2035 (USD Billion) |
  89. TABLE 77 United Kingdom Video Game Market Size, by End-User, 2021–2035 (USD Billion) |
  90. TABLE 78 France Video Game Market Size, by Device Type, 2021–2035 (USD Billion) |
  91. TABLE 79 France Video Game Market Size, by Genre, 2021–2035 (USD Billion) |
  92. TABLE 80 France Video Game Market Size, by Revenue Model, 2021–2035 (USD Billion) |
  93. TABLE 81 France Video Game Market Size, by End-User, 2021–2035 (USD Billion) |
  94. TABLE 82 Brazil Video Game Market Size, by Device Type, 2021–2035 (USD Billion) |
  95. TABLE 83 Brazil Video Game Market Size, by Genre, 2021–2035 (USD Billion) |
  96. TABLE 84 Brazil Video Game Market Size, by Revenue Model, 2021–2035 (USD Billion) |
  97. TABLE 85 Brazil Video Game Market Size, by End-User, 2021–2035 (USD Billion) |
  98. TABLE 86 Saudi Arabia Video Game Market Size, by Device Type, 2021–2035 (USD Billion) |
  99. TABLE 87 Saudi Arabia Video Game Market Size, by Genre, 2021–2035 (USD Billion) |
  100. TABLE 88 Saudi Arabia Video Game Market Size, by Revenue Model, 2021–2035 (USD Billion) |
  101. TABLE 89 Saudi Arabia Video Game Market Size, by End-User, 2021–2035 (USD Billion) |
  102. TABLE 90 UAE Video Game Market Size, by Device Type, 2021–2035 (USD Billion) |
  103. TABLE 91 UAE Video Game Market Size, by Genre, 2021–2035 (USD Billion) |
  104. TABLE 92 UAE Video Game Market Size, by Revenue Model, 2021–2035 (USD Billion) |
  105. TABLE 93 UAE Video Game Market Size, by End-User, 2021–2035 (USD Billion) |
  106. TABLE 94 Report Scope & Methodology Summary
  107. 13 LIST OF FIGURES |
  108. FIGURE 1 Global Video Game Market Dynamics — Drivers, Restraints & Opportunities |
  109. FIGURE 2 Industry Value Chain Analysis — Video Game Market |
  110. FIGURE 3 Porter's Five Forces Analysis — Video Game Market |
  111. FIGURE 4 Global Video Game Market Size Trend & Forecast (USD Billion), 2021–2035 |
  112. FIGURE 5 Global Video Game Market Share, by Device Type (%), 2025 |
  113. FIGURE 6 Global Video Game Market Share, by Genre (%), 2025 |
  114. FIGURE 7 Global Video Game Market Share, by Revenue Model (%), 2025 |
  115. FIGURE 8 Global Video Game Market Share, by End-User (%), 2025 |
  116. FIGURE 9 Global Video Game Market Share, by Region (%), 2025 |
  117. FIGURE 10 North America Video Game Market Size Trend (USD Billion), 2021–2035 |
  118. FIGURE 11 Europe Video Game Market Size Trend (USD Billion), 2021–2035 |
  119. FIGURE 12 Asia-Pacific Video Game Market Size Trend (USD Billion), 2021–2035 |
  120. FIGURE 13 South America Video Game Market Size Trend (USD Billion), 2021–2035 |
  121. FIGURE 14 Middle East & Africa Video Game Market Size Trend (USD Billion), 2021–2035 |
  122. FIGURE 15 Competitive Landscape — Market Share Distribution (%), 2025 |
  123. FIGURE 16 Competitive Benchmarking Radar — Top 10 Players, 2025

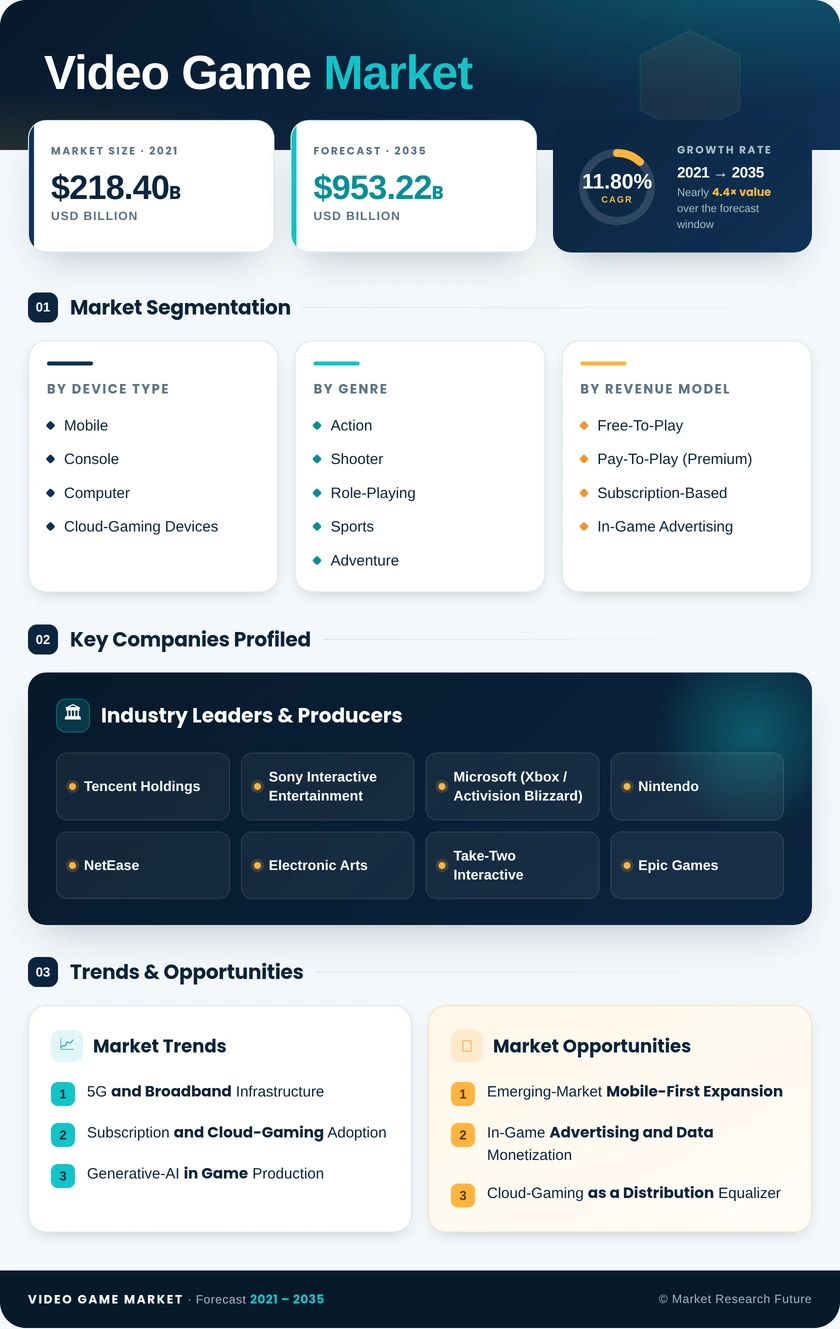
Segmentation Quick Reference

DimensionSub-SegmentsDominant SegmentFastest Growing Segment
Device TypeMobile, Console, Computer, Cloud-Gaming DevicesMobileCloud-Gaming Devices
GenreAction, Shooter, Role-Playing, Sports, AdventureActionRole-Playing
Revenue ModelFree-To-Play, Pay-To-Play (Premium), Subscription-Based, In-Game AdvertisingFree-To-PlaySubscription-Based
End-UserCasual Gamers, Hardcore / Competitive Gamers, Professional Esports AthletesCasual GamersProfessional Esports Athletes
GeographyNorth America, Europe, Asia-Pacific, South America, Middle East & AfricaAsia-PacificMiddle East & Africa


Market Segmentation Overview

By Device Type

Sub-SegmentKey Trend
MobileExpanding addressable market through smartphone ubiquity in APAC and MEA
ConsoleExclusive AAA franchises sustaining premium pricing and hardware attachment rates
ComputerHigh-refresh-rate esports titles and modding communities are driving hardware upgrade cycles
Cloud-Gaming DevicesSubscription streaming services are removing upfront hardware cost barriers


Mobile devices continue to lead by user count and revenue share, benefiting from the global installed base of over 6 billion smartphones. Cloud-gaming devices, though a small share today, are growing fastest as publishers invest in server-side rendering and edge-network infrastructure.

By Genre

Sub-SegmentKey Trend
ActionCross-platform live-service models maintaining high daily active user counts
ShooterCompetitive multiplayer and esports viewership are sustaining long title lifecycles
Role-PlayingOpen-world design and seasonal content drops fueling rapid revenue growth
SportsAnnual franchise releases and real-world league licensing agreements
AdventureIndie studios and narrative-driven experiences are gaining commercial traction


Action titles lead the genre landscape by revenue, while role-playing games are the fastest-growing category — driven by demand for expansive, story-rich experiences across both Eastern and Western audiences.

By Revenue Model

Sub-SegmentKey Trend
Free-To-PlayMicrotransaction and battle-pass economies are dominating mobile and PC engagement
Pay-To-Play (Premium)AAA launch events and limited-edition releases are sustaining higher price points
Subscription-BasedCatalog-access services are increasing average user spending and retention metrics
In-Game AdvertisingProgrammatic ad placement generates a secondary monetization layer


Free-to-play remains the dominant revenue model, but subscription services are reshaping the competitive dynamics by offering players access to hundreds of titles for a fixed monthly fee — a model that rewards catalog depth and platform lock-in.

By End-User

Sub-SegmentKey Trend
Casual GamersLow-commitment, mobile-first titles driving broad demographic adoption
Hardcore / Competitive GamersPremium hardware investment and high engagement sustaining per-user revenue
Professional Esports AthletesPrize pools, league salaries, and media-rights deals are scaling rapidly


Casual gamers represent the majority of the player base by volume, while professional esports athletes — though a small segment — are expanding the fastest as tournament ecosystems mature and sponsorship revenues grow.