SEGMENTATION QUICK REFERENCE
| Dimension | Sub-Segments | Dominant Segment | Fastest Growing Segment |
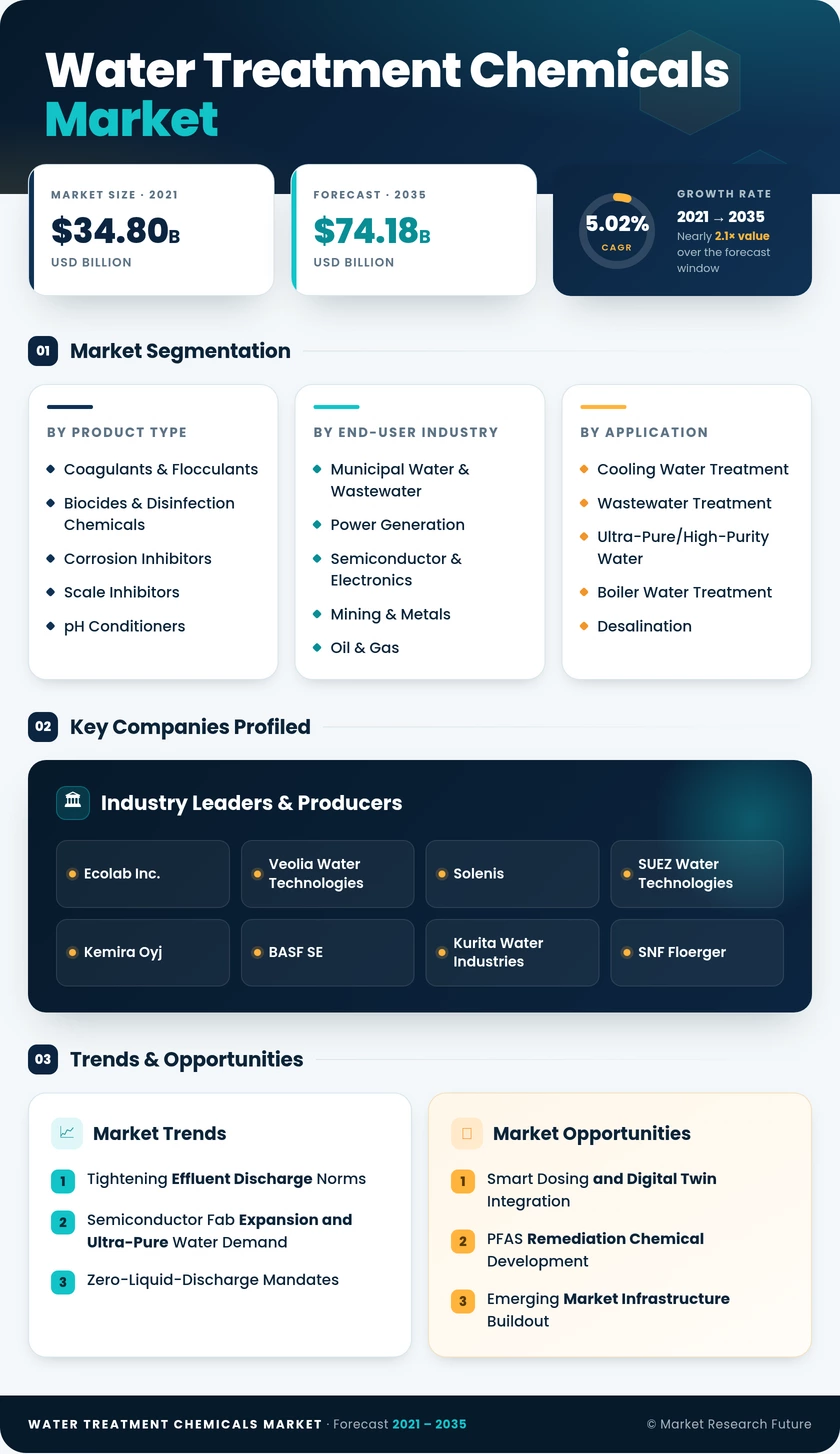
| Product Type | Coagulants & Flocculants, Biocides & Disinfection Chemicals, Corrosion Inhibitors, Scale Inhibitors, pH Conditioners, Others | Coagulants & Flocculants | Corrosion Inhibitors |
| End-User Industry | Municipal Water & Wastewater, Power Generation, Semiconductor & Electronics, Mining & Metals, Oil & Gas, Food & Beverage, Others | Municipal Water & Wastewater | Semiconductor & Electronics |
| Application | Cooling Water Treatment, Wastewater Treatment, Ultra-Pure/High-Purity Water, Boiler Water Treatment, Desalination, Others | Cooling Water Treatment | Ultra-Pure/High-Purity Water Treatment |
| Treatment Stage | Primary, Secondary, Tertiary, Sludge Handling & Conditioning | Primary Treatment | Sludge Handling & Conditioning |
| Geography | Asia-Pacific, North America, Europe, South America, the Middle East & Africa | Asia-Pacific | Asia-Pacific |
MARKET SEGMENTATION OVERVIEW
By Product Type
| Sub-Segment | Key Trend |
| Coagulants & Flocculants | Shift from aluminum sulfate to PAC; bio-based flocculant R&D gaining traction. |
| Biocides & Disinfection Chemicals | Peracetic acid adoption rising as chlorine DBP concerns intensify. |
| Corrosion Inhibitors | Transition to filming amines and non-toxic alternatives for closed-loop systems |
| Scale Inhibitors | Phosphonate-free formulations accelerating under REACH regulatory pressure |
| pH Conditioners | Lime and caustic soda remain dominant; CO₂-based conditioning is emerging. |
| Others (Defoamers, Chelants, Oxygen Scavengers) | Specialty demand is growing in food-grade and pharmaceutical applications |
Coagulants and flocculants anchor the product-type segmentation, serving as essential chemistry for solids removal in both primary and secondary treatment stages. The sub-segment is transitioning toward higher-performance polymeric formulations that reduce sludge volumes while improving clarification efficiency across diverse water matrices.
By End-User Industry
| Sub-Segment | Key Trend |
| Municipal Water & Wastewater | EU UWWTD quaternary mandates expanding chemical budgets |
| Power Generation | Coal retirements offset by gas-turbine and nuclear cooling demand. |
| Semiconductor & Electronics | Sub-3nm fabs pushing ultra-pure water chemistry to extreme specifications. |
| Mining & Metals | ZLD compliance and tailings treatment driving polymer demand |
| Oil & Gas | Produced water volumes are increasing with unconventional extraction. |
| Food & Beverage | CIP (clean-in-place) chemical demand rising with food safety standards |
| Others (Pulp/Paper, Pharma, Textiles) | India textile ZLD mandates creating substantial new demand |
Municipal utilities represent the most stable demand base, with long procurement cycles and regulatory-driven budgets. The semiconductor segment is notable for its premium unit economics, where specialty chemical pricing runs 5–8× higher than commodity municipal grades.
By Application
| Sub-Segment | Key Trend |
| Cooling Water Treatment | Legacy chromate programs replaced by molybdate and azole chemistries |
| Wastewater Treatment | Real-time dosing optimization reduces per-unit chemical consumption. |
| Ultra-Pure/High-Purity Water | Hydrogen and semiconductor demand are creating a dual growth engine. |
| Boiler Water Treatment | Internal treatment programs are gaining share over external softening. |
| Desalination | Antiscalant innovation extending membrane life by 20–30% |
| Others (Process Water, Potable) | Direct potable reuse programs are emerging in water-stressed regions |
Cooling water treatment remains the largest application segment by revenue, though its growth rate is moderate given the mature installed base. Ultra-pure water treatment offers the highest growth trajectory as the semiconductor and green-hydrogen industries scale simultaneously.
By Treatment Stage
| Sub-Segment | Key Trend |
| Primary Treatment | PAC and ferric chloride dosing optimization via smart sensors |
| Secondary Treatment | Biological augmentation chemicals reduce aeration energy costs. |
| Tertiary Treatment | Activated carbon and advanced oxidation for micropollutant removal |
| Sludge Handling & Conditioning | High-performance dewatering polymers reduce disposal volumes. |
Primary treatment dominates by share, reflecting the fundamental role of coagulation and flocculation in virtually every water and wastewater treatment process. Sludge handling and conditioning is the fastest-growing stage, driven by tightening biosolids regulations and the economics of volume reduction before disposal or beneficial reuse.