Wearable Sensors Market (2026 - 2035)

Wearable Sensors Market Research Report: Size, Share, Trend Analysis By Applications (Fitness Tracking, Health Monitoring, Smart Clothing, Industrial Applications, Entertainment), By Types (Inertial Sensors, Environmental Sensors, Biometric Sensors, Motion Sensors, Pressure Sensors), By End Use (Healthcare, Sports Fitness, Military Defense, Consumer Electronics, Automotive), By Component (Hardware, Software, Services) and By Regional (North America, Europe, South America, Asia Pacific, Middle East and Africa) - Growth Outlook & Industry Forecast 2025 To 2035
ID: MRFR/HC/0449-CR
200 Pages
Nidhi Mandole, Rahul Gotadki
Last Updated: June 27, 2026
Wearable Sensors Market
Market Size
Forecast Period2026-2035
CAGR (2026-2035)17.50%
2025 Market SizeUSD 5.25 Billion
2035 Market SizeUSD 26.34 Billion
Key Players
STMicroelectronics
Texas Instruments
Analog Devices
TDK Corporation
Bosch Sensortec
NXP Semiconductors
Opportunities
  • Clinical-Grade Patch Ecosystems for Chronic Disease
  • Emerging-Market Telehealth Infrastructure
  • Enterprise Wellness and Occupational Safety

Wearable Sensors Market Summary

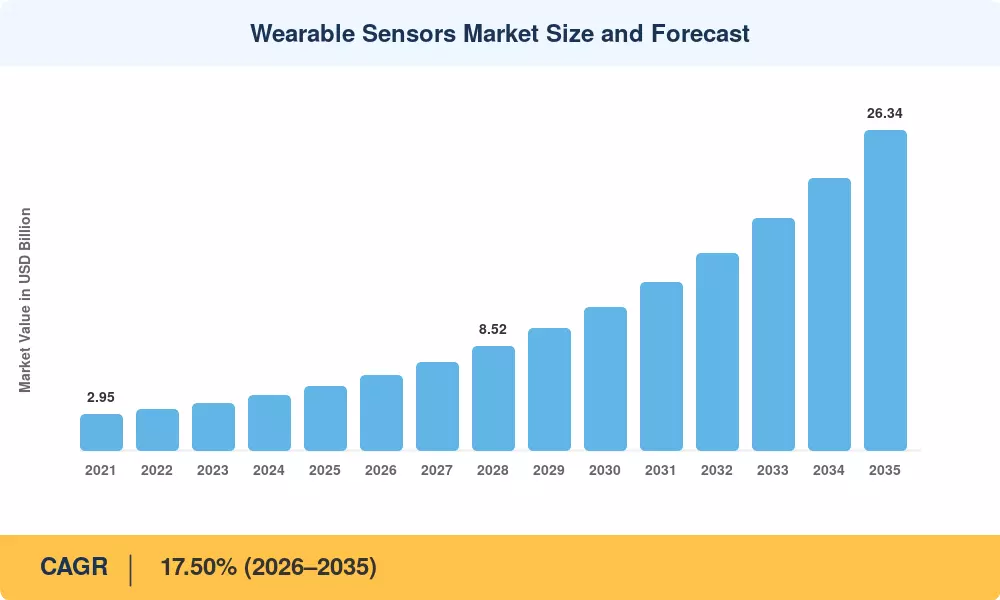
The Global Wearable Sensors Market size was valued at USD 5.25 Billion in 2025, and the market is projected to grow from USD 6.17 Billion in 2026 to USD 26.34 Billion by 2035, registering a CAGR of 17.50% during the forecast period 2026–2035. This trajectory reflects accelerating adoption of physiological monitoring across healthcare, fitness, and industrial safety verticals. The U.S. FDA's expanded De Novo pathway for software-as-a-medical-device cleared 47 wearable-class submissions in 2024 alone, while CMS reimbursement codes for remote patient monitoring now cover over 130 million Medicare beneficiaries [1]. These regulatory tailwinds have unlocked billions in payer-funded demand that did not exist five years ago.

A structural technology shift is redefining the Wearable Sensors Market. Legacy clip-on pulse oximeters and bulky Holter monitors are giving way to ultra-thin, skin-conformal sensor arrays powered by advances in flexible substrates and system-on-chip integration. STMicroelectronics reported that its latest MEMS inertial modules consume 40% less power than 2022 equivalents while embedding on-device machine-learning inference cores [2]. Semiconductor R&D investment in wearable-grade sensors exceeded USD 3.8 billion globally in 2024, with over 60% directed at sub-milliwatt analog front-ends and multi-modal sensor fusion [3].

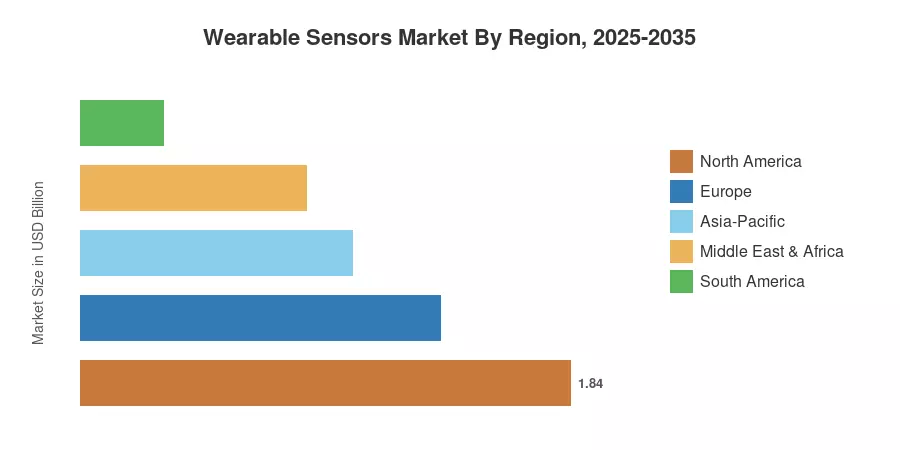
North America leads the Wearable Sensors Market with an estimated 35.1% revenue share in 2025, driven by robust insurance reimbursement frameworks and a dense digital-health startup ecosystem. Asia-Pacific is the fastest-growing region, anticipated to expand at a 19.40% CAGR through 2035, propelled by government-backed smart-city health initiatives in China, India, and South Korea. Europe holds the second-largest share at roughly 25.8%, anchored by the EU Medical Device Regulation (MDR 2017/745) and aging-population demographics. As 5G infrastructure matures globally, the Wearable Sensors Market is positioned for sustained double-digit growth well into the next decade.


Key Report Takeaways

• By Sensor Type

  • Motion sensors commanded 36.0% of the Wearable Sensors Market share in 2025, underpinned by universal integration across smartwatches, fitness bands, and industrial wearables.
  • Biosensors represent the fastest-expanding category, projected to grow at a 20.20% CAGR through 2035, fueled by clinical-grade biomarker detection and chronic disease management applications.

• By Application

  • Health and wellness accounted for 48.8% of Wearable Sensors Market revenue in 2025, reflecting consumer demand for preventive care and real-time biometric dashboards.
  • Remote patient monitoring is forecast to register a 20.80% CAGR to 2035, as telehealth reimbursement policies expand globally.

• By Region

  • North America maintained the dominant position in the Wearable Sensors Market with 35.1% share in 2025.
  • Asia-Pacific is projected to deliver the highest CAGR of 19.40% to 2035, led by China and India.


Wearable Sensors Market Size and Forecast (2021–2035)

Market Research Future's sizing methodology triangulates bottom-up sensor shipment volumes from leading semiconductor fabs, top-down healthcare spending allocations, and enterprise procurement datasets. Historical figures draw on verified company filings and customs trade data, while forecast projections apply demand-curve modeling calibrated to regulatory release schedules and consumer adoption S-curves.
Wearable Sensors Market Size and Forecast
Our Impact
Enabled $4.3B Revenue Impact for Fortune 500 and Leading Multinationals
Partnering with 2000+ Global Organizations Each Year
30K+ Citations by Top-Tier Firms in the Industry

Driver Impact Analysis

Driver ~% Impact on CAGR Geographic Relevance Impact Timeline
RPM reimbursement expansion ~22% North America, Europe Short-term
MEMS cost reduction and miniaturization ~18% Global Medium-term
5G/6G low-latency connectivity ~15% Asia-Pacific, North America Medium-term
AI-on-chip edge analytics ~14% Global Medium-term
Corporate wellness mandates ~12% North America, Europe Short-term
Aging population demographics ~11% Europe, Japan Long-term
Regulatory harmonization (EU MDR, FDA) ~8% North America, Europe Long-term


Remote Patient Monitoring Reimbursement Expansion

CMS reimbursement codes CPT 99453–99458 generated an estimated USD 2.9 billion in provider claims during 2024, a 34% increase year-over-year [1]. Private insurers such as UnitedHealth and Aetna have followed with parallel coverage frameworks, creating a recurring revenue floor for sensor OEMs supplying clinical-grade wearable devices. This Wearable Sensors Market driver has the most immediate near-term impact because it converts physician skepticism into procurement budgets almost overnight once payer coverage is confirmed.

MEMS Cost Reduction and Miniaturization

Average selling prices for six-axis inertial measurement units dropped below USD 0.35 per unit in 2024, down from USD 0.82 in 2020, according to MEMS Industry Group data [2]. That 57% decline has made it economically viable to embed multi-sensor arrays into disposable patch formats and consumer-grade earbuds. Bosch Sensortec's BHI360 and STMicroelectronics' LSM6DSV16BX both pack 16-bit accelerometers and gyroscopes into packages under 2.5 mm², setting a new density benchmark for the Wearable Sensors Market.

5G and Next-Generation Connectivity

Low-latency 5G networks are critical to unlocking real-time clinical decision support from wearable sensors. A 2024 Frontiers in Medicine study found that 5G-enabled smart-hospital trials in Seoul and Singapore reduced diagnostic data-transfer latency by 87% compared to 4G baselines [4]. For the Wearable Sensors Market, this translates into faster alarm-to-intervention cycles for remote cardiac monitoring patients and enables bandwidth-intensive use cases such as continuous high-resolution EEG streaming.

AI-on-Chip Edge Analytics

On-device machine-learning inference eliminates cloud round-trips and extends battery life by up to 60% according to STMicroelectronics application notes [3]. Apple's S9 chip in the Watch Ultra 2 runs atrial fibrillation classification locally, while Google's Tensor Wear module processes sleep-staging algorithms at under 1 mW. These capabilities make wearable sensors smarter without making them bulkier, a combination that directly expands the Wearable Sensors Market addressable base.


Restraints Impact Analysis

The restraint impacts below are directional estimates representing headwinds to growth. They are not algebraically subtracted from the CAGR and should be read as qualitative severity indicators.

Restraint ~% Negative Impact on CAGR Geographic Relevance Impact Timeline
Battery material supply constraints ~−4.5% Global Medium-term
Data privacy and regulatory fragmentation ~−3.8% Europe, North America Long-term
Sensor accuracy and clinical validation gaps ~−3.2% Global Medium-term
Skin biocompatibility and wear comfort ~−2.5% Global Short-term
Interoperability and standards silos ~−2.0% Global Long-term


Battery Material Supply Constraints

Lithium-polymer micro-cell production remains concentrated among five Asian suppliers, and cobalt price volatility — which saw a 28% spike in Q3 2024 — directly inflates bill-of-materials costs for compact wearable devices [8]. This constraint is particularly acute for the Wearable Sensors Market patch segment, where form-factor limitations preclude larger battery capacities. Solid-state thin-film batteries offer a pathway, but volume manufacturing readiness is unlikely before 2028.

Data Privacy and Regulatory Fragmentation

The EU General Data Protection Regulation (GDPR), California's CCPA/CPRA, and China's PIPL impose divergent consent and data-localization requirements that complicate global product launches [9]. A 2024 IAPP survey found that compliance costs add an average of 11% to software development budgets for health-data wearable products. For the Wearable Sensors Market, this patchwork creates a non-trivial barrier for smaller innovators seeking multi-region launches.

Clinical Validation and Accuracy Gaps

Consumer-grade photoplethysmography (PPG) sensors still exhibit error margins of ±5 bpm during high-motion activities, and SpO₂ readings show reduced accuracy on darker skin tones, according to a 2023 Journal of Biomedical Engineering meta-analysis [10]. These performance gaps limit clinical acceptance and slow the migration of the Wearable Sensors Market from wellness into regulated diagnostics.


Wearable Sensors Market Opportunities

Clinical-Grade Patch Ecosystems for Chronic Disease

Single-use adhesive patches for continuous streaming of heart rhythm, glucose and hydration data provide a USD 1.8 billion addressable market by 2030. Abbott’s Libre portfolio has shown the willingness of patients to use sensor patches and the Wearable Sensors Market will be helped as second-generation multi-analyte patches enter FDA 510(k) evaluation.


Emerging-Market Telehealth Infrastructure

The Ayushman Bharat Digital Mission in India and Indonesia’s national e-health strategy are creating fresh demand for inexpensive wearables in primary-care settings. These markets with combined populations of over 1.7 billion provide scale economics that may alter global supply-chain dynamics for the Wearable Sensors Market.


Enterprise Wellness and Occupational Safety

In 2024, Chevron deployed hydration-monitoring patches in pilot fashion among workers at its Gulf Coast refineries, and saw a 23% reduction in heat-related occurrences [5]. Scaled corporate wellness programs – especially in mining, logistics and manufacturing – provide an enterprise channel to the traditionally consumer-dominated Wearable Sensors Market.


Data Monetization and Sensor-as-a-Service Models

Aggregated, de-identified physiological data are valuable for insurance actuarial modeling, and pharmaceutical clinical-trial enrichment. Some companies like Whoop and Oura have started to license cohort-level insights under HIPAA-compliant structures, establishing recurring SaaS revenue streams that detach Wearable Sensors Market development from hardware replacement cycles.


Sports Analytics and Performance Optimization

Professional and collegiate sports organizations spent an estimated USD 680 million on athlete biometric monitoring in 2024. The convergence of inertial, strain-gauge, and biochemical sensors into unified wearable platforms creates a high-margin niche within the broader Wearable Sensors Market.


Wearable Sensors Market Future Outlook

AI-Driven Predictive Health and Preventive Care

The convergence of large language models and multi-modal sensor data will transform the Wearable Sensors Market from reactive monitoring to predictive health management. By 2030, the WHO estimates that AI-augmented wearable diagnostics could avert 2.1 million preventable hospitalizations annually in OECD countries alone [17]. Wearable sensors will increasingly serve as the data backbone for digital twin health models that simulate patient trajectories.

Platform Economics and Ecosystem Lock-In

Apple, Google, and Samsung are building vertically integrated health platforms where proprietary sensor hardware feeds closed software ecosystems. This platform dynamic will shape competitive structure in the Wearable Sensors Market for the next decade, rewarding companies that control both the sensor layer and the data analytics layer while marginalizing pure-play component suppliers.

Sustainability and Circular Design

E-waste regulations are tightening globally, and the European Commission's proposed Ecodesign for Sustainable Products Regulation (ESPR) will mandate recyclability targets for consumer electronics by 2028 [18]. For the Wearable Sensors Market, this means designing for disassembly, biodegradable substrates, and extended product lifecycles — shifts that will add cost in the near term but open differentiation opportunities for ESG-conscious brands.

Decentralized Clinical Trials and Real-World Evidence

Pharmaceutical companies are accelerating adoption of wearable-sensor-derived endpoints in clinical trials, with the FDA accepting wearable-generated data as primary or secondary endpoints in 18 pivotal studies during 2024 [19]. By 2035, decentralized trial architectures will constitute a significant demand channel for the Wearable Sensors Market, as sponsors seek continuous, objective biomarker data that traditional site visits cannot provide.


Wearable Sensors Market Segmentation

By Sensor Type

Segment Key Metric Primary Demand Driver
Motion Sensors 36.0% share (2025) Fitness tracking, fall detection
Biosensors 20.20% CAGR (2026–2035) Clinical biomarker monitoring
Chemical and Gas Sensors USD 0.42 Billion (2025) Industrial safety, environmental
Pressure Sensors 15.80% CAGR (2026–2035) Blood pressure, altitude
Temperature Sensors USD 0.36 Billion (2025) Fever detection, fertility tracking
Optical Sensors 18.40% CAGR (2026–2035) PPG heart rate, SpO₂


Motion sensors anchor the Wearable Sensors Market because accelerometers and gyroscopes are embedded in virtually every wrist-worn and ear-worn device. Their ubiquity reflects both low unit cost and versatile applicability — from step counting in consumer fitness bands to gait analysis in clinical rehabilitation. Biosensors are gaining ground rapidly as enzyme-coated electrochemical arrays and impedance-based analyte detection move from laboratory prototypes into mass-produced patches and rings, driven by chronic-disease management demand.

By Application

Segment Key Metric Primary Demand Driver
Health and Wellness 48.8% share (2025) Consumer preventive care
Remote Patient Monitoring 20.80% CAGR (2026–2035) CMS reimbursement, telehealth
Sports and Fitness USD 0.63 Billion (2025) Professional and amateur athletics
Industrial and Occupational Safety 17.90% CAGR (2026–2035) OSHA compliance, heat stress
Military and Defense USD 0.22 Billion (2025) Warfighter performance optimization


Health and wellness remains the largest application within the Wearable Sensors Market, powered by consumer willingness to pay for real-time heart-rate, sleep, and activity insights. Remote patient monitoring is closing the gap as payers increasingly cover sensor-enabled home care, particularly for congestive heart failure, COPD, and Type 2 diabetes management populations.

By Device Form Factor

Segment Key Metric Primary Demand Driver
Smartwatches 54.0% share (2025) Multi-sensor integration
Patches 22.70% CAGR (2026–2035) Clinical adhesive monitoring
Fitness Bands USD 0.48 Billion (2025) Affordable entry-level devices
Earbuds and Hearables 19.50% CAGR (2026–2035) In-ear biometrics, audio health
Smart Clothing USD 0.15 Billion (2025) Textile-embedded sensors


Smartwatches dominate the Wearable Sensors Market by device form factor because they offer the largest sensor real estate on a widely adopted consumer platform. Patches are the fastest-growing form factor, transitioning from single-use cardiac monitors into multi-analyte platforms worn for up to 14 days, with clinical validation enabling reimbursement-backed distribution channels.

By Connectivity Technology

Segment Key Metric Primary Demand Driver
Bluetooth Low Energy (BLE) 76.5% share (2025) Universal smartphone pairing
NFC 20.60% CAGR (2026–2035) Tap-to-read diagnostics
Wi-Fi USD 0.21 Billion (2025) High-bandwidth data sync
Cellular (LTE/5G) 19.80% CAGR (2026–2035) Standalone connectivity
ANT+ USD 0.08 Billion (2025) Legacy fitness ecosystem


BLE dominates the Wearable Sensors Market connectivity landscape due to its ultra-low power profile and native smartphone compatibility. NFC is emerging as a compelling alternative for disposable and single-use medical patches where passive data readout eliminates the need for an onboard battery, reducing both cost and form-factor constraints.


Regional Market Share Analysis

Region Key Metric Primary Investment Themes
North America 35.1% share (2025) RPM reimbursement, digital therapeutics
Europe 25.8% share (2025) EU MDR compliance, aging demographics
Asia-Pacific 19.40% CAGR (2026–2035) Smart-city health, low-cost MEMS
South America USD 0.31 Billion (2025) Telehealth access, public health digitization
Middle East & Africa 16.20% CAGR (2026–2035) Vision 2030, medical tourism
Total USD 5.25 Billion (2025)

The Wearable Sensors Market exhibits pronounced regional variation driven by healthcare spending patterns, regulatory maturity, and consumer technology penetration.


North America

Country Key Metric Key Driver
US 78.4% of regional share Medicare RPM expansion
Canada 13.70% CAGR Provincial digital health mandates
Mexico USD 0.05 Billion (2025) Nearshoring of medtech manufacturing


The United States dominates the North American Wearable Sensors Market through a combination of insurance reimbursement depth, a mature venture-capital ecosystem funding over 320 wearable health startups, and FDA regulatory clarity that gives OEMs a defined pathway to market. Canada's pan-Canadian Health Data Strategy, funded at CAD 505 million through 2027, is accelerating interoperability standards that lower barriers for wearable sensor integration into provincial EHR systems [14].

Europe

Country Key Metric Key Driver
Germany 22.5% of regional share Industry 4.0 worker safety wearables
UK 19.80% CAGR NHS remote monitoring pilots
France USD 0.18 Billion (2025) Chronic disease prevention programs
Italy 14.30% CAGR Silver economy digital health
Spain USD 0.09 Billion (2025) Tourism-linked wellness tech
Nordic Countries 17.60% CAGR E-health leadership, high digital literacy
Russia USD 0.06 Billion (2025) Import substitution initiatives
Rest of Europe 12.8% of regional share Mixed regulatory maturity


The EU Medical Device Regulation (MDR 2017/745) has imposed stringent clinical-evidence requirements that initially slowed market entry but are now rewarding certified Wearable Sensors Market players with stronger competitive moats. Germany's Federal Ministry of Health allocated EUR 420 million in 2024 for DiGA (Digital Health Applications) reimbursement, of which an estimated 38% funds wearable-sensor-enabled prescriptions [7].

Asia-Pacific

Country Key Metric Key Driver
China 34.6% of regional share National sensor industry subsidies
India 21.50% CAGR Ayushman Bharat digital health scale
Japan USD 0.19 Billion (2025) Super-aging society remote monitoring
South Korea 20.10% CAGR 5G infrastructure & K-health exports
ASEAN USD 0.11 Billion (2025) Public health modernization
Rest of Asia-Pacific 15.90% CAGR Varied adoption curves


Asia-Pacific is the engine of future Wearable Sensors Market expansion. China's "Made in China 2025" semiconductor plan channels direct subsidies to domestic MEMS foundries, reducing import dependence and lowering sensor ASPs for local OEMs. India's Ayushman Bharat program has enrolled over 550 million citizens in digital health IDs, creating a massive addressable base for low-cost wearable diagnostics in primary-care settings [15].

South America

Country Key Metric Key Driver
Brazil 52.3% of regional share SUS public health digitization
Argentina 15.80% CAGR Private telehealth growth
Rest of South America USD 0.05 Billion (2025) Early-stage adoption


Brazil's Unified Health System (SUS) has initiated pilot programs in São Paulo and Rio de Janeiro integrating wearable vitals monitors into community health agent workflows. The Wearable Sensors Market in South America remains nascent but is gaining traction as smartphone penetration exceeds 78% and mobile-first health applications proliferate.

Middle East & Africa

Country Key Metric Key Driver
Saudi Arabia 28.7% of regional share Vision 2030 health transformation
UAE 18.90% CAGR Smart-city wellness infrastructure
South Africa USD 0.04 Billion (2025) Mining and industrial safety
Egypt 16.50% CAGR Population-scale telehealth
Rest of MEA USD 0.05 Billion (2025) NGO-funded health programs


Saudi Arabia's Vision 2030 Health Sector Transformation program has committed SAR 12 billion to digital health infrastructure, with wearable remote monitoring positioned as a core pillar for reducing hospital readmissions. The UAE's Ministry of Health mandated wearable-based post-surgical monitoring for select procedures in Dubai Health Authority facilities beginning 2025 [16].


Wearable Sensors Market By Region, 2025-2035

Competitive Benchmarking

The Wearable Sensors Market exhibits medium concentration, with the top five players collectively holding an estimated 38–45% revenue share. The Herfindahl-Hirschman Index (HHI) falls in the moderately competitive range (~1,200–1,500), reflecting a mix of vertically integrated semiconductor giants and specialized medtech innovators. Competition is intensifying as consumer electronics firms push deeper into clinical-grade sensing while medical device companies adopt consumer-friendly form factors.

Company Est. Revenue Share Range Key Offerings Strategic Positioning
STMicroelectronics ~8–11% MEMS IMUs, biosensor AFEs, ML-enabled MCUs Broadest wearable sensor portfolio with edge-AI integration
Texas Instruments ~7–10% Analog front-ends, low-power signal chains Deep expertise in precision biosignal acquisition
Analog Devices ~6–9% High-resolution ADCs, impedance analyzers Clinical-grade accuracy for medical wearables
TDK Corporation ~5–8% InvenSense IMUs, MEMS microphones, pressure sensors Strong motion-sensing legacy, audio health pivot
Bosch Sensortec ~5–7% BMI/BHI smart sensor hubs, environmental sensors Consumer-fitness dominance with software ecosystem
NXP Semiconductors ~4–6% NFC controllers, UWB, secure elements Connectivity and security for medical data
TE Connectivity ~3–5% Piezo sensors, strain gauges, temperature probes Industrial and medical harsh-environment focus
Abbott Laboratories ~4–7% Libre CGM platform, cardiac rhythm monitors Direct-to-consumer medical sensor ecosystem
Dexcom ~3–5% G7 CGM, Stelo biosensor Real-time glucose analytics and payer partnerships
Medtronic ~3–5% Guardian CGM, cardiac insertable monitors Deep clinical evidence base and hospital relationships


Recent News & Developments

  • STMicroelectronics (March 2025): Launched the LSM6DSV32X ultra-low-power IMU with embedded machine-learning core targeting always-on gesture recognition for next-generation smartwatches and hearables [2].
  • Abbott Laboratories (January 2025): Received FDA clearance for Libre 3 Plus, extending sensor wear time to 15 days and adding ketone body tracking capability alongside glucose monitoring [20].


  • Bosch Sensortec (June 2024): Unveiled the BHI380 smart sensor hub featuring a dedicated neural-network accelerator consuming under 1.5 mW during continuous activity classification [23].


Wearable Sensors Market Report Scope

Parameter Detail
Market Scope Global Wearable Sensors Market across sensor type, application, device form factor, connectivity, and end-user industry
Study Period 2021–2035
CAGR (Forecast) 17.50% (2026–2035)
Market Size (2025) USD 5.25 Billion
Market Size (2035) USD 26.34 Billion
Fastest Growing Segment Patches (by device form factor); Biosensors (by sensor type)
Companies Profiled STMicroelectronics, Texas Instruments, Analog Devices, TDK Corporation, Bosch Sensortec, NXP Semiconductors, TE Connectivity, Abbott Laboratories, Dexcom, Medtronic
Valuation Currency USD Billion


FAQs

How do wearable sensor accuracy standards differ between consumer wellness and clinical diagnostic classifications?
Consumer devices follow voluntary standards like ISO 81060-2, while clinical sensors require FDA 510(k) or De Novo clearance with validated accuracy thresholds. This regulatory gap means performance claims on consumer products carry no binding clinical accountability [10].
What total cost of ownership should procurement teams expect when deploying enterprise-scale wearable sensor programs?
Enterprise deployments typically run USD 120–180 per employee annually, covering hardware, cloud analytics subscriptions, and device management. Battery replacement and adhesive consumables add 15–20% on top of initial device costs [5].
Which sensor fusion architectures deliver the highest diagnostic reliability in multi-parameter wearables?
Tightly coupled IMU-plus-PPG fusion using Kalman filtering outperforms loosely coupled designs by reducing motion-artifact error rates by up to 40%. Hardware-level synchronization between sensing elements is critical for clinical-grade output [12].
How are intellectual property licensing dynamics shaping component pricing in the Wearable Sensors Market?
Cross-licensing between major MEMS patent holders keeps royalty burdens at 3–5% of component ASPs. Smaller entrants without portfolio depth face higher licensing friction, which sustains incumbent pricing advantages [3].
What cybersecurity frameworks are most relevant for wearable health data protection in the Wearable Sensors Market?
NIST SP 800-183 and IEC 62443 provide the most applicable guidance. Device manufacturers increasingly adopt hardware-root-of-trust architectures to secure sensor-to-cloud data paths against interception [9].
How does sensor substrate material choice affect long-term wearability and signal quality in the Wearable Sensors Market?
Polyimide substrates offer superior thermal stability but are stiffer than TPU-based alternatives. Skin-conformal TPU designs improve signal-to-noise ratios during movement at the cost of reduced high-temperature processing compatibility [11].
What reimbursement hurdles remain for wearable sensor data acceptance by private payers outside the Wearable Sensors Market's core Medicare segment?
Private payers still lack standardized CPT codes for most non-cardiac wearable endpoints. Clinical-evidence dossiers demonstrating reduced 30-day readmission rates remain the most effective lever for securing coverage decisions [1].    
What is the current size of the wearable sensors market?
The wearable sensors market reached USD 5.25 billion in 2025 and is projected to reach USD 26.34 billion by 2035.
What is the CAGR of the wearable sensors market?
The wearable sensors market is projected to grow at a CAGR of 17.50% during the forecast period 2026–2035.
Which region leads the wearable sensors market?
North America holds the largest share at 35.1%, while Asia-Pacific is the fastest-growing region at 19.40% CAGR.
What is driving growth in the wearable sensors market?
Growth in the wearable sensors market is primarily driven by remote patient monitoring reimbursement expansion, MEMS cost reduction and miniaturization, and the rollout of 5G and next-generation connectivity.
Author
Author
Author Profile
Nidhi Mandole LinkedIn
Senior Research Analyst
She is an extremely curious individual currently working in Healthcare and Medical Devices Domain. Nidhi is comfortably versed in data centric research backed by healthcare educational background. She leverages extensive data mining and analytics tools such as Primary and Secondary Research, Statistical Analysis, Machine Learning, Data Modelling. Her key role also involves Technical Sales Support, Client Interaction and Project management within the Healthcare team. Lastly, she showcases extensive affinity towards learning new skills and remain fascinated in implementing them.
Co-Author
Co-Author Profile
Rahul Gotadki LinkedIn
Research Manager
He holds an experience of about 9+ years in Market Research and Business Consulting, working under the spectrum of Life Sciences and Healthcare domains. Rahul conceptualizes and implements a scalable business strategy and provides strategic leadership to the clients. His expertise lies in market estimation, competitive intelligence, pipeline analysis, customer assessment, etc.

Research Approach


Secondary Research

The secondary research process involved comprehensive analysis of regulatory databases, IEEE standards repositories, peer-reviewed engineering journals, clinical publications, and authoritative technology and health organizations. Key sources included the US Food & Drug Administration (FDA) Center for Devices and Radiological Health, European Medicines Agency (EMA) Medical Device Coordination Group, Institute of Electrical and Electronics Engineers (IEEE) Standards Association, Consumer Technology Association (CTA), International Organization for Standardization (ISO) technical committees for medical devices (ISO/TC 215), National Institute of Standards and Technology (NIST), Healthcare Information and Management Systems Society (HIMSS), International Data Corporation (IDC) Worldwide Quarterly Wearable Device Tracker, Counterpoint Research Global Smartwatch Market Monitor, World Health Organization (WHO) Digital Health Atlas, Centers for Disease Control and Prevention (CDC) National Center for Health Statistics, National Institutes of Health (NIH) National Library of Medicine (PubMed/MEDLINE), GSMA Intelligence for connectivity standards, Occupational Safety and Health Administration (OSHA) for industrial wearable guidelines, and national statistical offices from key markets including Eurostat, Japan's Ministry of Economy Trade and Industry (METI), and China's National Bureau of Statistics. These sources were utilized to collect device shipment statistics, regulatory classification data (Class I/II medical wearables), clinical validation studies for biometric accuracy, patent filings for sensor miniaturization technologies, and market landscape analysis for accelerometers, gyroscopes, magnetometers, optical heart rate sensors, galvanic skin response sensors, and temperature sensors.


Primary Research

To gather both qualitative and quantitative insights, supply-side and demand-side stakeholders were interviewed during the primary research phase. CTOs, VPs of Hardware Engineering, heads of Sensor R&D, regulatory affairs managers, and product strategy directors from wearable device OEMs, semiconductor foundries, health analytics platform providers, and MEMS sensor makers were among the supply-side sources. Demand-side sources included procurement leads from military defense contractors, wellness program directors from corporate health insurance companies, performance directors from professional sports organizations, occupational health & safety managers from manufacturing companies, and chief medical informatics officers from health systems that used remote patient monitoring. Primary research established firmware development schedules, validated market segmentation across sensor modalities, and collected information on business adoption patterns for industrial wearables, reimbursement codes for remote therapeutic monitoring (RTM), and clinical accuracy criteria.

Primary Respondent Breakdown:

By Designation: C-level Primaries (32%), Director Level (31%), Others (37%)

By Region: North America (32%), Europe (30%), Asia-Pacific (28%), Rest of World (10%)


Market Size Estimation

Global market valuation was derived through revenue mapping and unit shipment analysis. The methodology included:

Identification of 60+ key sensor manufacturers and wearable device OEMs across North America, Europe, Asia-Pacific, and Latin America

Product mapping across inertial measurement units (IMUs), optical biometric sensors, environmental gas/UV sensors, pressure sensors, and force-sensitive resistor technologies

Analysis of reported and modeled annual revenues specific to wearable sensor portfolios and integrated device bill-of-materials (BOM)

Coverage of manufacturers representing 75-80% of global market share in 2024

Extrapolation using bottom-up (unit shipment volume × average selling price by sensor type and region) and top-down (manufacturer revenue validation and supply chain bill-of-materials analysis) approaches to derive segment-specific valuations for hardware components, firmware/software platforms, and associated professional services

Download Free Sample

Kindly complete the form below to receive a free sample of this Report

Download PDF ×

We do not share your information with anyone. However, we may send you emails based on your report interest from time to time. You may contact us at any time to opt-out.
















