Yoga Clothing Market (2026 - 2035)

Yoga Clothing Market Size, Share, Industry Trend & Analysis Research Report: By Product Type (Tops, Bottoms, One-Piece and Sets, Accessories), By End User (Male, Female), By Category (Mass, Premium), By Distribution Channel (Offline Retail Stores, Online Retail Stores), By Geography (North America, Europe, Asia-Pacific, South America, Middle East and Africa) - Forecast to 2035

Forecast Period
2026-2035
CAGR
8.70%
2025 Market Size
USD 30.18 Billion
2035 Market Size
USD 69.29 Billion
Consumer and Retail ● Updated August 25, 2026 Report ID: MRFR/CG/10974-HCR | Pages: 128 | Author: Snehal Singh

Yoga Clothing Market Summary

The Yoga Clothing Market reached USD 30.18 Billion in 2025 and opens the forecast window at USD 32.71 Billion in 2026, climbing to USD 69.29 Billion by 2035 at an 8.70% CAGR. Two catalysts anchor that trajectory. India's Ministry of AYUSH expanded its national yoga promotion outlay across 2023–24, seeding studio infrastructure in tier-2 cities [14], while the EU Strategy for Sustainable and Circular Textiles pushed durability and fibre-content rules that reward technical apparel over commodity basics [6].

Manufacturing has shifted underneath the category. Commodity cotton jersey and single-knit polyester blends are giving way to engineered four-way-stretch constructions, seamless circular knitting, and recycled nylon yarns that hold shape through hundreds of wash cycles. Textile Exchange reports recycled polyester now accounts for roughly 14% of global polyester supply, and activewear absorbs a disproportionate share of it [4]. Brands have committed nine-figure capital programs to re-tool knitting capacity in Vietnam, Sri Lanka, and Cambodia.

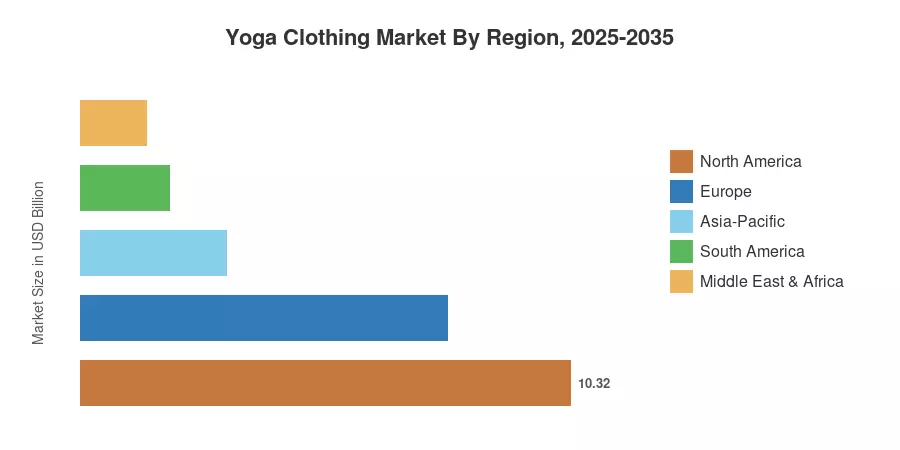
Regionally, North America holds 34.2% of the Yoga Clothing Market on the strength of established studio culture and premium direct-to-consumer penetration. Asia-Pacific grows fastest at a 10.19% CAGR through 2035, powered by China and India. Europe sits second at USD 7.73 Billion in 2025, where regulatory pressure on fibre claims is quietly restructuring supplier lists. The next decade rewards brands that pair material credibility with community ownership.


Key Report Takeaways

• By Product Type

  • Bottoms commanded 44.2% of the Yoga Clothing Market share in 2025, led by high-rise leggings and compression tights
  • Tops are set to expand at a 9.49% CAGR through 2035 as layering and bra-top hybrids gain shelf space.
  • Accessories contributed USD 2.38 Billion in 2025, spanning mats, straps, and carry systems.

• By End User and Category

  • Female consumers held a 62.9% share of the Yoga Clothing Market in 2025
  • The male segment advances at a 9.37% CAGR, the fastest end-user trajectory in the study
  • Premium is projected to grow at a 9.68% CAGR as price ceilings rise in mature channels

• By Region

  • North America generated USD 10.32 Billion in 2025
  • Asia-Pacific records a 10.19% CAGR over 2026–2035
  • Europe accounts for 25.6% of global value


Market Size and Forecast (2021–2035)

Estimates blend company-reported segment revenue, customs-level trade flows, retail point-of-sale panels, and primary interviews with sourcing directors across five manufacturing hubs. Historical values were reconciled against apparel trade statistics [25] and audited brand filings [9][10][11]. Forecast values apply channel-weighted growth to the 2025 base.
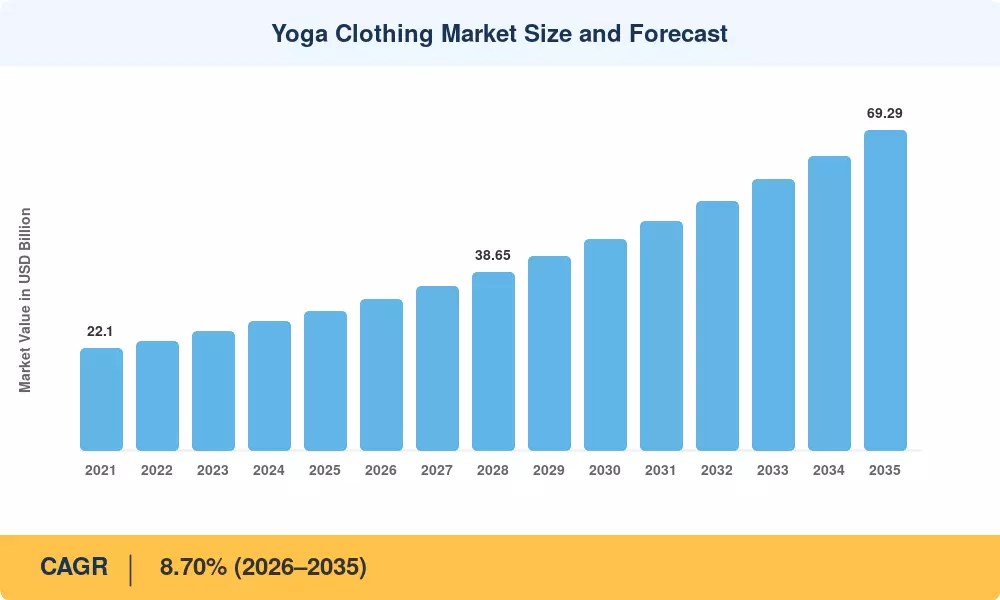
Yoga Clothing Market Size and Forecast
Our Impact
Enabled $4.3B Revenue Impact for Fortune 500 and Leading Multinationals
Partnering with 2000+ Global Organizations Each Year
30K+ Citations by Top-Tier Firms in the Industry

Driver Impact Analysis

Driver ~% Impact on CAGR Geographic Relevance Impact Timeline
Rising yoga and wellness participation 2.1 Global Medium-term (2–4 yr)
Athleisure crossover into daily wardrobes 1.8 North America, Europe Short-term (≤2 yr)
E-commerce and direct-to-consumer expansion 1.5 Asia-Pacific Short-term (≤2 yr)
Engineered stretch and moisture management 1.2 Global Medium-term (2–4 yr)
Female workforce participation and wellness spend 1.0 Asia-Pacific, MEA Long-term (≥4 yr)
Social commerce and creator marketing 0.8 Global Short-term (≤2 yr)
Men's activewear adoption 0.7 North America, Asia-Pacific Long-term (≥4 yr)


Wellness Participation Widens the Buyer Base

Yoga Alliance's national study counted roughly 34 million US practitioners, with 28% having started within the prior three years [1]. That inflow matters commercially because new practitioners buy full kits rather than replacement items. The Global Wellness Institute values the physical activity economy at USD 976 billion, and apparel captures a durable slice of that spend [3]. Growth is broadening geographically as well.

Everyday Wear Extends Garment Utility

Retail panel data show activewear worn outside exercise contexts on roughly 61% of wear occasions in the United States [17][24]. Consumers replace such garments faster, lifting units per household. Brands responded with softer handfeel constructions and muted colorways engineered for street wear rather than studio visibility. This blurring lifts average category frequency without requiring higher fitness participation.

Digital Channels Compress Distance to Consumer

Online penetration in sportswear crossed 32% globally in 2025, and yoga-focused assortments over-index because fit expectations are shaped by community reviews [19]. Direct channels also let brands hold full price longer. Lululemon's filings show direct-to-consumer at roughly 46% of total revenue, evidence of how far the channel shift has travelled [9].

Material Engineering Justifies Premium Pricing

Recycled and bio-based inputs now anchor product storytelling. Textile Exchange records recycled polyester at approximately 14% of global polyester volume, with activewear a leading adopter [4]. Paired with nylon-elastane blends offering 300%-plus elongation recovery, these constructions support price points 40–70% above commodity equivalents.


Restraints Impact Analysis

Restraint ~% Impact on CAGR Geographic Relevance Impact Timeline
Petrochemical feedstock price volatility −0.9 Global Short-term (≤2 yr)
Counterfeit and low-cost imitation products −0.7 Asia-Pacific Medium-term (2–4 yr)
Greenwashing and PFAS regulatory scrutiny −0.6 Europe, North America Medium-term (2–4 yr)
Category saturation and markdown pressure −0.5 North America Short-term (≤2 yr)
Elevated online return rates −0.4 Global Long-term (≥4 yr)


Input Costs Track Oil, Not Fashion

Elastane and polyester pricing follows petrochemical cycles, and OECD producer price indices recorded double-digit swings in synthetic fibre inputs during 2022–2024 [16]. Brands holding six-month sourcing calendars absorb that volatility in margin rather than passing it through. Smaller labels without hedging capacity suffer most.

Regulation Raises the Cost of a Claim

California's AB 1817 bans intentionally added PFAS in textiles, forcing reformulation of durable water-repellent finishes [23]. The EU Green Claims framework adds substantiation obligations for terms like recycled or climate-neutral [7], while the FTC's Green Guides review signals parallel US enforcement [8]. Compliance testing adds cost per style and slows launch cadence.

Imitation Erodes Design Differentiation

Silhouettes hit the copies one season; marketplace dealers knock off signature waistbands for a third of the price. Trade statistics reveal an increase in low-unit-value knitwear flows to Southeast Asian and Gulf markets [25]. Design is not the shield for margin; the community of a brand is.


Yoga Clothing Market Opportunities

Men's Whitespace Remains Underbuilt

Male practitioners form a growing minority of studio attendance yet receive a fraction of assortment depth. The male sector is rising at a 9.37% CAGR; dedicated fit blocks and shorts-liner engineering deliver disproportionate return. Early movers have few shelf competitors.


Emerging-Market Premiumization

The female labor force [15] is also growing in India, Indonesia, Vietnam and the Gulf regions, where discretionary wellness expenditure is increasing. Local fit grading and modest coverage ranges address a need that is not present now in global size runs. Domestic manufacturing proximity also reduces landing cost.


Resale and Circular Business Models

Take-back schemes turn one-time customers into repeaters and provide second-margin revenue on reconditioned items. Such programs are becoming more and more anticipated rather than voluntary, as circularity policy under the EU textiles strategy suggests [6][18]. The economics work on garment-level identifiers.


Membership Data as a Revenue Layer

First-party behavioral data from class bookings, app-based coaching and loyalty tiers help with assortment planning. Subscription revenue is driven independent of unit sales. Brands that monetize this layer report significantly greater repeat rates.


Retail Experience and Studio Partnerships

Co-located studio-retail formats convert practice sessions into fitting sessions. Partnership models spread fixed occupancy cost while delivering qualified footfall, particularly effective in tier-2 Asian cities where standalone flagships remain unprofitable.


Yoga Clothing Market Future Outlook

Fit Intelligence and Demand Planning

Machine-learning size recommendation cuts return rates by 15–25% in apparel deployments, directly improving contribution margin in a channel where online now exceeds 32% of sportswear sales [19]. Expect body-scan integration to move from novelty to standard by 2028, with proprietary fit databases becoming a defensible asset.

Platform Economics Replace Wholesale Logic

Membership tiers, class access, and resale marketplaces convert transactional buyers into recurring participants. Brands with direct-to-consumer above 40% of revenue already demonstrate the margin advantage [9][13]. The decade ahead separates community operators from product vendors.

The Material Transition Accelerates

Bio-based elastane alternatives and mechanically recycled nylon approach cost parity as capacity scales. Textile Exchange projects preferred fibre adoption continuing to climb through 2030 [4], and sustainable textile materials are becoming a procurement requirement rather than a marketing differentiator.

Traceability Becomes Infrastructure

Digital Product Passport requirements under EU rules will demand garment-level fibre and origin data [6][18]. Systems built for compliance also enable resale authentication and warranty servicing — turning a regulatory cost into an operating capability.


Yoga Clothing Market Segmentation

By Product Type

Product architecture in the Yoga Clothing Market remains bottoms-led, though top-half assortments are closing the gap.

Segment Metric Primary Demand Driver
Bottoms 44.2% share (2025) Leggings as everyday wardrobe staple
Tops 9.49% CAGR (2026–2035) Bra-top hybrids, layering pieces
One-Piece and Sets USD 4.95 Billion (2025) Coordinated-set purchasing behaviour
Accessories 7.9% share (2025) Mats, straps, carry systems


Bottoms dominate because fit tolerance is narrowest there — practitioners pay premiums for waistbands that stay put through inversions and fabrics that pass opacity testing under stretch [24]. Tops grow faster from a smaller base as the built-in-support category matures, replacing separate bra-and-tee combinations with single engineered garments.

By End User

Gender mix within the Yoga Clothing Market is shifting, slowly but measurably.

Segment Metric Primary Demand Driver
Female 62.9% share (2025) Established participation, deeper assortments
Male 9.37% CAGR (2026–2035) Mobility training, athleisure crossover


Female buyers anchor the category and set the innovation agenda, from inclusive size grading to pocket engineering. Male growth arrives through adjacent motivations — recovery, mobility, and general fitness — which favours shorts, joggers, and looser tops over studio-specific silhouettes [17].

By Category

Price-tier dynamics separate volume from value across the Yoga Clothing Market.

Segment Metric Primary Demand Driver
Mass 65.4% share (2025) Accessibility, entry-level practitioners
Premium 9.68% CAGR (2026–2035) Material performance, brand community


Mass holds volume through supermarket and value-retail distribution, particularly across Asia-Pacific and South America. Premium grows faster because its buyers replace garments on performance grounds rather than price, and because athleisure apparel purchased at premium tiers sees higher wear frequency, shortening replacement cycles [5].

By Distribution Channel

Segment Metric Primary Demand Driver
Offline Retail Stores 58.8% share (2025) Fit trial, studio-adjacent retail
Online Retail Stores 9.92% CAGR (2026–2035) Direct-to-consumer margin, review-driven fit confidence


Offline retail locations continue to be the most compelling distribution route due to consumer preference for actual product touch, quick availability, and retail engagements next to studios. Online retail outlets are the fastest-growing distribution channel driven by the burgeoning direct-to-consumer digital ecosystems, e-commerce ease and powerful review-driven purchase trust.


Regional Market Share Analysis

Region Metric (2025) Primary Investment Themes
North America 34.2% share Premium retail, membership platforms
Europe USD 7.73 Billion Circularity compliance, recycled inputs
Asia-Pacific 10.19% CAGR (2026–2035) Studio build-out, social commerce
South America 6.2% share Local manufacturing, mass-tier growth
Middle East & Africa USD 1.39 Billion Modest-fit ranges, mall retail
Total USD 30.18 Billion

Regional performance in the Yoga Clothing Market diverges by channel maturity rather than by participation rates alone. North America leads on value; Asia-Pacific leads on momentum. Europe converts regulatory pressure into a supplier-quality advantage, while South America and the Middle East build from small but rapidly formalizing retail bases across the Yoga Clothing Market.


North America

Country Metric Key Driver
US 82.4% of region Dense studio network, premium pricing
Canada USD 1.24 Billion Home-brand strength, urban concentration
Mexico 9.9% CAGR Mall-based activewear expansion


Saturation is real in coastal US metros, where markdown cadence quickened through 2024 [17]. Brands responded by shifting investment from new doors to membership economics and resale pilots. Canada's market punches above population weight given the category's Vancouver origins [9]. Mexico now anchors regional nearshoring, with knitting capacity added in Puebla and Guanajuato.

Europe

Country Metric Key Driver
Germany 21.8% of region Sustainability-led purchasing
UK USD 1.61 Billion Boutique studio density
France 14.2% of region Premium department-store channel
Italy 10.5% of region Domestic technical knitting base
Spain 9.31% CAGR Fast-fashion crossover assortments
Nordic Countries 8.4% of region High per-capita wellness spend
Russia 5.1% of region Domestic brand substitution
Rest of Europe 9.9% of region Central European retail formalization


Compliance is the defining European variable. The EU textiles strategy sets durability and recycled-content expectations that reshape supplier qualification long before enforcement deadlines arrive [6]. German retailers now request chain-of-custody documentation at listing stage. Italy's Prato and Biella clusters convert that requirement into a competitive asset, supplying certified technical knits regionally.

Asia-Pacific

Country Metric Key Driver
China 34.8% of region Domestic brand scale, live commerce
India 11.4% CAGR Government yoga promotion, tier-2 studios
Japan USD 1.28 Billion Aging-population mobility practice
South Korea 9.7% of region Athleisure-forward street styling
ASEAN 13.6% of region Urban middle-class formation
Rest of Asia-Pacific 7.2% of region Australia and New Zealand studio culture


India's policy support runs deeper than symbolism. AYUSH programming funded instructor certification and public practice infrastructure through 2023–24, expanding participation outside metro centres [14]. China's growth is channel-driven, with domestic players converting livestream reach into repeat purchase [21]. Japan skews older, favouring higher-coverage cuts and gentler compression than Western assortments assume.

South America

Country Metric Key Driver
Brazil 61.3% of region Established fitness apparel manufacturing
Argentina USD 0.29 Billion Urban studio growth despite FX pressure
Rest of South America 9.8% CAGR Chile and Colombia retail entry


Brazil's domestic activewear industry gives the region unusual supply independence, with São Paulo knitters serving both local demand and export orders [25]. Currency volatility keeps imported premium ranges niche. Argentina's practitioners skew young and urban, purchasing through social channels that bypass traditional retail entirely.

Middle East & Africa

Country Metric Key Driver
Saudi Arabia 29.6% of region Vision 2030 sports participation targets
UAE USD 0.41 Billion Expatriate studio density, mall retail
South Africa 17.2% of region Established boutique fitness sector
Egypt 10.42% CAGR Young urban population, local manufacturing
Rest of MEA 14.1% of region Gulf and North African expansion


Saudi Arabia's national sports participation targets pushed female fitness registration sharply higher, creating a first-generation buyer cohort with no incumbent brand loyalty [3]. Modest-coverage ranges — longer tops, full-length bottoms — outperform standard global assortments. Egypt combines domestic cotton and knitting capacity with a young urban base, positioning it as both a consumption and supply node.


Yoga Clothing Market By Region, 2025-2035

Competitive Benchmarking

Concentration in the Yoga Clothing Market sits in moderate territory, with an estimated HHI near 620 and top-five participants holding roughly 33–38% of global value. That structure leaves room for specialist labels to scale rapidly, which is precisely what happened between 2021 and 2025. Barriers rest on community and fit reputation rather than manufacturing scale.

Company Est. Revenue Share Range Key Offerings for Yoga Clothing Market Strategic Positioning
Lululemon Athletica ~9–12% Signature leggings, technical tops, studio ranges Category-defining premium brand, DTC-led [9]
NIKE, Inc. ~8–11% Performance tights, bra-tops, training ranges Scale distribution, athlete marketing [10]
adidas AG ~6–9% Studio collections, recycled-content ranges Sustainability positioning, global wholesale [11]
Under Armour ~3–5% Compression bottoms, moisture-managed tops Performance-first, value-premium bridge [12]
Gap Inc. (Athleta) ~3–5% Inclusive-size studio apparel Women-led design, mall and digital reach [13]
PUMA SE ~2–4% Training and studio crossover pieces Style-forward, price-accessible [22]
Alo Yoga ~2–4% Premium studio sets, lifestyle layers Creator-driven, experiential retail
Fabletics ~2–3% Subscription-based activewear Membership economics, high-frequency drops
Beyond Yoga ~1–3% Soft-handfeel ranges, extended sizing Comfort-led premium, inclusive fit
ANTA Sports ~1–3% Domestic studio and training lines China channel depth, price-tier breadth [21]


Recent News & Developments

  • Lululemon Athletica (March 2024): Expanded its resale program across additional US states, converting returned inventory into a second-margin revenue stream and signalling circularity as mainstream retail practice [9]
  • European Commission (June 2024): Advanced Green Claims Directive negotiations, tightening substantiation requirements for recycled-content and carbon-neutral apparel labelling [7]
  • adidas AG (September 2024): Announced expanded recycled polyester sourcing commitments across training categories, raising supplier qualification thresholds industry-wide [11]
  • ANTA Sports (November 2024): Scaled studio-focused assortments across tier-2 and tier-3 Chinese cities, intensifying domestic competition against international premium brands [21]
  • Government of India, Ministry of AYUSH (June 2024): Ran expanded International Day of Yoga programming with state-level participation targets, lifting first-time practitioner counts and entry-level apparel demand [14]
  • Gap Inc. / Athleta (February 2025): Refreshed inclusive size architecture across core studio ranges, addressing an assortment gap flagged repeatedly in retail panel data [13][17]
  • California Attorney General's Office (April 2025): Began enforcement outreach on AB 1817 PFAS textile provisions, prompting reformulation of water-repellent finishes across activewear lines [23]
  • Alo Yoga (August 2025): Opened additional studio-retail hybrid locations in Gulf and Southeast Asian markets, testing experiential formats outside North America


Yoga Clothing Market Report Scope

Parameter Detail
Market Scope Global yoga apparel across tops, bottoms, one-piece and sets, and accessories, sold via offline and online channels
Study Period 2021–2035 (Historical 2021–2024; Base Year 2025; Forecast 2026–2035)
CAGR 8.70% (2026–2035)
Market Size Checkpoints USD 30.18 Billion (2025); USD 32.71 Billion (2026); USD 69.29 Billion (2035)
Fastest Growing Segments Tops (9.49% CAGR); Male end user (9.37% CAGR); Premium category (9.68% CAGR); Online retail stores (9.92% CAGR)
Companies Profiled 10 leading participants in the Yoga Clothing Market, benchmarked by revenue share range and strategic positioning
Valuation Currency USD Billion

FAQs

What procurement criteria should retail buyers apply when sourcing for the Yoga Clothing Market?
Prioritize documented shrinkage, opacity, and pilling test results over swatch aesthetics, then verify supplier PFAS-free declarations. Confirm size-run depth early, since inclusive grading drives repeat purchase more reliably than seasonal colorways. [Ref 8]
How do fabric certifications affect brand eligibility in European retail channels?
OEKO-TEX Standard 100 and Global Recycled Standard documentation are now effectively table stakes for European department-store listings. Without chain-of-custody records, brands face delisting risk under tightening green-claims enforcement. [Ref 6, 7]
Which competitive moats matter most in the Yoga Clothing Market beyond price?
Community infrastructure and fit reputation outlast fabric innovations, which competitors replicate within two seasons. Brands owning studio relationships and app-based loyalty retain pricing power; those competing on stretch alone compress margin fast. [Ref 9]
What gross margin ranges are typical across mass and premium yoga apparel lines?
Mass-tier lines generally clear 42–48% gross margin, while premium and direct-to-consumer labels reach 55–62%. That gap narrows sharply once markdown cadence exceeds two clearance events per season. [Ref 9, 13]
How should investors evaluate new entrants in the Yoga Clothing Market?
Assess repeat-purchase rate and contribution margin per customer rather than headline revenue growth. Entrants scaling through paid acquisition alone rarely sustain unit economics past their third year. [Ref 5]
What integration challenges arise when brands launch resale programs?
Resale requires garment-level identifiers, refurbishment logistics, and revised warranty policy — all of which most brands underestimate. Legacy inventory systems rarely track individual units, so pilots typically run on separate platforms for two to three years. [Ref 18]
Which emerging use cases are expanding demand beyond studio practice?
Pre-natal practice, mobility training for older adults, and corporate wellness programs now generate meaningful volume. These cohorts favour higher-coverage cuts and gentler compression than studio-focused ranges provide. [Ref 2, 3]      
Author
Author
Author Profile
Snehal Singh LinkedIn
Manager - Research
High acumen in analyzing complex macro & micro markets with more than 6 years of work experience in the field of market research. By implementing her analytical skills in forecasting and estimation into market research reports, she has expertise in Packaging, Construction, and Equipment domains. She handles a team size of 20-25 resources and ensures smooth running of the projects, associated marketing activities, and client servicing.
Share::
Request Free Sample

Research Approach


Secondary Research

The secondary research process involved comprehensive analysis of industry databases, market intelligence platforms, peer-reviewed journals, and authoritative industry organizations. Key sources included:

Government & Regulatory Bodies:

US Bureau of Labor Statistics (BLS) – Consumer Expenditure Surveys

US Census Bureau – Retail Trade and E-commerce Data

UK Office for National Statistics (ONS) – Retail Sales Index

EU Eurostat – Textile and Clothing Industry Statistics

Statistics Canada – Retail Trade Survey

Australian Bureau of Statistics (ABS) – Retail Industry Data

Industry Associations & Trade Organizations:

International Health, Racquet & Sportsclub Association (IHRSA)

Sports & Fitness Industry Association (SFIA)

Yoga Alliance – Annual Yoga in America Study

European Health & Fitness Association (EHFA)

American Apparel & Footwear Association (AAFA)

World Federation of the Sporting Goods Industry (WFSGI)

Outdoor Industry Association (OIA)

Market Intelligence & Research Firms:

NPD Group / Circana – Sports Apparel Tracking

Euromonitor International – Sportswear Market Data

Grand View Research – Activewear Industry Reports

Statista – Fitness & Sportswear Statistics

McKinsey & Company – State of Fashion Reports

Bain & Company – Global Luxury & Apparel Studies

Academic & Wellness Research:

National Center for Biotechnology Information (NCBI) – Studies on physical activity trends

Harvard Health Publishing – Fitness and wellness research

International Journal of Yoga Therapy

Journal of Physical Activity and Health

Corporate & Financial Data:

Securities and Exchange Commission (SEC) Filings (10-K, 10-Q reports)

Companies House UK – Annual Financial Reports

National Stock Exchanges – Investor Presentations

S&P Global Market Intelligence

These sources were utilized to collect market sizing data, consumer spending patterns, retail channel performance, material innovation trends, sustainability certifications, import/export statistics, and competitive landscape analysis across yoga tops, yoga pants, shorts, jackets, and accessories segments.


Primary Research

In order to gather both qualitative and quantitative insights, supply-side and demand-side stakeholders were interviewed during the primary research process. CEOs, Chief Marketing Officers, VPs of Product Development, Heads of Sustainability, Supply Chain Directors, and E-commerce Directors from yoga clothing companies, sports wear producers, textile suppliers, and OEM partners were examples of supply-side sources. Boutique yoga studio owners, fitness chain franchise owners, department store procurement managers, retail buyers from specialized athletic goods stores, e-commerce platform merchandising leads, and direct-to-consumer brand managers were examples of demand-side sources. In addition to gathering information on athleisure crossover trends, sustainable fabric adoption rates, pricing architecture, and inventory management strategies, primary research validated market segmentation by product type (tops, pants, shorts, jackets, accessories), material composition (cotton, polyester, nylon, spandex, bamboo), gender categories, and distribution channels (online, offline, specialty stores, department stores).

Primary Respondent Breakdown:

By Designation: C-level Executives (28%), Director Level (32%), Senior Managers & Others (40%)

By Region: North America (32%), Europe (29%), Asia-Pacific (33%), Rest of World (6%)


Market Size Estimation

Global market valuation was derived through revenue mapping and consumption volume analysis. The methodology included:

Identification of 50+ key manufacturers and brands across North America, Europe, Asia-Pacific, Latin America, and Middle East & Africa

Product mapping across yoga tops, yoga pants, yoga shorts, yoga jackets, and yoga accessories segments

Material segmentation analysis covering cotton, polyester, nylon, spandex, bamboo, and recycled synthetic blends

Analysis of reported and modeled annual revenues specific to yoga apparel portfolios, including athleisure crossover categories

Coverage of manufacturers and brands representing 75-80% of global market share in 2024

Extrapolation using bottom-up (unit volume × Average Selling Price by country/region) and top-down (manufacturer revenue validation and retail audit triangulation) approaches

Share::
Request Free Sample
Download Free Sample

Kindly complete the form below to receive a free sample of this Report

* Please use a valid business email

Share::
Request Free Sample
Download PDF ×

We do not share your information with anyone. However, we may send you emails based on your report interest from time to time. You may contact us at any time to opt-out.
















