• Cat-intel
  • MedIntelliX
  • Resources
  • About Us
  • Hero Background
    English
    Chinese
    French
    Japanese
    Korean
    German
    Spanish

    Reduced Sugar food beverage Market Share

    ID: MRFR/F-B & N/9960-CR
    188 Pages
    Tejas Chaudhary
    October 2023

    Reduced Sugar Food & Beverages Market Research Report Information By Type (Bakery & Confectionery, Beverages, Dairy & Desserts, Snacks & Savory, Others), By Consumer Group (Gen X, Gen Z, Millennials, Boomers), By End User (Residential, Commercial), By Distribution Channel (Supermarkets & Hypermarkets, Convenience Stores, Specialty Stores, Online, Others) By Region (North Ame...

    Share:
    Download PDF ×

    We do not share your information with anyone. However, we may send you emails based on your report interest from time to time. You may contact us at any time to opt-out.

    Reduced Sugar food beverage Market Infographic
    $ 4,950.0
    $ 5,950.0
    $ 7,250.0

    Market Share

    Reduced Sugar food beverage Market Share Analysis

    The Reduced Sugar Food and Beverage Market is experiencing a paradigm shift in response to heightened consumer awareness of health and wellness. In this competitive landscape, companies are implementing a variety of market share positioning strategies to cater to the growing demand for reduced sugar products. One pivotal strategy is differentiation, where companies focus on creating innovative and flavorful reduced sugar options that closely mimic the taste and texture of their full-sugar counterparts. This involves leveraging alternative sweeteners, natural flavors, and advanced formulation techniques to provide consumers with healthier alternatives without compromising on sensory experiences. Cost leadership is a significant approach within the Reduced Sugar Food and Beverage Market. Some companies aim to become efficient producers of reduced sugar products, enabling them to offer competitive prices to consumers. This strategy involves optimizing production processes, sourcing alternative sweeteners and ingredients cost-effectively, and achieving economies of scale. By providing affordable yet high-quality reduced sugar options, companies adopting cost leadership strategies can appeal to a broader consumer base, including price-sensitive shoppers looking for healthier alternatives. Niche targeting plays a vital role in market share positioning for reduced sugar products. Instead of catering to the entire food and beverage market, some companies concentrate their efforts on specific niches or product categories. For example, a brand might specialize in producing reduced sugar snacks, targeting health-conscious consumers seeking guilt-free indulgence. By tailoring offerings to niche markets, companies can build brand loyalty within specific consumer segments and establish a strong foothold in those areas of the market. Collaboration and partnerships are increasingly common in the Reduced Sugar Food and Beverage Market as companies seek to enhance their offerings and market reach. Collaborative efforts with ingredient suppliers, research institutions, or retail partners can lead to innovative product development, joint marketing initiatives, and expanded distribution channels. These collaborations enable companies to tap into new markets, leverage shared expertise, and strengthen their market position by offering a diverse range of reduced sugar options. Customer-centric approaches are fundamental in the reduced sugar sector, where understanding and meeting consumer expectations is critical. Successful companies invest in market research to stay abreast of evolving consumer preferences, health trends, and dietary concerns. Whether developing clean-label options, addressing specific dietary needs, or ensuring that reduced sugar products align with varying taste preferences, customer-centric strategies are essential for maintaining a competitive edge in a market driven by health-conscious consumers.

    Market Summary

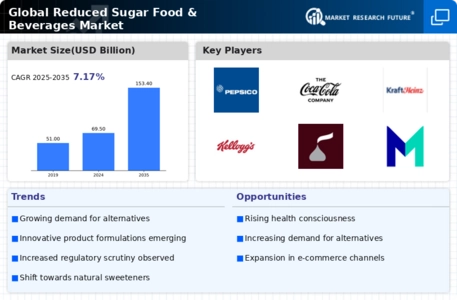
    As per Market Research Future Analysis, the global reduced sugar food and beverages market was valued at USD 58.63 billion in 2021 and is projected to reach USD 124.61 billion by 2032, growing at a CAGR of 7.17% from 2022 to 2032. The market is driven by rising obesity rates and government initiatives promoting reduced sugar consumption. Key segments include beverages, which held a 45.86% market share in 2021, and the bakery and confectionery segment, which is gaining traction due to health-conscious consumer preferences. Major players are innovating with reduced sugar products to meet this demand.

    Key Market Trends & Highlights

    The market is witnessing significant trends driven by health awareness and product innovation.

    • Rising prevalence of obesity: Over 1.9 billion adults were overweight in 2021, with 648 million classified as obese.
    • Beverages segment growth: Projected CAGR of 8.19% during the forecast period.
    • Gen X consumers accounted for 29.46% market share in 2021, with a projected CAGR of 8.60%.
    • Asia-Pacific region expected to grow at the fastest rate of 8.19% CAGR, driven by health-conscious consumption.

    Market Size & Forecast

    2021 Market Size USD 58.63 Billion
    2032 Market Size USD 124.61 Billion
    CAGR 7.17%
    Largest Regional Market Share in 2021 Asia-Pacific.

    Major Players

    Nestle SA, PepsiCo Inc., Coca Cola, Kraft Heinz, Kellogg Company, The Hershey Company, Conagra Brand, Mars Inc., Unilever, Mondeleze International Inc.

    Market Trends

    Rising Prevalence of Obesity

    Nowadays obesity has been a common disease that occurs when an individual’s weight is higher than what is considered healthy for his/her height. The disease affects children as well as adults, there are various factors that have contributed to excess weight gains such as eating patterns, physical activity levels, and sleep routines apart from these factors’ genetics, social determinants of health, and medication consumed also plays an important role in weight gain. Due to this people are more focused on consuming healthy foods and beverages that are sugar-free which will assist in overcoming obesity and other related diseases.

    For instance, a team from Emmanuela Gakidou of the Institute for Health Metrics and Evaluation at the University of Washington, in January 2022, published that obesity is becoming an increasing concern among the population, as it can also increase the change of numerous health problems, such as blood pressure, stroke, diabetes, and heart disease. At present, the top countries where half of the obesity population resides are the US, China, Russia, Brazil, Mexico, Egypt, Germany, Pakistan, and Indonesia.

    Which US had the highest increase in the prevalence of adult obesity, this is followed by Australia where 28% of men and 30% of women have obesity, and in the UK a quarter of the adult population has obesity.

    Due to this, the World Health Organization (WHO) had launched a campaign to stop increasing obesity by 2025. Also, according to WHO excessive consumption of sugar consumption is a key factor that increases obesity and diabetes. Reducing sugar intake lowers the risk of developing overweight and obesity. In 2021, the World Health Organization (WHO) recorded, a minimum of 1.9 billion adults who are 18 years and above worldwide were overweight, and of these, more than 648 million were obese.

    The key players are also launching products that are reducing sugar and are assisting market growth. For instance, in May 2018, nestle launched an addition to its Milky bar range that contains 30% less sugar compared to ordinary chocolate bars. The product name is Milky bar Wow which contains all-natural ingredients and no sweeteners.

    The increasing consumer demand for healthier food options appears to drive the growth of reduced sugar products, reflecting a broader trend towards wellness and nutritional awareness.

    U.S. Department of Agriculture

    Reduced Sugar food beverage Market Market Drivers

    Regulatory Support

    Government initiatives aimed at reducing sugar intake significantly influence the Global Reduced Sugar Food and Beverages Market Industry. Various countries have implemented regulations and guidelines to limit sugar consumption, particularly among children. For instance, taxes on sugary drinks have been introduced in several nations, encouraging manufacturers to innovate and provide healthier alternatives. This regulatory landscape not only promotes public health but also creates a favorable environment for reduced sugar products. As a result, the market is expected to expand, potentially reaching 153.4 USD Billion by 2035, driven by compliance with these regulations and the growing consumer preference for healthier options.

    Health Consciousness

    The increasing awareness of health and wellness among consumers drives the Global Reduced Sugar Food and Beverages Market Industry. As individuals become more informed about the adverse effects of excessive sugar consumption, they actively seek alternatives that align with healthier lifestyles. This trend is particularly evident in regions like North America and Europe, where consumers are gravitating towards products labeled as low-sugar or sugar-free. The market is projected to reach 69.5 USD Billion in 2024, reflecting a growing demand for reduced sugar options. Brands are responding by reformulating existing products and introducing new ones that cater to this health-conscious demographic.

    Market Growth Projections

    The Global Reduced Sugar Food and Beverages Market Industry is projected to experience robust growth in the coming years. With a market value of 69.5 USD Billion in 2024, it is expected to reach 153.4 USD Billion by 2035. This growth trajectory indicates a compound annual growth rate of 7.46% from 2025 to 2035. Such projections reflect the increasing consumer demand for healthier food and beverage options, driven by health consciousness, regulatory support, and innovative product development. The market's expansion is likely to create opportunities for manufacturers and retailers to capitalize on the growing trend towards reduced sugar consumption.

    Changing Consumer Preferences

    Shifts in consumer preferences towards healthier eating habits are a significant driver of the Global Reduced Sugar Food and Beverages Market Industry. As more individuals prioritize nutrition and wellness, there is a marked decline in the consumption of traditional sugary products. This change is particularly pronounced among younger demographics, who are more inclined to choose reduced sugar options. Brands are responding by reformulating existing products and launching new lines that emphasize lower sugar content. This evolving landscape is expected to propel the market forward, with projections indicating a substantial increase in demand for reduced sugar products in the coming years.

    Innovative Product Development

    Innovation plays a crucial role in shaping the Global Reduced Sugar Food and Beverages Market Industry. Companies are increasingly investing in research and development to create new formulations that maintain taste while reducing sugar content. This includes the use of natural sweeteners and advanced processing techniques that enhance flavor without compromising health benefits. The introduction of innovative products, such as low-sugar snacks and beverages, caters to diverse consumer preferences and dietary needs. This trend is likely to contribute to a compound annual growth rate of 7.46% from 2025 to 2035, as brands strive to meet the evolving demands of health-conscious consumers.

    Increased Availability of Products

    The expansion of distribution channels and increased availability of reduced sugar products significantly impact the Global Reduced Sugar Food and Beverages Market Industry. Retailers are increasingly stocking a variety of low-sugar options, making them more accessible to consumers. This trend is observed in both physical stores and online platforms, where consumers can easily find and purchase reduced sugar alternatives. The growing presence of these products in mainstream retail settings enhances consumer awareness and encourages trial. As a result, the market is poised for growth, with an anticipated increase in sales as more consumers opt for reduced sugar choices.

    Market Segment Insights

    Reduced Sugar Food & Beverages Product Type Insights

    The global reduced sugar food & beverages segmentation, based on product type, bakery & confectionery, beverages, dairy & desserts, snacks & savory, and others. The bakery and confectionery segment of the reduced sugar food and beverage market includes a wide range of products such as cakes, cookies, muffins, pastries, and chocolates that have been formulated with less sugar. As people become more health conscious, they are looking for healthier alternatives to traditional bakery and confectionery products that are typically high in sugar and calories.

    In addition to reducing sugar, some products may also be lower in calories or use healthier ingredients such as whole grains or natural flavors. These products are often made with natural sweeteners such as stevia, erythritol, or monk fruit, which have fewer calories and a lower glycemic index than traditional sugar. One example of reduced sugar bakery products is Sara Lee's Delightful Bread, which contains only 45 calories and no sugar per slice, compared to traditional white bread, which contains up to 3 grams of sugar per slice.

    The beverages segment of the reduced sugar food and beverage market includes carbonated soft drinks, fruit juices, sports drinks, and energy drinks, among others. As people become more aware of the negative effects of high sugar intake on their health, they are turning to reduced sugar alternatives. These products may be sweetened use of artificial sweeteners like aspartame, sucralose, and saccharin has not only reduced the sugar content but also made these drinks more appealing to consumers who are looking for low-calorie options. Thus, the beverages segment accounted for the largest market share.

    Moreover, Reduced sugar dairy and dessert products include ice cream, yogurt, and pudding, among others. These products are becoming increasingly popular as people look for healthier options that are low in sugar but still taste great. Reduced sugar dairy and dessert products are often made with natural sweeteners like honey, agave nectar, and fruit purees in these products have not only reduced the sugar content but also added flavor and nutritional value.

    The global reduced sugar beverage market is expected to experience significant growth in the coming years, driven by increased demand for healthier alternatives to sugary soft drinks. The Beverages segment accounted for the market share of 45.86% in 2021 and is projected to register a CAGR of 8.19% during the forecast period. The reduced sugar dairy and dessert market is expected to continue growing in the coming years, driven by increasing health awareness and the desire for healthier dessert options.

    Reduced sugar food & beverages Consumer Group Insights

    The global reduced sugar food & beverages segmentation, based on consumer group, Gen X, Gen Z, Millennials, and Boomers. Generation X (born between 1965-1980) is a consumer group that has witnessed the rise of high-sugar diets in their lifetime and the negative health effects associated with them. As a result, they tend to be more health-conscious and aware of the importance of maintaining a balanced diet. However, they also prioritize convenience and practicality, making them more likely to opt for packaged reduced sugar food and beverages.

    Gen X tends to prefer options that are easy to consume on-the-go, such as low-sugar granola bars and reduced-sugar yogurt. They are also open to trying new products that offer reduced sugar content without compromising on taste. Additionally, they are more likely to read food labels and choose products that contain natural ingredients. The Gen X segment accounted for the market share of 29.46% in 2021 and is projected to register a CAGR of 8.60% during the forecast period.

    Additionally, Generation Z (born between 1997-2012) is the youngest consumer group and has grown up in an era of health consciousness and social media influence. This generation is more aware of health issues, including obesity and diabetes, and has a strong interest in natural and organic food products. They are also known to prioritize reduced sugar options that are marketed as healthier alternatives to traditional high-sugar products. Gen Z tends to prefer reduced sugar alternatives that offer unique flavors and packaging, such as flavored sparkling water and low-sugar snack bars.

    They are also more likely to choose products that contain natural sweeteners, such as stevia or honey, over artificial sweeteners. Additionally, they are more willing to experiment with plant-based or vegan options that offer reduced sugar content. The Gen Z segment accounted for the market share of 20.86% in 2021 and is projected to register a CAGR of 6.90% during the forecast period. However, Millennials (born between 1981-1996) are more health-conscious than previous generations and tend to be more open to trying new and innovative products.

    They are the most diverse and multicultural generation and are more inclined to try food products from different cultures. Millennials also tend to indulge in treats and sweets but are conscious of their sugar intake and seek out reduced sugar options.

    Reduced sugar food & beverages End User Insights

    The global reduced sugar food & beverages data has been bifurcated by end user into residential and commercial. The residential segment includes households and individual consumers who purchase reduced sugar food and beverage products for personal consumption. The demand for these products in this segment is also driven by health concerns related to high sugar consumption, as well as changing consumer preferences. The demand for reduced sugar products in the residential segment is also driven by factors such as changing lifestyles, increasing disposable income, and the availability of a wide range of reduced sugar products in supermarkets and online stores.

    The residential segment accounted for the market share of 61.35% in 2021 and is projected to register a CAGR of 7.46% during the forecast period. Whereas, the commercial segment includes food service providers, such as restaurants, cafes, and hotels, as well as manufacturers of reduced sugar food and beverage products. The demand for reduced sugar products in this segment is driven by several factors, including increasing health awareness among consumers, rising obesity rates, and government initiatives to reduce sugar consumption.

    According to research published in the Harvard Gazette by Massachusetts General Hospital (MGH), lowering sugar intake by 20% from packaged foods and 40% from drinks can avoid 2.48 million cardiovascular disease events (such as strokes, heart attacks, and cardiac arrests), 490,000 cardiovascular deaths, and 750,000 diabetes diagnoses in the United States throughout the lifespan of the adult population. This has led to a growing demand for reduced sugar products in the food service industry.

    July 2021: PepsiCo announced its new products with reduced sugar content by 25% in sodas and iced tea in the European region. Through this technology the company aims to catch the attention of health-conscious consumers.

    Figure 3: Global Reduced sugar food & beverages, By End User, 2021 & 2032 (USD Billion)

    Reduced sugar food & beverages Distribution Channel Insights

    The Reduced Sugar Food & Beverages Market has been bifurcated by supermarkets & hypermarkets, convenience stores, specialty stores, online, and others. Supermarkets and hypermarkets are the most popular and widely used distribution channels for reduced sugar food and beverages. The segment includes stores, shops, and other outlets that provide several categories of products where customers can directly buy products. Supermarkets & hypermarkets account for the majority of sales of Reduced sugar food and beverages products. These retail outlets offer a wide range of products and have a large customer base.

    An increasing number of these outlets and other merchandisers are offering more business to reduced sugar food and beverages products. Hypermarkets and supermarkets have been concentrating on providing several categories, such as reduced sugar food and beverages items, put up to attract customers' interest and provide them the ability to pick from a variety of brands before making a purchase. They provide a convenient one-stop shop for consumers, with competitive pricing and promotions, and they offer manufacturers the opportunity to reach a large audience.

    The supermarkets & hypermarkets segment accounted for the market share of 40.01% in 2021 and is projected to register a CAGR of 7.15% during the forecast period.

    Convenience stores are small retail outlets located in high-traffic areas, such as gas stations, train stations, and airports. Convenience stores and neighborhood businesses have traditionally supported families and local communities in significant ways. The Covid-19 epidemic has made local retailers more important to consumers. These stores offer a limited range of products, but they are convenient for consumers who want to make quick purchases. Convenience stores are popular among busy consumers who want to save time and are willing to pay a premium for convenience. Whereas specialty stores are retail outlets that focus on specific products or categories.

    In the reduced sugar food and beverages market, specialty stores focus on products that are health-focused, organic, or locally sourced. These stores offer a unique shopping experience and attract customers who are passionate about a particular product or category. Ease of access to buying, availability of the store, and convenience of shopping have further increased the overall sales of reduced sugar food and beverages products. Specialty stores provide manufacturers with a niche market and the opportunity to develop brand loyalty.

    Get more detailed insights about Reduced Sugar Food and Beverage Market Research Report—Global Forecast till 2032

    Regional Insights

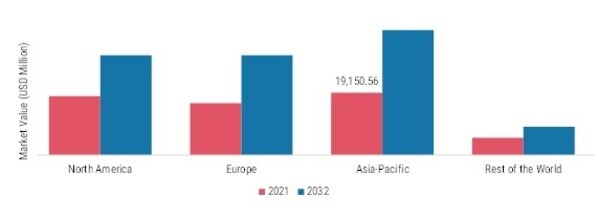
    By Region, the study segments the market into North America, Europe, Asia-Pacific, South America, and Middle East & Africa. Asia Pacific reduced sugar food & beverages accounted for largest market share in 2021 and is expected to exhibit an fastest-growing 8.19% CAGR during the study period. The growth of reduced sugar food & beverages in Asia-Pacific can be attributed to the healthier consumption habits coupled with the wellness awareness among the consumers.

    In North American nations like the U.S. and Canada, reduced sugar in food & beverages has been inclining due to the rising popularity of sugar-free products with reduced sugar. The region's growing population of health-conscious consumers is anticipated to fuel the steady expansion of the sugar business. Further, the major countries studied are: The U.S, Canada, Mexico, Germany, France, UK, Italy, Spain, China, Japan, India, Australia & New Zealand.

    Figure 4: GLOBAL REDUCED SUGAR FOOD & BEVERAGES SHARE BY REGION 2021 (%)

    REDUCED SUGAR FOOD & BEVERAGES SHARE BY REGION 2021

    Source: Secondary Research, Primary Research, Market Research Future Database and Analyst Review

    North America Reduced sugar food & beverages is one of the largest market in the global reduced sugar food and beverages market, with the United States and Canada being the major contributors. In recent years, the region has witnessed a significant shift towards a healthier lifestyle, leading to a rise in demand for reduced sugar products. The region is also witnessing an increase in the number of diabetic patients, which has further boosted the demand for low-sugar products.

    The market is driven by factors such as the rising prevalence of lifestyle diseases, increasing awareness about health and wellness, and the availability of a wide range of products. The US and the Canadian government have also taken initiatives to promote healthier lifestyles, such as imposing a tax on sugary drinks. According to the Centers for Disease Control and Prevention (CDC), over 41.9% of U.S. adults are obese, and over 37 million people have diabetes. This has led to a growing demand for healthier alternatives to traditional sugary products.

    In Canada, the federal government has implemented a number of policies aimed at reducing sugar consumption. Diabetes Canada recommends that Canadians limit their intake of added sugars to no more than 10% of their daily calories.

    Europe is another key market for reduced sugar food and beverages. The market in Europe is more mature than in North America, with many consumers already accustomed to low-sugar products. As a result, manufacturers have had to innovate to meet the growing demand for healthier alternatives.

    In the WHO European Region, over 60% of adults and 29% of boys, and 27% of girls who are youngsters are overweight or obese. This has led to an increase in the incidence of obesity-related diseases such as diabetes and heart disease. The adoption of reduced sugar food and beverages can help to lower the risk of these diseases. The United Kingdom reduced sugar market is one of the largest markets for reduced sugar food and beverages in Europe. The country has one of the highest obesity rates in Europe, with over 63% of adults being overweight or obese.

    This has led to a growing demand for healthier alternatives to traditional sugary products. In response, manufacturers have developed a range of low-sugar and sugar-free products, including soft drinks, confectionery, and baked goods.

    The Asia-Pacific region has become a significant player in the global reduced sugar food and beverage market, and the trend towards healthier consumption habits is continuing to grow. The region is home to some of the world's most populous countries, including China and India, and with an increasing focus on health and wellness, there has been a shift towards healthier food and beverage options. In a recent survey conducted by EY-Parthenon, it was found that 48% of consumers in the Asia-Pacific region are willing to pay more for healthy/” good for me” products.

    The survey also revealed that the top reasons for choosing products were health concerns and weight management. One of the most significant contributors to the growth of the reduced sugar food and beverage market in the Asia-Pacific region is the increasing demand for low-calorie and low-sugar beverages. In China, for example, In a KuRunData study of 1,043 Chinese customers, around 81 percent of those polled indicated they preferred sugar-free drinks to regular ones at the same price point.

    Thus , the Asia Pacific segment accounted for a market share of 32.66% in 2021 and is expected to register a CAGR of 8.19% during the review period.

    Key Players and Competitive Insights

    Major market players are applying a lot of money on R&D to increase their product lines, which will help the reduced sugar food & beverages grow even more. Market applicants are also taking on a range of strategic enterprises to grow their worldwide footprint, including, contractual agreements, new product launches, mergers and acquisitions, increased investments, and collaboration with other organizations. Competitors in the reduced sugar food & beverages industry must offer cost-effective items to expand and survive in an increasingly competitive and rising market environment. Many global, regional, and local vendors characterize the reduced sugar food & beverages market.

    The market is highly competitive, with all the players competing to gain market share. Intense competition, rapid advances in technology, frequent changes in government policies, and environmental regulations are key factors that confront market growth. The market vendors’ growth depends on market conditions, government support, and industry development. Thus, the vendors should focus on expanding geographically and improving services. Nestle SA (US), PepsiCo Inc. (US), Coca Cola (US), Kraft Heinz (US), Kellogg Company (US), The Hershey Company (US), Conagra Brand (US), Mars Inc. (Virginia), Unilever (UK), Mondeleze.

    One of the main business approaches adopted by manufacturers in the global reduced sugar food & beverages industry to benefit clients and expand the reduced sugar food & beverages sector is to manufacture locally to reduce operating costs.

    Key Companies in the Reduced Sugar food beverage Market market include

    Industry Developments

    Prigat introduced a line of new, lower-sugar soft drinks in 2024. "Prigat" introduces new lower-sugar soft drinks with only 19 calories per 100 milliliters (per 100 milliliters) and 40% less sugar in popular flavors including orange, grapefruit, and grape.

    September 2022: Nestle Froneries launched its new Ice Creams bar’s with cutting 70% of sugar. The product produced with the help of resugar cooperation helped the company to encourage the overall sales.

    September 2020: Coca cola Australia announced to launch its non-alcoholic beverages by reducing the sugar by 25%. The company announced around 27 sugar reduced products in the region

    January 2019: Conagra Brand Launched its extensive summer line up of new production of the new food products such as Quick Roasters.

    Future Outlook

    Reduced Sugar food beverage Market Future Outlook

    The Global Reduced Sugar Food & Beverages Market is projected to grow at a 7.46% CAGR from 2024 to 2035, driven by health trends, regulatory support, and consumer demand for healthier options.

    New opportunities lie in:

    • Develop innovative reduced sugar formulations for traditional snacks and desserts.
    • Leverage e-commerce platforms to reach health-conscious consumers directly.
    • Invest in marketing campaigns emphasizing health benefits and natural ingredients.

    By 2035, the market is expected to exhibit robust growth, reflecting evolving consumer preferences and increased health awareness.

    Market Segmentation

    Reduced Sugar Food & Beverages Type Outlook

    • Bakery & Confectionery
    • Beverages
    • Dairy & Desserts
    • Snacks & Savory
    • Others

    Reduced Sugar Food & Beverages End User Outlook

    • Residential
    • Commercials

    Reduced Sugar Food & Beverages Regional Outlook

    • US
    • Canada

    Reduced Sugar Food & Beverages Consumer Group Outlook

    • Gen X
    • Gen Z
    • Millennials
    • Boomers

    Reduced Sugar Food & Beverages Distribution Channel Outlook

    • Supermarkets & Hypermarkets
    • Convenience Stores
    • Specialty Stores
    • Online
    • Others

    Report Scope

    Report Attribute/Metric Details
    Market Size 2021 USD 58.63billion
    Market Size 2032 USD 124.61 billion
    Compound Annual Growth Rate (CAGR) 7.17% (2023-2032)
    Base Year 2022
    Forecast Period 2023-2032
    Forecast Units Value (USD Billion)
    Report Coverage Revenue Forecast, Competitive Landscape, Growth Factors, and Trends
    Segments Covered Product Type, Form, Application, and Region
    Geographies Covered North America, Europe, Asia Pacific, South America, and Middle East & Africa
    Countries Covered The U.S, Canada, Mexico, Germany, France, UK, Italy, Spain, China, Japan, India, Australia, South Korea, Argentina, and Brazil
    Key Companies Profiled Bunge Limited, Nestle SA (US), PepsiCo Inc. (US), Coca Cola (US), Kraft Heinz (US), Kellogg Company (US)
    Key Market Opportunities Rising Prevalence of Obesity
    Key Market Dynamics Governments initiative of reduced sugar consumption

    Market Highlights

    Author

    Tejas Chaudhary
    Research Analyst Level II

    She holds an experience of about 6+ years in market research and business consulting, working under the spectrum of information communication technology, telecommunications and semiconductor domains. aarti conceptualizes and implements a scalable business strategy and provides strategic leadership to the clients. her expertise lies in market estimation, competitive intelligence, pipeline analysis, customer assessment, etc.

    Leave a Comment

    Latest Comments

    John Doe
    john@example.com

    This is a great article! Really helped me understand the topic better.

    Posted on July 23, 2025, 10:15 AM
    Jane Smith
    jane@domain.com

    Thanks for sharing this. I’ve bookmarked it for later reference.

    Posted on July 22, 2025, 7:45 PM

    FAQs

    How much is the reduced sugar food & beverages market accounted?

    The reduced sugar food & beverages market accounted for USD 58.63 billion.

    What is the key driving factor for Reduced sugar food & beverages?

    Rising Prevalence of Obesity

    What is the growth rate of the reduced sugar food & beverages?

    The growth rate of the Reduced sugar food & beverages is 7.17% CAGR.

    Which region held the largest market share in the Reduced sugar food & beverages?

    The Asia Pacific region held the largest market share in the reduced sugar food & beverages.

    Who are the key players in the Reduced sugar food & beverages?

    Bunge Limited, Cosan Limited, Südzucker AG, Jalles Machado S/A, Nestle SA (US), PepsiCo Inc. (US), Coca Cola (US), Kraft Heinz (US), Kellogg Company (US).

    1. Table of Contents
    2. Executive Summary 19
      1. MARKET ATTRACTIVENESS ANALYSIS 21
        1. GLOBAL REDUCED SUGAR FOOD & BEVERAGES MARKET, BY TYPE 22
        2. GLOBAL REDUCED SUGAR FOOD & BEVERAGES MARKET, BY CONSUMER GROUP 23
        3. GLOBAL REDUCED SUGAR FOOD & BEVERAGES MARKET, BY END USER 24
        4. GLOBAL REDUCED SUGAR FOOD & BEVERAGES MARKET, BY DISTRIBUTION CHANNEL 25
        5. GLOBAL REDUCED SUGAR FOOD & BEVERAGES MARKET, BY REGION 26
    3. Market Introduction 27
      1. DEFINITION 27
      2. Scope of the Study 27
      3. RESEARCH OBJECTIVE 28
      4. MARKET STRUCTURE 28
      5. KEY BUYING CRITERIA 29
    4. Research Methodology 30
      1. RESEARCH PROCESS 30
      2. PRIMARY RESEARCH 31
      3. SECONDARY RESEARCH 32
      4. MARKET SIZE ESTIMATION 33
      5. FORECAST MODEL 34
      6. LIST OF ASSUMPTIONS & LIMITATIONS 35
        1. LIST OF ASSUMPTIONS & LIMITATIONS 35
    5. MARKET DYNAMICS 36
      1. INTRODUCTION 36
      2. DRIVERS 37
        1. RISING PREVALENCE OF OBESITY 37
        2. GOVERNMENT''S INITIATIVES ON REDUCED SUGAR CONSUMPTION ACROSS THE GLOBE 38
        3. DRIVER IMPACT ANALYSIS 40
      3. RESTRAINTS 40
        1. CONCERNS REGARDING THE USE OF ARTIFICIAL SWEETENERS IN MEDICAL RESEARCH 40
        2. RESTRAINT IMPACT ANALYSIS 41
      4. OPPORTUNITIES 41
        1. MILLENNIAL POPULATION CREATING GROWTH AVENUES OWING TO INCREASING HEALTH CONCERNS 41
      5. CHALLENGES 42
        1. REDUCED SUGAR DRINKS HAVE BEEN ASSOCIATED WITH DENTAL EROSION 42
    6. MARKET FACTOR ANALYSIS 43
      1. VALUE CHAIN ANALYSIS 43
        1. RAW MATERIAL 44
        2. PROCESSING METHODS 44
        3. PACKAGING 44
      2. SUPPLY CHAIN ANALYSIS 45
        1. RAW MATERIALS SOURCING 45
        2. MANUFACTURING 46
        3. DISTRIBUTION 46
        4. END-USER 46
      3. PORTER''S FIVE FORCES MODEL 47
        1. THREAT OF NEW ENTRANTS 47
        2. BARGAINING POWER OF SUPPLIERS 48
        3. THREAT OF SUBSTITUTES 48
        4. BARGAINING POWER OF BUYERS 48
        5. INTENSITY OF RIVALRY 48
      4. IMPACT OF INFLATION ON REDUCED SUGAR FOOD & BEVERAGE MARKET 49
      5. IMPACT OF UKRAINE WAR ON REDUCED SUGAR MARKET 49
      6. SUSTAINABILITY IN THE REDUCED SUGAR FOOD & BEVERAGE MARKET 50
      7. BIODIVERSITY IN REDUCED SUGAR FOOD & BEVERAGE MARKET 50
      8. CONSUMERS BUYING BEHAVIOUR OF REDUCED SUGAR FOOD & BEVERAGE PRODUCTS 51
      9. COVID-19 IMPACT ANALYSIS 51
        1. IMPACT ON PRODUCTION 51
        2. IMPACT ON SUPPLY CHAIN 52
        3. IMPACT ON PRICING 52
    7. GLOBAL REDUCED SUGAR FOOD AND BEVERAGES MARKET, BY TYPE 53
      1. INTRODUCTION 53
        1. GLOBAL REDUCED SUGAR FOOD AND BEVERAGES MARKET ESTIMATES & FORECAST, BY TYPE,
    8. 2020–2032 54
      1. BAKERY & CONFECTIONERY 55
        1. BAKERY & CONFECTIONERY: MARKET ESTIMATES & FORECAST, BY REGION, 2020-2032 55
      2. BEVERAGES 56
        1. BEVERAGES: MARKET ESTIMATES & FORECAST, BY REGION, 2020-2032 56
      3. DAIRY & DESSERTS 57
        1. DAIRY & DESSERTS: MARKET ESTIMATES & FORECAST, BY REGION, 2020-2032 57
      4. SNACKS & SAVORY 58
        1. SNACKS & SAVORY: MARKET ESTIMATES & FORECAST, BY REGION, 2020-2032 58
      5. OTHERS 59
        1. OTHERS: MARKET ESTIMATES & FORECAST, BY REGION, 2020-2032 59
    9. GLOBAL REDUCED SUGAR FOOD AND BEVERAGE MARKET, BY CONSUMER GROUP 60
      1. INTRODUCTION 60
        1. GLOBAL REDUCED SUGAR FOOD AND BEVERAGES MARKET ESTIMATES & FORECAST, BY CONSUMER
    10. GROUP, 2020–2032 62
      1. GEN X 63
        1. GEN X: MARKET ESTIMATES & FORECAST, BY REGION, 2020-2032 63
      2. GEN Z 64
        1. GEN Z: MARKET ESTIMATES & FORECAST, BY REGION, 2020-2032 64
      3. MILLENNIALS 65
        1. MILLENNIALS: MARKET ESTIMATES & FORECAST, BY REGION, 2020-2032 65
      4. BOOMERS 66
        1. BOOMERS: MARKET ESTIMATES & FORECAST, BY REGION, 2020-2032 66
    11. GLOBAL REDUCED SUGAR FOOD AND BEVERAGE MARKET, BY END USER 67
      1. INTRODUCTION 67
        1. GLOBAL REDUCED SUGAR FOOD AND BEVERAGES MARKET ESTIMATES & FORECAST, BY END USER,
    12. 2020–2032 68
      1. RESIDENTIAL 69
        1. RESIDENTIAL: MARKET ESTIMATES & FORECAST, BY REGION, 2020-2032 69
      2. COMMERCIAL 70
        1. COMMERCIAL: MARKET ESTIMATES & FORECAST, BY REGION, 2020-2032 70
    13. GLOBAL REDUCED SUGAR FOOD AND BEVERAGES MARKET, BY DISTRIBUTION
    14. CHANNEL 71
      1. INTRODUCTION 71
        1. GLOBAL REDUCED SUGAR FOOD AND BEVERAGES MARKET ESTIMATES & FORECAST, BY DISTRIBUTION
    15. CHANNEL, 2020–2032 73
      1. SUPERMARKET AND HYPERMARKET 74
        1. SUPERMARKETS AND HYPERMARKETS: MARKET ESTIMATES & FORECAST, BY REGION, 2020-2032 74
      2. CONVENIENCE STORE 75
        1. CONVENIENCE STORES: MARKET ESTIMATES & FORECAST, BY REGION, 2020-2032 75
      3. SPECIALTY STORES 76
        1. SPECIALTY STORES: MARKET ESTIMATES & FORECAST, BY REGION, 2020-2032 76
      4. ONLINE 77
        1. ONLINE: MARKET ESTIMATES & FORECAST, BY REGION, 2020-2032 77
      5. OTHERS 78
        1. OTHERS: MARKET ESTIMATES & FORECAST, BY REGION, 2020-2032 78
    16. GLOBAL REDUCED SUGAR FOOD AND BEVERAGES MARKET, BY REGION 79
      1. INTRODUCTION 79
        1. GLOBAL REDUCED SUGAR FOOD AND BEVERAGES MARKET ESTIMATES & FORECAST, BY REGION,
    17. 2020–2032 81
      1. NORTH AMERICA 82
        1. US 87
        2. CANADA 90
        3. MEXICO 93
      2. EUROPE 96
        1. GERMANY 101
        2. UK 104
        3. FRANCE 106
        4. SPAIN 109
        5. ITALY 112
        6. POLAND 115
        7. REST OF EUROPE 118
      3. ASIA-PACIFIC 121
        1. CHINA 125
        2. INDIA 128
        3. JAPAN 131
        4. AUSTRALIA & NEW ZEALAND 134
        5. REST OF ASIA-PACIFIC 137
      4. REST OF THE WORLD 140
        1. SOUTH AMERICA 144
        2. MIDDLE EAST 147
        3. AFRICA 150
    18. Competitive Landscape 153
      1. INTRODUCTION 153
        1. MARKET STRATEGY ANALYSIS 153
      2. COMPETITIVE BENCHMARKING 154
        1. INTRODUCTION 154
        2. PRODUCT PORTFOLIO 155
        3. REGIONAL PRESENCE 155
        4. STRATEGIC ALLIANCES 155
        5. INDUSTRY EXPERIENCES 155
      3. KEY DEVELOPMENTS & GROWTH STRATEGIES 155
        1. NEW PRODUCT LAUNCH 155
        2. ACQUISITION 156
    19. COMPANY PROFILES 157
      1. NESTLÉ S.A. 157
        1. COMPANY OVERVIEW 157
        2. FINANCIAL OVERVIEW 158
        3. PRODUCTS OFFERED 159
        4. KEY DEVELOPMENTS 159
        5. SWOT ANALYSIS 160
        6. KEY STRATEGIES 160
      2. PEPSICO, INC 161
        1. COMPANY OVERVIEW 161
        2. FINANCIAL OVERVIEW 162
        3. PRODUCTS OFFERED 162
        4. KEY DEVELOPMENTS 163
        5. SWOT ANALYSIS 164
        6. KEY STRATEGIES 164
      3. COCA COLA 165
        1. COMPANY OVERVIEW 165
        2. FINANCIAL OVERVIEW 165
        3. PRODUCTS OFFERED 166
        4. KEY DEVELOPMENTS 166
        5. SWOT ANALYSIS 167
        6. KEY STRATEGIES 167
      4. KRAFT HEINZ 168
        1. COMPANY OVERVIEW 168
        2. FINANCIAL OVERVIEW 169
        3. PRODUCTS OFFERED 169
        4. KEY DEVELOPMENTS 170
        5. SWOT ANALYSIS 170
        6. KEY STRATEGIES 171
      5. KELLOGG COMPANY 172
        1. COMPANY OVERVIEW 172
        2. FINANCIAL OVERVIEW 173
        3. PRODUCTS OFFERED 174
        4. KEY DEVELOPMENTS 174
        5. SWOT ANALYSIS 175
        6. KEY STRATEGIES 175
      6. THE HERSHEY COMPANY 176
        1. COMPANY OVERVIEW 176
        2. FINANCIAL OVERVIEW 177
        3. PRODUCTS OFFERED 178
        4. KEY DEVELOPMENTS 178
        5. SWOT ANALYSIS 178
        6. KEY STRATEGIES 179
      7. CONAGRA BRANDS 180
        1. COMPANY OVERVIEW 180
        2. FINANCIAL OVERVIEW 181
        3. PRODUCTS OFFERED 181
        4. KEY DEVELOPMENTS 182
        5. KEY STRATEGIES 182
      8. MARS INC. 183
        1. COMPANY OVERVIEW 183
        2. FINANCIAL OVERVIEW 183
        3. PRODUCTS OFFERED 183
        4. KEY DEVELOPMENTS 183
        5. KEY STRATEGIES 184
      9. UNILEVER 185
        1. COMPANY OVERVIEW 185
        2. FINANCIAL OVERVIEW 186
        3. PRODUCTS OFFERED 186
        4. KEY DEVELOPMENTS 187
        5. SWOT ANALYSIS 187
        6. KEY STRATEGIES 187
      10. MONDELEZ INTERNATIONAL INC. 188
        1. COMPANY OVERVIEW 188
        2. FINANCIAL OVERVIEW 189
        3. PRODUCTS OFFERED 189
        4. KEY DEVELOPMENTS 190
        5. KEY STRATEGIES 190
    20. APPENDIX 191
      1. REFERENCES 191
      2. RELATED REPORTS 192

    Reduced Sugar Food & Beverages Market Segmentation

    Reduced Sugar Food & Beverages Type Outlook (USD Billion, 2020-2032)

    • Bakery & Confectionery
    • Beverages
    • Dairy & Desserts
    • Snacks & Savory
    • Others

    Reduced Sugar Food & Beverages Consumer Group Outlook (USD Billion, 2020-2032)

    • Gen X
    • Gen Z
    • Millennials
    • Boomers

    Reduced Sugar Food & Beverages End User Outlook (USD Billion, 2020-2032)

    • Residential
    • Commercial

    Reduced Sugar Food & Beverages Distribution Channel Outlook (USD Billion, 2020-2032)

    • Specialty Stores
    • Convenience Stores
    • Specialty Stores
    • Online
    • Others

    Reduced Sugar Food & Beverages Regional Outlook (USD Billion, 2020-2032)

    • North America Outlook (USD Billion, 2020-2032)
      • North America Reduced Sugar Food & Beverages by Type
        • Bakery & Confectionery
        • Beverages
        • Dairy & Desserts
        • Snacks & Savory
        • Others
      • North America Reduced Sugar Food & Beverages by Type
        • Gen X
        • Gen Z
        • Millennials
        • Boomers
      • North America Reduced Sugar Food & Beverages by End User
        • Residential
        • Commercial
      • North America Reduced Sugar Food & Beverages by Distribution Channel
    • Supermarkets & Hypermarkets
    • Specialty Stores
    • Convenience Stores
    • Online
    • Others


    • US Outlook (USD Billion, 2020-2032)
    • US Reduced Sugar Food & Beverages by Type
      • Bakery & Confectionery
      • Beverages
      • Dairy & Desserts
      • Snacks & Savory
      • Others
    • US Reduced Sugar Food & Beverages by Type
      • Gen X
      • Gen Z
      • Millennials
      • Boomers
      •  
    • US Reduced Sugar Food & Beverages by End User
      • Residential
      • Commercial
    • US Reduced Sugar Food & Beverages by Distribution Channel
    • Supermarkets & Hypermarkets
    • Specialty Stores
    • Convenience Stores
    • Online
    • Others
      • CANADA Outlook (USD Billion, 2020-2032)
      • CANADA Reduced Sugar Food & Beverages by Type
        • Bakery & Confectionery
        • Beverages
        • Dairy & Desserts
        • Snacks & Savory
        • Others
      • Canada North America Reduced Sugar Food & Beverages by Type
        • Gen X
        • Gen Z
        • Millennials
        • Boomers


    • CANADA Reduced Sugar Food & Beverages by End User
      • Residential
      • Commercial
    • CANADA Reduced Sugar Food & Beverages by Distribution Channel
    • Supermarkets & Hypermarkets
    • Specialty Stores
    • Convenience Stores
    • Online
    • Others
    • Europe Outlook (USD Billion, 2020-2032)
      • Europe Reduced Sugar Food & Beverages by Type
        • Bakery & Confectionery
        • Beverages
        • Dairy & Desserts
        • Snacks & Savory
        • Others
      • Europe Reduced Sugar Food & Beverages by Type
        • Gen X
        • Gen Z
        • Millennials
        • Boomers


    • Europe Reduced Sugar Food & Beverages by End User
      • Residential
      • Commercial
    • Europe Reduced Sugar Food & Beverages by Distribution Channel
    • Supermarkets & Hypermarkets
    • Specialty Stores
    • Convenience Stores
    • Online
    • Others
      • Germany Outlook (USD Billion, 2020-2032)
      • Germany Reduced Sugar Food & Beverages by Type
        • Bakery & Confectionery
        • Beverages
        • Dairy & Desserts
        • Snacks & Savory
        • Others
      • Germany Reduced Sugar Food & Beverages by Type
        • Gen X
        • Gen Z
        • Millennials
        • Boomers
      • Germany Reduced Sugar Food & Beverages by End User
        • Residential
        • Commercial
      • Germany Reduced Sugar Food & Beverages by Distribution Channel
    • Supermarkets & Hypermarkets
    • Specialty Stores
    • Convenience Stores
    • Online
    • Others
      • France Outlook (USD Billion, 2020-2032)
      • France Reduced Sugar Food & Beverages by Type
        • Bakery & Confectionery
        • Beverages
        • Dairy & Desserts
        • Snacks & Savory

    France America Reduced Sugar Food & Beverages by Type

    • Gen X
    • Gen Z
    • Millennials
    • Boomers
    • France Reduced Sugar Food & Beverages by End User
      • Residential
      • Commercial
    • France Reduced Sugar Food & Beverages by Distribution Channel
    • Supermarkets & Hypermarkets
    • Specialty Stores
    • Convenience Stores
    • Online
    • Others
      • UK Outlook (USD Billion, 2020-2032)
      • UK Reduced Sugar Food & Beverages by Type
        • Bakery & Confectionery
        • Beverages
        • Dairy & Desserts
        • Snacks & Savory
        • Others
      • UK Reduced Sugar Food & Beverages by Type
        • Gen X
        • Gen Z
        • Millennials
        • Boomers
        •  
      • UK Reduced Sugar Food & Beverages by End User
        • Organic
        • Conventional
      • UK Reduced Sugar Food & Beverages by Distribution Channel
    • Supermarkets & Hypermarkets
    • Specialty Stores
    • Convenience Stores
    • Online
    • Others
      • ITALY Outlook (USD Billion, 2020-2032)
      • ITALY Reduced Sugar Food & Beverages by Type
        • Bakery & Confectionery
        • Beverages
        • Dairy & Desserts
        • Snacks & Savory
        • Others
      • Italy Reduced Sugar Food & Beverages by Consumer Group
        • Gen X
        • Gen Z
        • Millennials
        • Boomers
      • ITALY Reduced Sugar Food & Beverages by End User
        • Residential
        • Commercial
      • ITALY Reduced Sugar Food & Beverages by Distribution Channel
    • Supermarkets & Hypermarkets
    • Specialty Stores
    • Convenience Stores
    • Online
    • Others
      • SPAIN Outlook (USD Billion, 2020-2032)
      • Spain Reduced Sugar Food & Beverages by Type
        • Bakery & Confectionery
        • Beverages
        • Dairy & Desserts
        • Snacks & Savory
        • Others
      • Spain Reduced Sugar Food & Beverages by Consumer Group
        • Gen X
        • Gen Z
        • Millennials
        • Boomers
      • Spain Reduced Sugar Food & Beverages by End User
        • Residential
        • Commercial
      • Spain Reduced Sugar Food & Beverages by Distribution Channel
    • Supermarkets & Hypermarkets
    • Specialty Stores
    • Convenience Stores
    • Online
    • Others
      • Rest Of Europe Outlook (USD Billion, 2020-2032)
      • Rest Of Europe Reduced Sugar Food & Beverages by Type
    • Bakery & Confectionery
    • Beverages
    • Dairy & Desserts
    • Snacks & Savory
    • Others
      • Rest of the Europe Reduced Sugar Food & Beverages by Consumer Group
        • Gen X
        • Gen Z
        • Millennials
        • Boomers
        •  
      • REST OF EUROPE Reduced Sugar Food & Beverages by End User
        • Residential
        • Commercial
      • REST OF EUROPE Reduced Sugar Food & Beverages by Distribution Channel
    • Supermarkets & Hypermarkets
    • Specialty Stores
    • Convenience Stores
    • Online
    • Others
    • Asia-Pacific Outlook (USD Billion, 2020-2032)
      • Asia-Pacific Reduced Sugar Food & Beverages by Type
        • Bakery & Confectionery
        • Beverages
        • Dairy & Desserts
        • Snacks & Savory
        • Others
      • Asia Pacific Reduced Sugar Food & Beverages by Consumer Group
        • Gen X
        • Gen Z
        • Millennials
        • Boomers
      • Asia-Pacific Reduced Sugar Food & Beverages by End User
        • Residential
        • Commercial
      • Asia-Pacific Reduced Sugar Food & Beverages by Distribution Channel
    • Supermarkets & Hypermarkets
    • Specialty Stores
    • Convenience Stores
    • Online
    • Others
      • China Outlook (USD Billion, 2020-2032)
      • China Reduced Sugar Food & Beverages by Type
        • Bakery & Confectionery
        • Beverages
        • Dairy & Desserts
        • Snacks & Savory
        • Others
      • China Reduced Sugar Food & Beverages by Consumer Group
        • Gen X
        • Gen Z
        • Millennials
        • Boomers
        •  
      • China Reduced Sugar Food & Beverages by End User
        • Residential
        • Commercial
      • China Reduced Sugar Food & Beverages by Distribution Channel
    • Supermarkets & Hypermarkets
    • Specialty Stores
    • Convenience Stores
    • Online
    • Others
      • Japan Outlook (USD Billion, 2020-2032)
      • Japan Reduced Sugar Food & Beverages by Type
        • Bakery & Confectionery
        • Beverages
        • Dairy & Desserts
        • Snacks & Savory
        • Others
      • China Reduced Sugar Food & Beverages by Consumer Group
        • Gen X
        • Gen Z
        • Millennials
        • Boomers


    • Japan Reduced Sugar Food & Beverages by End User
      • Residential
      • Commercial
    • Japan Reduced Sugar Food & Beverages by Distribution Channel
    • Supermarkets & Hypermarkets
    • Specialty Stores
    • Convenience Stores
    • Online
    • Others
      • India Outlook (USD Billion, 2020-2032)
      • India Reduced Sugar Food & Beverages by Type
        • Bakery & Confectionery
        • Beverages
        • Dairy & Desserts
        • Snacks & Savory
        • Others
      • India Reduced Sugar Food & Beverages by Consumer Group
        • Gen X
        • Gen Z
        • Millennials
        • Boomers
        •  
      • India Reduced Sugar Food & Beverages by End User
        • Residential
        • Commercial
      • India Reduced Sugar Food & Beverages by Distribution Channel
    • Supermarkets & Hypermarkets
    • Specialty Stores
    • Convenience Stores
    • Online
    • Others
      • Australia Outlook (USD Billion, 2020-2032)
      • Australia Reduced Sugar Food & Beverages by Type
        • Bakery & Confectionery
        • Beverages
        • Dairy & Desserts
        • Snacks & Savory
        • Others
      • Australia Reduced Sugar Food & Beverages by Consumer Group
        • Gen X
        • Gen Z
        • Millennials
        • Boomers
        •  
      • Australia Reduced Sugar Food & Beverages by End User
        • Residential
        • Commercial
      • Australia Reduced Sugar Food & Beverages by Distribution Channel
    • Supermarkets & Hypermarkets
    • Specialty Stores
    • Convenience Stores
    • Online
    • Others
      • Rest of Asia-Pacific Outlook (USD Billion, 2020-2032)
      • Rest of Asia-Pacific Reduced Sugar Food & Beverages by Type
        • Bakery & Confectionery
        • Beverages
        • Dairy & Desserts
        • Snacks & Savory
        • Others
      • Rest of the Asia Pacific Reduced Sugar Food & Beverages by Consumer Group
        • Gen X
        • Gen Z
        • Millennials
        • Boomers
        •  
      • Rest of Asia-Pacific Reduced Sugar Food & Beverages by End User
        • Residential
        • Commercial
      • Rest of Asia-Pacific Reduced Sugar Food & Beverages by Distribution Channel
    • Supermarkets & Hypermarkets
    • Specialty Stores
    • Convenience Stores
    • Online
    • Others
    • Rest of the World Outlook (USD Billion, 2020-2032)
      • Rest of the World Reduced Sugar Food & Beverages by Type
        • Bakery & Confectionery
        • Beverages
        • Dairy & Desserts
        • Snacks & Savory
        • Others
      • Rest of the World Reduced Sugar Food & Beverages by Consumer Group
        • Gen X
        • Gen Z
        • Millennials
        • Boomers
        •  
      • Rest of the World Reduced Sugar Food & Beverages by End User
        • Residential
        • Commercial
      • Rest of the World Reduced Sugar Food & Beverages by Distribution Channel
    • Supermarkets & Hypermarkets
    • Specialty Stores
    • Convenience Stores
    • Online
    • Others
      • Middle East Outlook (USD Billion, 2020-2032)
      • Middle East Reduced Sugar Food & Beverages by Type
        • Meat Snacks
        • Bakery & Confectionery
        • Beverages
        • Dairy & Desserts
        • Snacks & Savory
        • Others
      • Middle East Reduced Sugar Food & Beverages by Consumer Group
        • Gen X
        • Gen Z
        • Millennials
        • Boomers
      • Middle East Reduced Sugar Food & Beverages by End User
        • Residential
        • Commercial
      • Middle East Reduced Sugar Food & Beverages by Distribution Channel
    • Supermarkets & Hypermarkets
    • Specialty Stores
    • Convenience Stores
    • Online
    • Others
      • Africa Outlook (USD Billion, 2020-2032)
      • Africa Reduced Sugar Food & Beverages by Type
        • Bakery & Confectionery
        • Beverages
        • Dairy & Desserts
        • Snacks & Savory
        • Others
      • Africa Reduced Sugar Food & Beverages by Consumer Group
        • Gen X
        • Gen Z
        • Millennials
        • Boomers
        •  
      • Africa Reduced Sugar Food & Beverages by End User
        • Residential
        • Commercial
      • Africa Reduced Sugar Food & Beverages by Distribution Channel
    • Supermarkets & Hypermarkets
    • Specialty Stores
    • Convenience Stores
    • Online
    • Others
      • Latin America Outlook (USD Billion, 2020-2032)
      • Latin America Reduced Sugar Food & Beverages by Type
        • Bakery & Confectionery
        • Beverages
        • Dairy & Desserts
        • Snacks & Savory
        • Others
      • Latin America Reduced Sugar Food & Beverages by Consumer Group
        • Gen X
        • Gen Z
        • Millennials
        • Boomers
      • Latin America Reduced Sugar Food & Beverages by End User
        • Residential
        • Commercial
      • Latin America Reduced Sugar Food & Beverages by Distribution Channel
    • Supermarkets & Hypermarkets
    • Specialty Stores
    • Convenience Stores
    • Online
    • Others
    Infographic

    Free Sample Request

    Kindly complete the form below to receive a free sample of this Report

    Get Free Sample

    Customer Strories

    “I am very pleased with how market segments have been defined in a relevant way for my purposes (such as "Portable Freezers & refrigerators" and "last-mile"). In general the report is well structured. Thanks very much for your efforts.”

    Victoria Milne

    Founder
    Case Study
    Chemicals and Materials