Request Free Sample ×

Kindly complete the form below to receive a free sample of this Report

* Please use a valid business email

Leading companies partner with us for data-driven Insights

clients tt-cursor
Hero Background

MEMS & Sensors Market

ID: MRFR/SEM/0553-CR
100 Pages
Ankit Gupta
Last Updated: May 11, 2026
Informe de investigación de mercado de MEMS y sensores: pronóstico global hasta 2032
Download PDF ×

We do not share your information with anyone. However, we may send you emails based on your report interest from time to time. You may contact us at any time to opt-out.

  1. 1 RESUMEN EJECUTIVO
    1. 1.1 Análisis del atractivo del mercado
      1. 1.1.1 Mercado global de sensores MEMS por material
      2. 1.1.2 Mercado global de sensores MEMS por tipo
      3. 1.1.3 Mercado global de sensores MEMS por aplicación
      4. 1.1.4 Mercado global de sensores MEMS por región
  2. 2 INTRODUCCIÓN DEL MERCADO
    1. 2.1 Definición
    2. 2.2 Alcance del estudio
    3. 2.3 Estructura del mercado
    4. 2.4 Criterios clave de compra
    5. 2.5 Análisis de indicadores macrofactoriales
  3. 3 METODOLOGÍA DE LA INVESTIGACIÓN
    1. 3.1 Proceso de investigación
    2. 3.2 Investigación primaria
    3. 3.3 Investigación secundaria
    4. 3.4 Estimación del tamaño del mercado
    5. 3.5 Modelo de pronóstico
    6. 3.6 Lista de supuestos
  4. 4 DINÁMICA DEL MERCADO
    1. 4.1 Introducción
    2. 4.2 Impulsores
      1. 4.2.1 Aumento en la adopción de dispositivos inteligentes conectados.
      2. 4.2.2 Crecimiento significativo en las aplicaciones automotrices y militares.
      3. 4.2.3 Análisis del impacto de los impulsores
    3. 4.3 Restricciones
      1. 4.3.1 Inversión inicial en la implementación de sensores MEMS.
      2. 4.3.2 Fluctuación en los precios de los semiconductores.
      3. 4.3.3 Análisis del impacto de las restricciones.
    4. 4.4 Oportunidades
      1. 4.4.1 Desarrollo de la tecnología de sensores MEMS.
      2. 4.4.2 Creciente demanda de dispositivos conectados para implementar el IoT.
    5. 4.5 Impacto de la COVID-19
      1. 4.5.1 Impacto en los fabricantes de componentes semiconductores.
      2. 4.5.2 Impacto en el mercado de sensores MEMS.
      3. 4.5.3 Impacto en los fabricantes de dispositivos.
      4. 4.5.4 Impacto en el análisis de la cadena de suministro
  5. 5 ANÁLISIS DE FACTORES DE MERCADO
    1. 5.1 Análisis de la cadena de valor/Análisis de la cadena de suministro
    2. 5.2 Modelo de las cinco fuerzas de Porter
    3. 5.3 Poder de negociación de los proveedores
    4. 5.4 Poder de negociación de los compradores
    5. 5.5 Amenaza de nuevos participantes
    6. 5.6 Amenaza de sustitutos
    7. 5.7 Intensidad de la rivalidad
  6. 6 MERCADO GLOBAL DE SENSORES MEMS, POR MATERIAL
    1. 6.1 Introducción
    2. 6.2 Silicio
    3. 6.3 Polímeros
    4. 6.4 Metales
    5. 6.5 Cerámica
  7. 7 MERCADO GLOBAL DE SENSORES MEMS, POR TIPO
    1. 7.1 Introducción
    2. 7.2 Acelerómetros
    3. 7.3 Unidades de Medición Inercial (IMU)
    4. 7.4 Magnetómetro
    5. 7.5 Sensores de Presión e Inerciales
    6. 7.6 Micrófono MEMS
    7. 7.7 Sensores de Temperatura
    8. 7.8 Otros
  8. 8 MERCADO GLOBAL DE SENSORES MEMS, POR APLICACIÓN
    1. 8.1 Introducción
    2. 8.2 Electrónica de Consumo
    3. 8.3 Salud
    4. 8.4 Industrial
    5. 8.5 Aeroespacial y Defensa
    6. 8.6 Automotriz
  9. 9 ESTIMACIÓN Y PRONÓSTICO DEL TAMAÑO DEL MERCADO GLOBAL DE SENSORES MEMS, POR REGIÓN
    1. 9.1 Introducción
    2. 9.2 Norteamérica
      1. 9.2.1 Estimaciones y Pronósticos del Mercado, por País, 2024-2032
      2. 9.2.2 Estimaciones y Pronósticos del Mercado Pronóstico por material, 2024-2032
      3. 9.2.3 Estimaciones y pronósticos de mercado por tipo, 2024-2032
      4. 9.2.4 Estimaciones y pronósticos de mercado por aplicación, 2024-2032
      5. 9.2.5 EE. UU.
      6. 9.2.6 Estimaciones y pronósticos de mercado por material, 2024-2032
      7. 9.2.7 Estimaciones y pronósticos de mercado por tipo, 2024-2032
      8. 9.2.8 Estimaciones y pronósticos de mercado por aplicación, 2024-2032
      9. 9.2.9 Canadá
      10. 9.2.10 Estimaciones y pronósticos de mercado por material, 2024-2032
      11. 9.2.11 Estimaciones y pronósticos de mercado Pronóstico por tipo, 2024-2032
      12. 9.2.12 Estimaciones y pronósticos de mercado por aplicación, 2024-2032
      13. 9.2.13 México
        1. 9.2.13.1 Estimaciones y pronósticos de mercado por material, 2024-2032
        2. 9.2.13.2 Estimaciones y pronósticos de mercado por tipo, 2024-2032
        3. 9.2.13.3 Estimaciones y pronósticos de mercado por aplicación, 2024-2032
    3. 9.3 Europa
      1. 9.3.1 Estimaciones y pronósticos de mercado por país, 2024-2032
      2. 9.3.2 Estimaciones y pronósticos de mercado por material, 2024-2032
      3. 9.3.3 Estimaciones y pronósticos de mercado Pronóstico por tipo, 2024-2032
      4. 9.3.4 Estimaciones y pronósticos de mercado por aplicación, 2024-2032
      5. 9.3.5 Reino Unido
        1. 9.3.5.1 Estimaciones y pronósticos de mercado por material, 2024-2032
        2. 9.3.5.2 Estimaciones y pronósticos de mercado por tipo, 2024-2032
        3. 9.3.5.3 Estimaciones y pronósticos de mercado por aplicación, 2024-2032
      6. 9.3.6 Alemania
        1. 9.3.6.1 Estimaciones y pronósticos de mercado por material, 2024-2032
        2. 9.3.6.2 Estimaciones y pronósticos de mercado por tipo, 2024-2032
        3. 9.3.6.3 Estimaciones y pronósticos de mercado Pronóstico por aplicación, 2024-2032
      7. 9.3.7 Francia
        1. 9.3.7.1 Estimaciones y pronóstico del mercado por material, 2024-2032
        2. 9.3.7.2 Estimaciones y pronóstico del mercado por tipo, 2024-2032
        3. 9.3.7.3 Estimaciones y pronóstico del mercado por aplicación, 2024-2032
      8. 9.3.8 Resto de Europa
        1. 9.3.8.1 Estimaciones y pronóstico del mercado por material, 2024-2032
        2. 9.3.8.2 Estimaciones y pronóstico del mercado por tipo, 2024-2032
        3. 9.3.8.3 Estimaciones y pronóstico del mercado por aplicación, 2024-2032
    4. 9.4 Asia-Pacífico
      1. 9.4.1 Estimaciones y pronósticos de mercado por país, 2024-2032
      2. 9.4.2 Estimaciones y pronósticos de mercado por material, 2024-2032
      3. 9.4.3 Estimaciones y pronósticos de mercado por tipo, 2024-2032
      4. 9.4.4 Estimaciones y pronósticos de mercado por aplicación, 2024-2032
      5. 9.4.5 China
        1. 9.4.5.1 Estimaciones y pronósticos de mercado por material, 2024-2032
        2. 9.4.5.2 Estimaciones y pronósticos de mercado por tipo, 2024-2032
        3. 9.4.5.3 Estimaciones y pronósticos de mercado por aplicación, 2024-2032
      6. 9.4.6 Japón
        1. 9.4.6.1 Estimaciones y pronósticos de mercado por material, 2024-2032
        2. 9.4.6.2 Estimaciones y pronósticos de mercado por tipo, 2024-2032
        3. 9.4.6.3 Estimaciones y pronósticos de mercado por aplicación, 2024-2032
      7. 9.4.7 India
        1. 9.4.7.1 Estimaciones y pronósticos de mercado por material, 2024-2032
        2. 9.4.7.2 Estimaciones y pronósticos de mercado por tipo, 2024-2032
        3. 9.4.7.3 Estimaciones y pronósticos de mercado por aplicación, 2024-2032
      8. 9.4.8 Resto de Asia-Pacífico
        1. 9.4.8.1 Estimaciones y pronósticos de mercado Pronóstico por material, 2024-2032
        2. 9.4.8.2 Estimaciones y pronósticos de mercado por tipo, 2024-2032
        3. 9.4.8.3 Estimaciones y pronósticos de mercado por aplicación, 2024-2032
    5. 9.5 Oriente Medio y África
      1. 9.5.1 Estimaciones y pronósticos de mercado por material, 2024-2032
      2. 9.5.2 Estimaciones y pronósticos de mercado por tipo, 2024-2032
      3. 9.5.3 Estimaciones y pronósticos de mercado por aplicación, 2024-2032
    6. 9.6 Sudamérica
      1. 9.6.1 Estimaciones y pronósticos de mercado por material, 2024-2032
      2. 9.6.2 Estimaciones y pronósticos de mercado Pronóstico por tipo, 2024-2032
      3. 9.6.3 Estimaciones y pronóstico del mercado por aplicación, 2024-2032
  10. 10 PANORAMA COMPETITIVO
    1. 10.1 Introducción
    2. 10.2 Desarrollos clave y estrategias de crecimiento
    3. 10.3 Análisis comparativo de la competencia
    4. 10.4 Análisis de la participación de los proveedores, 2022 (% de participación)
    5. 10.5 Desarrollos recientes del mercado
  11. 11 PERFILES DE LA EMPRESA
    1. 11.1 ASE Technology Holding Co., Ltd.
      1. 11.1.1 Descripción general de la empresa
      2. 11.1.2 Resumen financiero
      3. 11.1.3 Soluciones/servicios ofrecidos
      4. 11.1.4 Desarrollos clave
      5. 11.1.5 Análisis FODA
      6. 11.1.6 Estrategias Clave
    2. 11.2 AMS AG
    3. 11.3 Robert Bosch GMBH
    4. 11.4 Qualcomm Technologies Inc.
    5. 11.5 Seiko Epson Corporation
    6. 11.6 Texas Instruments Inc.
    7. 11.7 Silex Microsystems.
    8. 11.8 Teledyne Technologies
    9. 11.9 Sony Corporation
    10. 11.10 Taiwan Semiconductor Manufacturing Company Limited (TSMC)
    11. 11.11 X-FAB Silicon Foundries SE
    12. 11.12 Infineon Technologies
    13. 11.13 Denso
    14. 11.14 Avago Technologies
    15. 11.15 Sensata
    16. 11.16 Measurement Specialties Inc.
    17. 11.17 Analog Devices Inc.
    18. 11.18 STMicroelectronics N.V.
    19. NOTA:
    20. Este índice es provisional y está sujeto a cambios a medida que avanza la investigación.
    21. ? En la sección 11, solo se presentarán las 15 empresas más importantes. Cada empresa se perfilará según los parámetros de Resumen del Mercado, Información Financiera, Portafolio de Servicios, Estrategias Comerciales y Desarrollos Recientes.
    22. ? Las empresas se seleccionan con base en dos criterios generales: la solidez de su portafolio de productos y la excelencia en sus estrategias comerciales.
    23. ? Los parámetros clave para evaluar la solidez del portafolio de productos del proveedor son la experiencia en el sector, las capacidades/características del producto, las innovaciones/inversión en I+D, la flexibilidad para personalizar el producto, la capacidad de integración con otros sistemas, los servicios de preventa y posventa, y las valoraciones/comentarios de los clientes.
    24. ? Los parámetros clave considerados para evaluar la excelencia de un proveedor en la estrategia comercial son su participación de mercado, presencia global, base de clientes, ecosistema de socios (tipo alianzas/revendedores/distribuidores), adquisiciones y estrategias/inversiones de marketing.
    25. Los detalles financieros de la empresa no se pueden proporcionar si la información no está disponible en el dominio público o en fuentes confiables. ?
    26. LISTA DE TABLAS
    27. TABLA 1 MERCADO GLOBAL DE SENSORES MEMS, POR MATERIAL, 2024-2032 (MILLONES DE USD) 48
    28. TABLA 2 MERCADO GLOBAL DE SENSORES MEMS, POR MATERIAL, 2024-2032 (MILLONES DE UNIDADES) 48
    29. TABLA 3 MERCADO GLOBAL DE SENSORES MEMS, POR TIPO, 2024-2032 (MILLONES DE USD) 51
    30. TABLA 4 MERCADO GLOBAL DE SENSORES MEMS, POR TIPO, 2024-2032 (MILLONES DE UNIDADES) 51
    31. TABLA 5 MERCADO GLOBAL DE SENSORES MEMS, POR APLICACIÓN, 2024-2032 (MILLONES DE USD) 55
    32. TABLA 6 MERCADO GLOBAL DE SENSORES MEMS, POR APLICACIÓN, 2024-2032 (MN UNIDADES) 55
    33. TABLA 7 MERCADO GLOBAL DE SENSORES MEMS, POR REGIÓN, 2024-2032 (MILLONES DE USD) 58
    34. TABLA 8 MERCADO GLOBAL DE SENSORES MEMS, POR REGIÓN, 2024-2032 (MN UNIDADES) 58
    35. TABLA 9 MERCADO DE SENSORES MEMS EN AMÉRICA DEL NORTE, POR PAÍS, 2024-2032 (MILLONES DE USD) 61
    36. TABLA 10 MERCADO DE SENSORES MEMS EN AMÉRICA DEL NORTE, POR PAÍS, 2024-2032 (MN UNIDADES) 61
    37. TABLA 11 MERCADO DE SENSORES MEMS EN AMÉRICA DEL NORTE, POR MATERIAL, 2024-2032 (MILLONES DE USD) 62
    38. TABLA 12 MERCADO DE SENSORES MEMS DE AMÉRICA DEL NORTE, POR MATERIAL, 2024-2032 (MILLONES DE UNIDADES) 62
    39. TABLA 13 MERCADO DE SENSORES MEMS DE AMÉRICA DEL NORTE, POR TIPO, 2024-2032 (MILLONES DE USD) 63
    40. TABLA 14 MERCADO DE SENSORES MEMS DE AMÉRICA DEL NORTE, POR TIPO, 2024-2032 (MILLONES DE USD) 63
    41. TABLA 15 MERCADO DE SENSORES MEMS DE AMÉRICA DEL NORTE, POR APLICACIÓN, 2024-2032 (MILLONES DE USD) 64
    42. TABLA 16 MERCADO DE SENSORES MEMS DE AMÉRICA DEL NORTE, POR APLICACIÓN, 2024-2032 (MILLONES DE UNIDADES) 65
    43. TABLA 17 MERCADO DE SENSORES MEMS DE EE. UU., POR MATERIAL, 2024-2032 (USD MILLONES) 65
    44. TABLA 18 MERCADO DE SENSORES MEMS DE EE. UU., POR MATERIAL, 2024-2032 (MN UNIDADES) 65
    45. TABLA 19 MERCADO DE SENSORES MEMS DE EE. UU., POR TIPO, 2024-2032 (USD MILLONES) 66
    46. TABLA 20 MERCADO DE SENSORES MEMS DE EE. UU., POR TIPO, 2024-2032 (MN UNIDADES) 66
    47. TABLA 21 MERCADO DE SENSORES MEMS DE EE. UU., POR APLICACIÓN, 2024-2032 (USD MILLONES) 67
    48. TABLA 22 MERCADO DE SENSORES MEMS DE EE. UU., POR APLICACIÓN, 2024-2032 (MN UNIDADES) 67
    49. TABLA 23 MERCADO DE SENSORES MEMS DE CANADÁ, POR MATERIAL, 2024-2032 (USD MILLONES) 68
    50. TABLA 24 MERCADO DE SENSORES MEMS DE CANADÁ, POR MATERIAL, 2024-2032 (MN UNIDADES) 68
    51. TABLA 25 MERCADO DE SENSORES MEMS DE CANADÁ, POR TIPO, 2024-2032 (USD MILLONES) 69
    52. TABLA 26 MERCADO DE SENSORES MEMS DE CANADÁ, POR TIPO, 2024-2032 (MN UNIDADES) 69
    53. TABLA 27 MERCADO DE SENSORES MEMS DE CANADÁ, POR APLICACIÓN, 2024-2032 (USD MILLONES) 70
    54. TABLA 28 MERCADO DE SENSORES MEMS DE CANADÁ, POR APLICACIÓN, 2024-2032 (MN UNIDADES) 70
    55. TABLA 29 MERCADO DE SENSORES MEMS DE MÉXICO, POR MATERIAL, 2024-2032 (USD MILLONES) 71
    56. TABLA 30 MERCADO DE SENSORES MEMS DE MÉXICO, POR MATERIAL, 2024-2032 (MN UNIDADES) 71
    57. TABLA 31 MERCADO DE SENSORES MEMS DE MÉXICO, POR TIPO, 2024-2032 (USD MILLONES) 72
    58. TABLA 32 MERCADO DE SENSORES MEMS DE MÉXICO, POR TIPO, 2024-2032 (MN UNIDADES) 72
    59. TABLA 33 MERCADO DE SENSORES MEMS DE MÉXICO, POR APLICACIÓN, 2024-2032 (USD MILLONES) 73
    60. TABLA 34 MERCADO DE SENSORES MEMS DE MÉXICO, POR APLICACIÓN, 2024-2032 (MN UNIDADES) 73
    61. TABLA 35 MEMS DE EUROPA MERCADO DE SENSORES, POR PAÍS, 2024-2032 (MILLONES DE USD) 76
    62. TABLA 36 MERCADO DE SENSORES MEMS EN EUROPA, POR PAÍS, 2024-2032 (MILLONES DE UNIDADES) 76
    63. TABLA 37 MERCADO DE SENSORES MEMS EN EUROPA, POR MATERIAL, 2024-2032 (MILLONES DE USD) 77
    64. TABLA 38 MERCADO DE SENSORES MEMS EN EUROPA, POR MATERIAL, 2024-2032 (MILLONES DE UNIDADES) 77
    65. TABLA 39 MERCADO DE SENSORES MEMS EN EUROPA, POR TIPO, 2024-2032 (MILLONES DE USD) 78
    66. TABLA 40 MERCADO DE SENSORES MEMS EN EUROPA, POR TIPO, 2024-2032 (MILLONES DE UNIDADES) 79
    67. TABLA 41 MEMS EN EUROPA MERCADO DE SENSORES, POR APLICACIÓN, 2024-2032 (MILLONES DE USD) 80
    68. TABLA 42 MERCADO DE SENSORES MEMS EN EUROPA, POR APLICACIÓN, 2024-2032 (MILLONES DE UNIDADES) 80
    69. TABLA 43 MERCADO DE SENSORES MEMS EN ALEMANIA, POR MATERIAL, 2024-2032 (MILLONES DE USD) 81
    70. TABLA 44 MERCADO DE SENSORES MEMS EN ALEMANIA, POR MATERIAL, 2024-2032 (MILLONES DE UNIDADES) 81
    71. TABLA 45 MERCADO DE SENSORES MEMS EN ALEMANIA, POR TIPO, 2024-2032 (MILLONES DE USD) 82
    72. TABLA 46 MERCADO DE SENSORES MEMS EN ALEMANIA, POR TIPO, 2024-2032 (MILLONES DE UNIDADES) 82
    73. TABLA 47 MERCADO DE SENSORES MEMS DE ALEMANIA, POR APLICACIÓN, 2024-2032 (MILLONES DE USD) 83
    74. TABLA 48 MERCADO DE SENSORES MEMS DE ALEMANIA, POR APLICACIÓN, 2024-2032 (MILLONES DE UNIDADES) 83
    75. TABLA 49 MERCADO DE SENSORES MEMS DEL REINO UNIDO, POR MATERIAL, 2024-2032 (MILLONES DE USD) 84
    76. TABLA 50 MERCADO DE SENSORES MEMS DEL REINO UNIDO, POR MATERIAL, 2024-2032 (MILLONES DE UNIDADES) 84
    77. TABLA 51 MERCADO DE SENSORES MEMS DEL REINO UNIDO, POR TIPO, 2024-2032 (MILLONES DE USD) 85
    78. TABLA 52 MERCADO DE SENSORES MEMS DEL REINO UNIDO, POR TIPO, 2024-2032 (MILLONES DE UNIDADES) 85
    79. TABLA 53 MERCADO DE SENSORES MEMS DEL REINO UNIDO, POR APLICACIÓN, 2024-2032 (MILLONES DE USD) 86
    80. TABLA 54 MERCADO DE SENSORES MEMS DEL REINO UNIDO, POR APLICACIÓN, 2024-2032 (MILLONES DE UNIDADES) 86
    81. TABLA 55 MERCADO DE SENSORES MEMS EN FRANCIA, POR MATERIAL, 2024-2032 (MILLONES DE USD) 87
    82. TABLA 56 MERCADO DE SENSORES MEMS EN FRANCIA, POR MATERIAL, 2024-2032 (MILLONES DE UNIDADES) 87
    83. TABLA 57 MERCADO DE SENSORES MEMS EN FRANCIA, POR TIPO, 2024-2032 (MILLONES DE USD) 88
    84. TABLA 58 MERCADO DE SENSORES MEMS EN FRANCIA, POR TIPO, 2024-2032 (MILLONES DE UNIDADES) 88
    85. TABLA 59 MERCADO DE SENSORES MEMS EN FRANCIA, POR APLICACIÓN, 2024-2032 (MILLONES DE USD) 89
    86. TABLA 60 MERCADO DE SENSORES MEMS EN FRANCIA, POR APLICACIÓN, 2024-2032 (MILLONES DE UNIDADES) 89
    87. TABLA 61 MERCADO DE SENSORES MEMS EN ITALIA, POR MATERIAL, 2024-2032 (MILLONES DE USD) 90
    88. TABLA 62 MERCADO DE SENSORES MEMS EN ITALIA, POR MATERIAL, 2024-2032 (MILLONES DE UNIDADES) 90
    89. TABLA 63 MERCADO DE SENSORES MEMS EN ITALIA, POR TIPO, 2024-2032 (MILLONES DE USD) 91
    90. TABLA 64 MERCADO DE SENSORES MEMS EN ITALIA, POR TIPO, 2024-2032 (MILLONES DE UNIDADES) 91
    91. TABLA 65 MERCADO DE SENSORES MEMS EN ITALIA, POR APLICACIÓN, 2024-2032 (MILLONES DE USD) 92
    92. TABLA 66 MERCADO DE SENSORES MEMS EN ITALIA, POR APLICACIÓN, 2024-2032 (MILLONES DE UNIDADES) 92
    93. TABLA 67 MERCADO ESPAÑOL DE SENSORES MEMS, POR MATERIAL, 2024-2032 (MILLONES DE USD) 93
    94. TABLA 68 MERCADO ESPAÑOL DE SENSORES MEMS, POR MATERIAL, 2024-2032 (MILLONES DE UNIDADES) 93
    95. TABLA 69 MERCADO ESPAÑOL DE SENSORES MEMS, POR TIPO, 2024-2032 (MILLONES DE USD) 94
    96. TABLA 70 MERCADO ESPAÑOL DE SENSORES MEMS, POR TIPO, 2024-2032 (MILLONES DE UNIDADES) 94
    97. TABLA 71 MERCADO ESPAÑOL DE SENSORES MEMS, POR APLICACIÓN, 2024-2032 (MILLONES DE USD) 95
    98. TABLA 72 MERCADO ESPAÑOL DE SENSORES MEMS, POR APLICACIÓN, 2024-2032 (MILLONES DE UNIDADES) 95
    99. TABLA 73 RESTO DE EUROPA MERCADO DE SENSORES MEMS, POR MATERIAL, 2024-2032 (MILLONES DE USD) 96
    100. TABLA 74 RESTO DE EUROPA MERCADO DE SENSORES MEMS, POR MATERIAL, 2024-2032 (MN UNIDADES) 96
    101. TABLA 75 RESTO DE EUROPA MERCADO DE SENSORES MEMS, POR TIPO, 2024-2032 (MN UNIDADES) 97
    102. TABLA 76 RESTO DE EUROPA MERCADO DE SENSORES MEMS, POR TIPO, 2024-2032 (MN UNIDADES) 97
    103. TABLA 77 RESTO DE EUROPA MERCADO DE SENSORES MEMS, POR APLICACIÓN, 2024-2032 (MILLONES DE USD) 98
    104. TABLA 78 RESTO DE EUROPA MERCADO DE SENSORES MEMS, POR APLICACIÓN, 2024-2032 (MN UNIDADES) 98
    105. TABLA 79 MERCADO DE SENSORES MEMS DE ASIA-PACÍFICO, POR PAÍS, 2024-2032 (MILLONES DE USD) 101
    106. TABLA 80 MERCADO DE SENSORES MEMS DE ASIA-PACÍFICO, POR PAÍS, 2024-2032 (MN UNIDADES) 101
    107. TABLA 81 MERCADO DE SENSORES MEMS DE ASIA-PACÍFICO, POR MATERIAL, 2024-2032 (MILLONES DE USD) 102
    108. TABLA 82 MERCADO DE SENSORES MEMS DE ASIA-PACÍFICO, POR MATERIAL, 2024-2032 (MN UNIDADES) 103
    109. TABLA 83 MERCADO DE SENSORES MEMS DE ASIA-PACÍFICO, POR TIPO, 2024-2032 (MILLONES DE USD) 104
    110. TABLA 84 MERCADO DE SENSORES MEMS DE ASIA-PACÍFICO, POR TIPO, 2024-2032 (MILLONES DE UNIDADES) 104
    111. TABLA 85 MERCADO DE SENSORES MEMS DE ASIA-PACÍFICO, POR APLICACIÓN, 2024-2032 (MILLONES DE USD) 105
    112. TABLA 86 MERCADO DE SENSORES MEMS DE ASIA-PACÍFICO, POR APLICACIÓN, 2024-2032 (MILLONES DE UNIDADES) 106
    113. TABLA 87 MERCADO DE SENSORES MEMS DE CHINA, POR MATERIAL, 2024-2032 (MILLONES DE USD) 106
    114. TABLA 88 MERCADO DE SENSORES MEMS DE CHINA, POR MATERIAL, 2024-2032 (MILLONES DE UNIDADES) 106
    115. TABLA 89 MERCADO DE SENSORES MEMS DE CHINA, POR TIPO, 2024-2032 (USD MILLONES) 107
    116. TABLA 90 MERCADO DE SENSORES MEMS DE CHINA, POR TIPO, 2024-2032 (MILLONES DE UNIDADES) 107
    117. TABLA 91 MERCADO DE SENSORES MEMS DE CHINA, POR APLICACIÓN, 2024-2032 (USD MILLONES) 108
    118. TABLA 92 MERCADO DE SENSORES MEMS DE CHINA, POR APLICACIÓN, 2024-2032 (MILLONES DE UNIDADES) 108
    119. TABLA 93 MERCADO DE SENSORES MEMS DE JAPÓN, POR MATERIAL, 2024-2032 (USD MILLONES) 109
    120. TABLA 94 MERCADO DE SENSORES MEMS DE JAPÓN, POR TIPO, 2024-2032 (USD MILLONES) 110
    121. TABLA 95 SENSORES MEMS DE JAPÓN MERCADO, POR TIPO, 2024-2032 (MILLONES DE UNIDADES) 110
    122. TABLA 96 MERCADO DE SENSORES MEMS DE JAPÓN, POR APLICACIÓN, 2024-2032 (MILLONES DE USD) 111
    123. TABLA 97 MERCADO DE SENSORES MEMS DE JAPÓN, POR APLICACIÓN, 2024-2032 (MILLONES DE UNIDADES) 111
    124. TABLA 98 MERCADO DE SENSORES MEMS DE INDIA, POR MATERIAL, 2024-2032 (MILLONES DE USD) 112
    125. TABLA 99 MERCADO DE SENSORES MEMS DE INDIA, POR MATERIAL, 2024-2032 (MILLONES DE UNIDADES) 112
    126. TABLA 100 MERCADO DE SENSORES MEMS DE INDIA, POR TIPO, 2024-2032 (MILLONES DE USD) 113
    127. TABLA 101 MERCADO DE SENSORES MEMS DE LA INDIA, POR TIPO, 2024-2032 (MILLONES DE UNIDADES) 113
    128. TABLA 102 MERCADO DE SENSORES MEMS DE LA INDIA, POR APLICACIÓN, 2024-2032 (MILLONES DE USD) 114
    129. TABLA 103 MERCADO DE SENSORES MEMS DE LA INDIA, POR APLICACIÓN, 2024-2032 (MILLONES DE UNIDADES) 114
    130. TABLA 104 MERCADO DE SENSORES MEMS DE COREA DEL SUR, POR MATERIAL, 2024-2032 (MILLONES DE USD) 115
    131. TABLA 105 MERCADO DE SENSORES MEMS DE COREA DEL SUR, POR MATERIAL, 2024-2032 (MILLONES DE UNIDADES) 115
    132. TABLA 106 MERCADO DE SENSORES MEMS DE COREA DEL SUR, POR TIPO, 2024-2032 (USD MILLONES) 116
    133. TABLA 107 MERCADO DE SENSORES MEMS DE COREA DEL SUR, POR TIPO, 2024-2032 (MILLONES DE UNIDADES) 116
    134. TABLA 108 MERCADO DE SENSORES MEMS DE COREA DEL SUR, POR APLICACIÓN, 2024-2032 (USD MILLONES) 117
    135. TABLA 109 MERCADO DE SENSORES MEMS DE COREA DEL SUR, POR APLICACIÓN, 2024-2032 (MILLONES DE UNIDADES) 117
    136. TABLA 110 RESTO DEL MERCADO DE SENSORES MEMS DE ASIA-PACÍFICO, POR MATERIAL, 2024-2032 (USD MILLONES) 118
    137. TABLA 111 RESTO DEL MERCADO DE SENSORES MEMS DE ASIA-PACÍFICO, POR MATERIAL, 2024-2032 (MN UNIDADES) 118
    138. TABLA 112 RESTO DEL MERCADO DE SENSORES MEMS DE ASIA-PACÍFICO, POR TIPO, 2024-2032 (MILLONES DE USD) 119
    139. TABLA 113 RESTO DEL MERCADO DE SENSORES MEMS DE ASIA-PACÍFICO, POR TIPO, 2024-2032 (MN UNIDADES) 119
    140. TABLA 114 RESTO DEL MERCADO DE SENSORES MEMS DE ASIA-PACÍFICO, POR APLICACIÓN, 2024-2032 (MILLONES DE USD) 120
    141. TABLA 115 RESTO DEL MERCADO DE SENSORES MEMS DE ASIA-PACÍFICO, POR APLICACIÓN, 2024-2032 (MN UNIDADES) 120
    142. TABLA 116 ORIENTE MEDIO Y MERCADO DE SENSORES MEMS EN ÁFRICA, POR PAÍS, 2024-2032 (MILLONES DE USD) 122
    143. TABLA 117 MERCADO DE SENSORES MEMS EN ORIENTE MEDIO Y ÁFRICA, POR PAÍS, 2024-2032 (MILLONES DE UNIDADES) 122
    144. TABLA 118 MERCADO DE SENSORES MEMS EN ORIENTE MEDIO Y ÁFRICA, POR MATERIAL, 2024-2032 (MILLONES DE USD) 123
    145. TABLA 119 MERCADO DE SENSORES MEMS EN ORIENTE MEDIO Y ÁFRICA, POR MATERIAL, 2024-2032 (MILLONES DE UNIDADES) 124
    146. TABLA 120 MERCADO DE SENSORES MEMS EN ORIENTE MEDIO Y ÁFRICA, POR MATERIAL, 2024-2032 (MILLONES DE UNIDADES) 124 MERCADO DE SENSORES MEMS DE ÁFRICA, POR TIPO, 2024-2032 (MILLONES DE USD) 125
    147. TABLA 121 MERCADO DE SENSORES MEMS DE ORIENTE MEDIO Y ÁFRICA, POR TIPO, 2024-2032 (MILLONES DE UNIDADES) 125
    148. TABLA 122 MERCADO DE SENSORES MEMS DE ORIENTE MEDIO Y ÁFRICA, POR APLICACIÓN, 2024-2032 (MILLONES DE USD) 126
    149. TABLA 123 MERCADO DE SENSORES MEMS DE ORIENTE MEDIO Y ÁFRICA, POR APLICACIÓN, 2024-2032 (MILLONES DE USD) 126 MERCADO DE SENSORES MEMS EN ÁFRICA, POR APLICACIÓN, 2024-2032 (MILLONES DE UNIDADES) 127
    150. TABLA 124 MERCADO DE SENSORES MEMS DE LOS PAÍSES DEL CCG, POR MATERIAL, 2024-2032 (MILLONES DE USD) 127
    151. TABLA 125 MERCADO DE SENSORES MEMS DE LOS PAÍSES DEL CCG, POR MATERIAL, 2024-2032 (MILLONES DE UNIDADES) 128
    152. TABLA 126 MERCADO DE SENSORES MEMS DE LOS PAÍSES DEL CCG, POR TIPO, 2024-2032 (MILLONES DE USD) 128
    153. TABLA 127 MERCADO DE SENSORES MEMS DE LOS PAÍSES DEL CCG, POR TIPO, 2024-2032 (MILLONES DE UNIDADES) 129
    154. TABLA 128 MERCADO DE SENSORES MEMS DE LOS PAÍSES DEL CCG, POR APLICACIÓN, 2024-2032 (MILLONES DE USD) 129
    155. TABLA 129 MERCADO DE SENSORES MEMS DE LOS PAÍSES DEL CCG, POR APLICACIÓN, 2024-2032 (MILLONES DE UNIDADES) 130
    156. TABLA 130 MERCADO DE SENSORES MEMS DE SUDÁFRICA, POR MATERIAL, 2024-2032 (MILLONES DE USD) 130
    157. TABLA 131 MERCADO DE SENSORES MEMS DE SUDÁFRICA, POR MATERIAL, 2024-2032 (MILLONES DE UNIDADES) 130
    158. TABLA 132 MERCADO DE SENSORES MEMS DE SUDÁFRICA, POR TIPO, 2024-2032 (MILLONES DE USD) 131
    159. TABLA 133 MERCADO DE SENSORES MEMS DE SUDÁFRICA, POR TIPO, 2024-2032 (MILLONES DE USD) UNIDADES) 131
    160. TABLA 134 MERCADO DE SENSORES MEMS DE SUDÁFRICA, POR APLICACIÓN, 2024-2032 (MILLONES DE USD) 132
    161. TABLA 135 MERCADO DE SENSORES MEMS DE SUDÁFRICA, POR APLICACIÓN, 2024-2032 (MILLONES DE UNIDADES) 132
    162. TABLA 136 RESTO DEL MERCADO DE SENSORES MEMS DE MEA, POR MATERIAL, 2024-2032 (MILLONES DE USD) 133
    163. TABLA 137 RESTO DEL MERCADO DE SENSORES MEMS DE MEA, POR MATERIAL, 2024-2032 (MILLONES DE UNIDADES) 133
    164. TABLA 138 RESTO DEL MERCADO DE SENSORES MEMS DE MEA, POR TIPO, 2024-2032 (MILLONES DE USD) 134
    165. TABLA 139 RESTO DEL MERCADO DE SENSORES MEMS DE MEA, POR TIPO, 2024-2032 (MILLONES DE UNIDADES) 134
    166. TABLA 140 RESTO DEL MERCADO DE SENSORES MEMS DE MEA, POR APLICACIÓN, 2024-2032 (MILLONES DE USD) 135
    167. TABLA 141 RESTO DEL MERCADO DE SENSORES MEMS DE MEA, POR APLICACIÓN, 2024-2032 (MILLONES DE UNIDADES) 135
    168. TABLA 142 MERCADO DE SENSORES MEMS DE AMÉRICA DEL SUR, POR PAÍS, 2024-2032 (MILLONES DE USD) 137
    169. TABLA 143 MERCADO DE SENSORES MEMS DE AMÉRICA DEL SUR, POR PAÍS, 2024-2032 (MILLONES DE UNIDADES) 137
    170. TABLA 144 MEMS DE AMÉRICA DEL SUR MERCADO DE SENSORES, POR MATERIAL, 2024-2032 (MILLONES DE USD) 138
    171. TABLA 145 MERCADO DE SENSORES MEMS DE SUDAMÉRICA, POR MATERIAL, 2024-2032 (MILLONES DE UNIDADES) 138
    172. TABLA 146 MERCADO DE SENSORES MEMS DE SUDAMÉRICA, POR TIPO, 2024-2032 (MILLONES DE USD) 139
    173. TABLA 147 MERCADO DE SENSORES MEMS DE SUDAMÉRICA, POR TIPO, 2024-2032 (MILLONES DE UNIDADES) 140
    174. TABLA 148 MERCADO DE SENSORES MEMS DE SUDAMÉRICA, POR APLICACIÓN, 2024-2032 (MILLONES DE USD) 141
    175. TABLA 149 MERCADO DE SENSORES MEMS DE SUDAMÉRICA, POR APLICACIÓN, 2024-2032 (MN UNIDADES) 141
    176. TABLA 150 MERCADO DE SENSORES MEMS DE BRASIL, POR MATERIAL, 2024-2032 (MILLONES DE USD) 142
    177. TABLA 151 MERCADO DE SENSORES MEMS DE BRASIL, POR MATERIAL, 2024-2032 (MN UNIDADES) 142
    178. TABLA 152 MERCADO DE SENSORES MEMS DE BRASIL, POR TIPO, 2024-2032 (MILLONES DE USD) 143
    179. TABLA 153 MERCADO DE SENSORES MEMS DE BRASIL, POR TIPO, 2024-2032 (MN UNIDADES) 143
    180. TABLA 154 MERCADO DE SENSORES MEMS DE BRASIL, POR APLICACIÓN, 2024-2032 (MILLONES DE USD) 144
    181. TABLA 155 MERCADO DE SENSORES MEMS DE BRASIL, POR APLICACIÓN, 2024-2032 (MILLONES DE UNIDADES) 144
    182. TABLA 156 MERCADO DE SENSORES MEMS DE ARGENTINA, POR MATERIAL, 2024-2032 (MILLONES DE USD) 145
    183. TABLA 157 MERCADO DE SENSORES MEMS DE ARGENTINA, POR MATERIAL, 2024-2032 (MILLONES DE USD) 145
    184. TABLA 158 MERCADO DE SENSORES MEMS DE ARGENTINA, POR TIPO, 2024-2032 (MILLONES DE USD) 146
    185. TABLA 159 MERCADO DE SENSORES MEMS DE ARGENTINA, POR TIPO, 2024-2032 (MILLONES DE UNIDADES) 146
    186. TABLA 160 MERCADO DE SENSORES MEMS DE ARGENTINA, POR APLICACIÓN, 2024-2032 (USD MILLONES) 147
    187. TABLA 161 MERCADO DE SENSORES MEMS DE ARGENTINA, POR APLICACIÓN, 2024-2032 (MN UNIDADES) 147
    188. TABLA 162 RESTO DE SUDAMÉRICA MERCADO DE SENSORES MEMS, POR MATERIAL, 2024-2032 (USD MILLONES) 148
    189. TABLA 163 RESTO DE SUDAMÉRICA MERCADO DE SENSORES MEMS, POR MATERIAL, 2024-2032 (MN UNIDADES) 148
    190. TABLA 164 RESTO DE SUDAMÉRICA MERCADO DE SENSORES MEMS, POR TIPO, 2024-2032 (USD MILLONES) 149
    191. TABLA 165 RESTO DE SUDAMÉRICA MERCADO DE SENSORES MEMS, POR TIPO, 2024-2032 (MN UNIDADES) 149
    192. TABLA 166 RESTO DEL MERCADO DE SENSORES MEMS DE SUDAMÉRICA, POR APLICACIÓN, 2024-2032 (MILLONES DE USD) 150
    193. TABLA 167 RESTO DEL MERCADO DE SENSORES MEMS DE SUDAMÉRICA, POR APLICACIÓN, 2024-2032 (MN UNIDADES) 150
    194. TABLA 168 DESARROLLO DE PRODUCTOS 153
    195. TABLA 169 ASOCIACIONES/ACUERDOS/CONTRATOS/COLABORACIONES 156
    196. TABLA 170 ASE TECHNOLOGY HOLDING CO., LTD.: PRODUCTOS/SOLUCIONES/SERVICIOS OFRECIDOS 159
    197. TABLA 171 ASE TECHNOLOGY HOLDING CO., LTD.: DESARROLLOS CLAVE 160
    198. TABLA 172 AMS AG: PRODUCTOS/SOLUCIONES/SERVICIOS OFRECIDOS 163
    199. TABLA 173 AMS AG: DESARROLLOS CLAVE 163
    200. TABLA 174 ROBERT BOSCH GMBH: PRODUCTOS OFRECIDOS 166
    201. TABLA 175 ROBERT BOSCH GMBH: DESARROLLOS CLAVE 166
    202. TABLA 176 QUALCOMM TECHNOLOGIES, INC.: PRODUCTOS/SERVICIOS/SOLUCIONES OFRECIDAS 170
    203. TABLA 177 QUALCOMM TECHNOLOGIES, INC.: DESARROLLOS CLAVE 170
    204. TABLA 178 SEIKO EPSON CORPORATION: PRODUCTOS/SOLUCIONES/SERVICIOS OFRECIDOS 173
    205. TABLA 179 TEXAS INSTRUMENTS INCORPORATED: PRODUCTOS OFRECIDOS 175
    206. TABLA 180 TEXAS INSTRUMENTS INCORPORATED: DESARROLLOS CLAVE 178
    207. TABLA 181 SILEX MICROSYSTEMS.: PRODUCTOS/SOLUCIONES/SERVICIOS OFRECIDOS 180
    208. TABLA 182 SILEX MICROSYSTEMS.: DESARROLLOS CLAVE 182
    209. TABLA 183 TELEDYNE TECHNOLOGIES: PRODUCTOS OFRECIDOS 184
    210. TABLA 184 TELEDYNE TECHNOLOGIES: DESARROLLOS CLAVE 184
    211. TABLA 185 SONY CORPORATION: PRODUCTOS/SOLUCIONES/SERVICIOS OFRECIDOS 187
    212. TABLA 186 TAIWAN SEMICONDUCTOR MANUFACTURING COMPANY LIMITED (TSMC): PRODUCTOS/SOLUCIONES/SERVICIOS OFRECIDOS 190
    213. TABLA 187 X-FAB SILICON FOUNDRIES SE: PRODUCTOS/SOLUCIONES/SERVICIOS OFRECIDOS 193
    214. TABLA 188 X-FAB SILICON FOUNDRIES SE: DESARROLLOS CLAVE 193
    215. TABLA 189 INFINEON TECHNOLOGIES: PRODUCTOS OFRECIDOS 196
    216. TABLA 190 INFINEON TECHNOLOGIES: DESARROLLOS CLAVE 197
    217. TABLA 191 DISPOSITIVOS ANALÓGICOS: PRODUCTOS OFRECIDOS 200
    218. TABLA 192 DISPOSITIVOS ANALÓGICOS: DESARROLLOS CLAVE 200
    219. TABLA 193 DENSO CORPORATION: PRODUCTOS OFRECIDOS 203
    220. TABLA 194 DENSO CORPORATION: DESARROLLOS CLAVE 205
    221. TABLA 195 AVAGO TECHNOLOGIES LTD (BROADCOM INC): PRODUCTOS OFRECIDOS 207
    222. TABLA 196 SENSATA TECHNOLOGIES: SOLUCIONES OFRECIDAS 210
    223. TABLA 197 SENSATA TECHNOLOGIES: DESARROLLOS CLAVE 210
    224. TABLA 198 ESPECIALIDADES DE MEDICIÓN INC. (TE CONNECTIVITY): PRODUCTOS OFRECIDOS 213
    225. TABLA 199 ESPECIALIDADES DE MEDICIÓN INC. (TE CONNECTIVITY): DESARROLLOS CLAVE 214
    226. TABLA 200 STMICROELECTRONICS: PRODUCTOS OFRECIDOS 216
    227. TABLA 201 STMICROELECTRONICS: DESARROLLOS CLAVE 217
    228. ?
    229. LISTA DE FIGURAS
    230. FIGURA 1 SINOPSIS DEL MERCADO 24
    231. FIGURA 2 ANÁLISIS DEL ATRACTIVO DEL MERCADO 25
    232. FIGURA 3 MERCADO GLOBAL DE SENSORES MEMS: ESTRUCTURA DEL MERCADO 26
    233. FIGURA 4 ENFOQUES DE ABAJO ASCENDENTE Y DE ARRIBA HACIA ABAJO 31
    234. FIGURA 5 ANÁLISIS DINÁMICO DEL MERCADO GLOBAL DE SENSORES MEMS 34
    235. FIGURA 6 ANÁLISIS DEL IMPACTO DE LOS IMPULSORES: MERCADO GLOBAL DE SENSORES MEMS 36
    236. FIGURA 7 ANÁLISIS DEL IMPACTO DE LAS RESTRICCIONES: MERCADO GLOBAL DE SENSORES MEMS 37
    237. FIGURA 8 CADENA DE VALOR: MERCADO GLOBAL DE SENSORES MEMS 42
    238. FIGURA 9 ANÁLISIS DE LAS CINCO FUERZAS DE PORTER DEL MERCADO GLOBAL DE SENSORES MEMS 43
    239. FIGURA 10 MERCADO GLOBAL DE SENSORES MEMS, POR MATERIAL, 2022 (% PARTICIPACIÓN) 47
    240. FIGURA 11 MERCADO GLOBAL DE SENSORES MEMS, POR MATERIAL, 2022 VS 2032 (MILLONES DE USD) 47
    241. FIGURA 12 GLOBAL MERCADO DE SENSORES MEMS POR TIPO, 2022 (% PARTICIPACIÓN) 50
    242. FIGURA 13 MERCADO GLOBAL DE SENSORES MEMS POR TIPO, 2022 VS 2032 (USD MILLONES) 50
    243. FIGURA 14 MERCADO GLOBAL DE SENSORES MEMS POR APLICACIÓN, 2022 (% PARTICIPACIÓN) 54
    244. FIGURA 15 MERCADO GLOBAL DE SENSORES MEMS POR APLICACIÓN, 2022 VS 2032 (USD MILLONES) 54
    245. FIGURA 16 MERCADO GLOBAL DE SENSORES MEMS POR REGIÓN, 2022 (% PARTICIPACIÓN) 57
    246. FIGURA 17 MERCADO GLOBAL DE SENSORES MEMS POR REGIÓN, 2022 VS 2032 (USD MILLONES) 57
    247. FIGURA 18 MERCADO DE SENSORES MEMS DE AMÉRICA DEL NORTE, POR PAÍS, 2022 (% PARTICIPACIÓN) 60
    248. FIGURA 19 MERCADO DE SENSORES MEMS DE AMÉRICA DEL NORTE, POR PAÍS, 2022 VS 2032 (MILLONES DE USD) 60
    249. FIGURA 20 MERCADO DE SENSORES MEMS DE AMÉRICA DEL NORTE, POR MATERIAL, 2024-2032 (MILLONES DE USD) 61
    250. FIGURA 21 MERCADO DE SENSORES MEMS DE AMÉRICA DEL NORTE, POR TIPO, 2024-2032 (MILLONES DE USD) 62
    251. FIGURA 22 MERCADO DE SENSORES MEMS DE AMÉRICA DEL NORTE, POR APLICACIÓN, 2024-2032 (MILLONES DE USD) 64
    252. FIGURA 23 MERCADO EUROPEO DE SENSORES MEMS, POR PAÍS, 2022 (% PARTICIPACIÓN) 75
    253. FIGURA 24 MERCADO EUROPEO DE SENSORES MEMS, POR PAÍS, 2022 VS 2032 (MILLONES DE USD) 75
    254. FIGURA 25 MERCADO EUROPEO DE SENSORES MEMS, POR MATERIAL, 2024-2032 (MILLONES DE USD) 77
    255. FIGURA 26 MERCADO EUROPEO DE SENSORES MEMS, POR TIPO, 2024-2032 (MILLONES DE USD) 78
    256. FIGURA 27 MERCADO EUROPEO DE SENSORES MEMS, POR APLICACIÓN, 2024-2032 (MILLONES DE USD) 79
    257. FIGURA 28 MERCADO DE SENSORES MEMS DE ASIA-PACÍFICO, POR PAÍS, 2022 (% PARTICIPACIÓN) 100
    258. FIGURA 29 MERCADO DE SENSORES MEMS DE ASIA-PACÍFICO, POR PAÍS, 2022 VS 2032 (MILLONES DE USD) 100
    259. FIGURA 30 MERCADO DE SENSORES MEMS DE ASIA-PACÍFICO, POR MATERIAL, 2024-2032 (MILLONES DE USD) 102
    260. FIGURA 31 MERCADO DE SENSORES MEMS DE ASIA-PACÍFICO, POR TIPO, 2024-2032 (MILLONES DE USD) 103
    261. FIGURA 32 MERCADO DE SENSORES MEMS DE ASIA-PACÍFICO, POR APLICACIÓN, 2024-2032 (MILLONES DE USD) 105
    262. FIGURA 33 ORIENTE MEDIO Y MERCADO DE SENSORES MEMS EN ÁFRICA, POR PAÍS, 2022 (% PARTICIPACIÓN) 121
    263. FIGURA 34 MERCADO DE SENSORES MEMS EN ORIENTE MEDIO Y ÁFRICA, POR PAÍS, 2022 VS 2032 (MILLONES DE USD) 122
    264. FIGURA 35 MERCADO DE SENSORES MEMS EN ORIENTE MEDIO Y ÁFRICA, POR MATERIAL, 2024-2032 (MILLONES DE USD) 123
    265. FIGURA 36 MERCADO DE SENSORES MEMS EN ORIENTE MEDIO Y ÁFRICA, POR TIPO, 2024-2032 (MILLONES DE USD) 124
    266. FIGURA 37 MERCADO DE SENSORES MEMS EN ORIENTE MEDIO Y ÁFRICA, POR TIPO, 2024-2032 (MILLONES DE USD) MERCADO DE SENSORES MEMS EN ÁFRICA, POR APLICACIÓN, 2024-2032 (MILLONES DE USD) 126
    267. FIGURA 38 MERCADO DE SENSORES MEMS EN SUDAMÉRICA, POR PAÍS, 2022 (% PARTICIPACIÓN) 136
    268. FIGURA 39 MERCADO DE SENSORES MEMS EN SUDAMÉRICA, POR PAÍS, 2022 VS 2032 (MILLONES DE USD) 137
    269. FIGURA 40 MERCADO DE SENSORES MEMS EN SUDAMÉRICA, POR MATERIAL, 2024-2032 (MILLONES DE USD) 138
    270. FIGURA 41 MERCADO DE SENSORES MEMS EN SUDAMÉRICA, POR TIPO, 2024-2032 (MILLONES DE USD) 139
    271. FIGURA 42 MEMS EN SUDAMÉRICA MERCADO DE SENSORES, POR APLICACIÓN, 2024-2032 (MILLONES DE USD) 140
    272. FIGURA 43 MERCADO GLOBAL DE SENSORES MEMS: REFERENCIA COMPETITIVA 152
    273. FIGURA 44 ANÁLISIS DE LA PARTICIPACIÓN DE LOS PROVEEDORES (2021, % PARTICIPACIÓN) 153
    274. FIGURA 45 ASE TECHNOLOGY HOLDING CO., LTD.: INSTANTÁNEA FINANCIERA 159
    275. FIGURA 46 ASE TECHNOLOGY HOLDING CO., LTD.: ANÁLISIS FODA 161
    276. FIGURA 47 AMS AG: INSTANTÁNEA FINANCIERA 162
    277. FIGURA 48 AMS AG: ANÁLISIS FODA 164
    278. FIGURA 49 ROBERT BOSCH GMBH: INFORMACIÓN FINANCIERA RESUMEN GENERAL 165
    279. FIGURA 50 ROBERT BOSCH GMBH: ANÁLISIS FODA 167
    280. FIGURA 51 QUALCOMM TECHNOLOGIES, INC.: RESUMEN FINANCIERO 169
    281. FIGURA 52 QUALCOMM TECHNOLOGIES, INC.: ANÁLISIS FODA 171
    282. FIGURA 53 SEIKO EPSON CORPORATION: RESUMEN FINANCIERO 172
    283. FIGURA 54 SEIKO EPSON CORPORATION: ANÁLISIS FODA 173
    284. FIGURA 55 TEXAS INSTRUMENTS INCORPORATED: RESUMEN FINANCIERO 175
    285. FIGURA 56 TEXAS INSTRUMENTS INCORPORATED: ANÁLISIS FODA 178
    286. FIGURA 57 TELEDYNE TECHNOLOGIES: INSTANTÁNEA DE LA INFORMACIÓN FINANCIERA 183
    287. FIGURA 58 TELEDYNE TECHNOLOGIES: ANÁLISIS FODA 185
    288. FIGURA 59 SONY CORPORATION: INSTANTÁNEA DE LA INFORMACIÓN FINANCIERA 187
    289. FIGURA 60 SONY CORPORATION: ANÁLISIS FODA 188
    290. FIGURA 61 TAIWAN SEMICONDUCTOR MANUFACTURING COMPANY LIMITED (TSMC): INSTANTÁNEA DE LA INFORMACIÓN FINANCIERA 190
    291. FIGURA 62 TAIWAN SEMICONDUCTOR MANUFACTURING COMPANY LIMITED (TSMC): ANÁLISIS FODA 191
    292. FIGURA 63 X-FAB SILICON FOUNDRIES SE: INFORMACIÓN FINANCIERA INSTANTÁNEA 192
    293. FIGURA 64 X-FAB SILICON FOUNDRIES SE: ANÁLISIS FODA 193
    294. FIGURA 65 INFINEON TECHNOLOGIES: INSTANTÁNEA FINANCIERA 196
    295. FIGURA 66 INFINEON TECHNOLOGIES: ANÁLISIS FODA 198
    296. FIGURA 67 ANALOG DEVICES: INSTANTÁNEA FINANCIERA 199
    297. FIGURA 68 ANALOG DEVICES: ANÁLISIS FODA 200
    298. FIGURA 69 DENSO CORPORATION: INSTANTÁNEA FINANCIERA 203
    299. FIGURA 70 DENSO CORPORATION: ANÁLISIS FODA 205
    300. FIGURA 71 AVAGO TECHNOLOGIES LTD (BROADCOM INC): RESUMEN FINANCIERO 207
    301. FIGURA 72 AVAGO TECHNOLOGIES LTD (BROADCOM INC): ANÁLISIS FODA 208
    302. FIGURA 73 SENSATA TECHNOLOGIES: RESUMEN FINANCIERO 209
    303. FIGURA 74 SENSATA TECHNOLOGIES: ANÁLISIS FODA 211
    304. FIGURA 75 MEASUREMENT SPECIALTIES INC (TE CONNECTIVITY): RESUMEN FINANCIERO 213
    305. FIGURA 76 MEASUREMENT SPECIALTIES INC (TE CONNECTIVITY): ANÁLISIS FODA 214
    306. FIGURA 77 STMICROELECTRONICS: RESUMEN FINANCIERO 216
    307. FIGURA 78 STMICROELECTRONICS: ANÁLISIS FODA 217

Segmentación del mercado de sensores MEMSSegmentación del mercado

Sensores MEMS globales, perspectivas por material (millones de USD, 2018-2032)
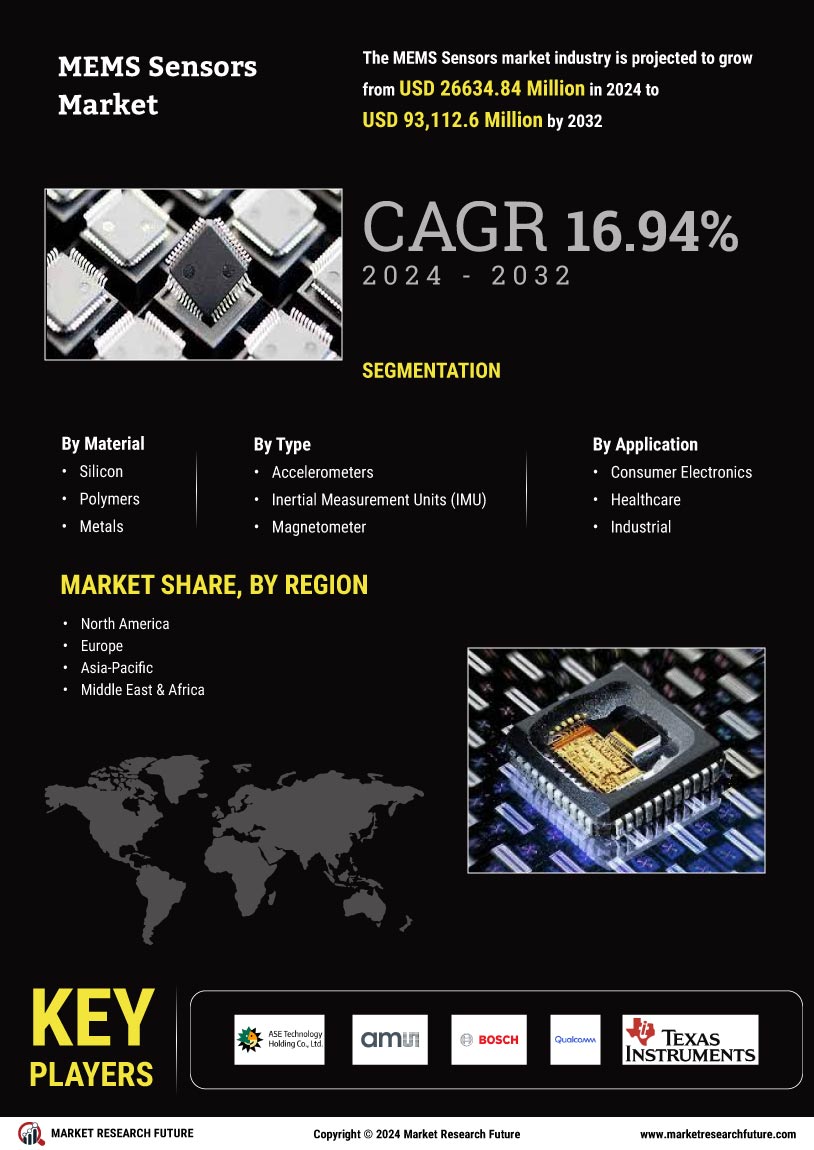
  • Silicio

  • Polímeros

  • Metales

  • Cerámica

Sensores MEMS globales, perspectivas por tipo (millones de USD, 2018-2032)

  • Acelerómetros

  • Unidades de medición inercial (IMU)

  • Magnetómetro

  • Presión e inercia Sensores

  • Micrófono MEMS

  • Sensores de temperatura

  • Otros

Sensores MEMS globales, por perspectiva de aplicación (millones de USD, 2018-2032)

  • Electrónica de consumo

  • Salud

  • Industria

  • Aeroespacial y Defensa

  • Automotriz

Perspectiva regional global de sensores MEMS (millones de USD, 2018-2032)

  • Perspectiva de Norteamérica (millones de USD, 2018-2032)

  • Perspectiva de sensores MEMS de Norteamérica por material (millones de USD, 2018-2032)

    • Silicio

    • Polímeros

    • Metales

    • Cerámica

  • Sensores MEMS de Norteamérica por tipo (millones de USD, 2018-2032)

    • Acelerómetros

    • Unidades de Medición Inercial (IMU)

    • Magnetómetro

    • Sensores de Presión e Inerciales

    • Micrófono MEMS

    • Sensores de Temperatura

    • Otros

  • Sensor MEMS en Norteamérica, por Perspectiva de Aplicación (Millones de USD, 2018-2032)

    • Consumidor Electrónica

    • Salud

    • Industria

    • Aeroespacial y Defensa

    • Automotriz

    • Perspectiva para EE. UU. (millones de USD, 2018-2032)

    • Perspectiva de sensores MEMS de EE. UU. por material (millones de USD, 2018-2032)

      • Silicio

      • Polímeros

      • Metales

      • Cerámica

    • Sensor MEMS de EE. UU. por tipo (millones de USD, 2018-2032)

      • Acelerómetros

      • Unidades de Medición Inercial (IMU)

      • Magnetómetro

      • Sensores de Presión e Inerciales

      • Micrófono MEMS

      • Sensores de Temperatura

      • Otros

    • Sensor MEMS en EE. UU., por Perspectiva de Aplicación (Millones de USD, 2018-2032)

      • Consumidor Electrónica

      • Salud

      • Industria

      • Aeroespacial y Defensa

      • Automotriz

    • Perspectivas para Canadá (millones de USD, 2018-2032)

    • Perspectivas de sensores MEMS en Canadá, por material (millones de USD, 2018-2032)

      • Silicio

      • Polímeros

      • Metales

      • Cerámica

    • Sensores MEMS en Canadá, por tipo (millones de USD, 2018-2032)

      • Acelerómetros

      • Unidades de Medición Inercial (IMU)

      • Magnetómetro

      • Sensores de Presión e Inerciales

      • Micrófono MEMS

      • Sensores de Temperatura

      • Otros

    • Sensor MEMS en Canadá, por Perspectiva de Aplicación (Millones de USD, 2018-2032)

      • Consumidor Electrónica

      • Salud

      • Industria

      • Aeroespacial y Defensa

      • Automotriz

    • Perspectivas para México (millones de USD, 2018-2032)

    • Perspectivas de sensores MEMS en México por material (millones de USD, 2018-2032)

      • Silicio

      • Polímeros

      • Metales

      • Cerámica

    • Sensores MEMS en México por tipo (millones de USD, 2018-2032)

      • Acelerómetros

      • Unidades de Medición Inercial (IMU)

      • Magnetómetro

      • Sensores de Presión e Inerciales

      • Micrófono MEMS

      • Sensores de Temperatura

      • Otros

    • Sensor MEMS en México, por Perspectiva de Aplicación (Millones de USD, 2018-2032)

      • Consumidor Electrónica

      • Salud

      • Industria

      • Aeroespacial y Defensa

      • Automoción

  • Perspectivas en Europa (millones de USD, 2018-2032)

  • Perspectivas de sensores MEMS en Europa por material (millones de USD, 2018-2032)

    • Silicio

    • Polímeros

    • Metales

    • Cerámica

  • Sensores MEMS en Europa por tipo (millones de USD, 2018-2032)

    • Acelerómetros

    • Unidades de Medición Inercial (IMU)

    • Magnetómetro

    • Sensores de Presión e Inerciales

    • Micrófono MEMS

    • Sensores de Temperatura

    • Otros

  • Sensor MEMS en Europa, por Perspectiva de Aplicación (Millones de USD, 2018-2032)

    • Consumidor Electrónica

    • Salud

    • Industria

    • Aeroespacial y Defensa

    • Automotriz

    • Perspectivas para Alemania (millones de USD, 2018-2032)

    • Perspectivas de sensores MEMS en Alemania por material (millones de USD, 2018-2032)

      • Silicio

      • Polímeros

      • Metales

      • Cerámica

    • Sensores MEMS en Alemania por tipo (millones de USD, 2018-2032)

      • Acelerómetros

      • Unidades de Medición Inercial (IMU)

      • Magnetómetro

      • Sensores de Presión e Inerciales

      • Micrófono MEMS

      • Sensores de Temperatura

      • Otros

    • Sensor MEMS en Alemania, por Perspectiva de Aplicación (Millones de USD, 2018-2032)

      • Consumidor Electrónica

      • Salud

      • Industria

      • Aeroespacial y Defensa

      • Automoción

    • Perspectivas para Francia (millones de USD, 2018-2032)

    • Perspectivas para sensores MEMS en Francia, por material (millones de USD, 2018-2032)

      • Silicio

      • Polímeros

      • Metales

      • Cerámica

    • Sensores MEMS en Francia, por tipo (millones de USD, 2018-2032)

      • Acelerómetros

      • Unidades de Medición Inercial (IMU)

      • Magnetómetro

      • Sensores de Presión e Inerciales

      • Micrófono MEMS

      • Sensores de Temperatura

      • Otros

    • Sensor MEMS en Francia, por Perspectiva de Aplicación (Millones de USD, 2018-2032)

      • Consumidor Electrónica

      • Salud

      • Industria

      • Aeroespacial y Defensa

      • Automoción

    • Perspectivas para el Reino Unido (millones de USD, 2018-2032)

    • Perspectivas de sensores MEMS en el Reino Unido por material (millones de USD, 2018-2032)

      • Silicio

      • Polímeros

      • Metales

      • Cerámica

    • Sensores MEMS en el Reino Unido por tipo (millones de USD, 2018-2032)

      • Acelerómetros

      • Unidades de Medición Inercial (IMU)

      • Magnetómetro

      • Sensores de Presión e Inerciales

      • Micrófono MEMS

      • Sensores de Temperatura

      • Otros

    • Sensor MEMS del Reino Unido, por Perspectiva de Aplicación (Millones de USD, 2018-2032)

      • Consumidor Electrónica

      • Salud

      • Industria

      • Aeroespacial y Defensa

      • Automoción

    • Perspectivas para el resto de Europa (millones de USD, 2018-2032)

    • Perspectivas de sensores MEMS para el resto de Europa por material (millones de USD, 2018-2032)

      • Silicio

      • Polímeros

      • Metales

      • Cerámica

    • Sensores MEMS para el resto de Europa por tipo (millones de USD, 2018-2032)

      • Acelerómetros

      • Unidades de Medición Inercial (IMU)

      • Magnetómetro

      • Sensores de Presión e Inerciales

      • Micrófono MEMS

      • Sensores de Temperatura

      • Otros

    • Sensor MEMS en el Resto de Europa, por Perspectiva de Aplicación (Millones de USD, 2018-2032)

      • Consumidor Electrónica

      • Salud

      • Industria

      • Aeroespacial y Defensa

      • Automotriz

  • Perspectivas para Asia-Pacífico (millones de USD, 2018-2032)

  • Perspectivas de sensores MEMS para Asia-Pacífico por material (millones de USD, 2018-2032)

    • Silicio

    • Polímeros

    • Metales

    • Cerámica

  • Sensores MEMS para Asia-Pacífico por tipo (millones de USD, 2018-2032)

    • Acelerómetros

    • Unidades de Medición Inercial (IMU)

    • Magnetómetro

    • Sensores de Presión e Inerciales

    • Micrófono MEMS

    • Sensores de Temperatura

    • Otros

  • Sensor MEMS en Asia-Pacífico, por Perspectiva de Aplicación (Millones de USD, 2018-2032)

    • Consumidor Electrónica

    • Salud

    • Industria

    • Aeroespacial y Defensa

    • Automotriz

    • Perspectivas de China (millones de USD, 2018-2032)

    • Perspectivas de sensores MEMS de China por material (millones de USD, 2018-2032)

      • Silicio

      • Polímeros

      • Metales

      • Cerámica

    • Sensores MEMS de China por tipo (millones de USD, 2018-2032)

      • Acelerómetros

      • Unidades de Medición Inercial (IMU)

      • Magnetómetro

      • Sensores de Presión e Inerciales

      • Micrófono MEMS

      • Sensores de Temperatura

      • Otros

    • Sensor MEMS en China, por Perspectiva de Aplicación (Millones de USD, 2018-2032)

      • Consumidor Electrónica

      • Salud

      • Industria

      • Aeroespacial y Defensa

      • Automotriz

    • Perspectivas para India (millones de USD, 2018-2032)

    • Perspectivas de sensores MEMS en India, por material (millones de USD, 2018-2032)

      • Silicio

      • Polímeros

      • Metales

      • Cerámica

    • Sensores MEMS en India, por tipo (millones de USD, 2018-2032)

      • Acelerómetros

      • Unidades de Medición Inercial (IMU)

      • Magnetómetro

      • Sensores de Presión e Inerciales

      • Micrófono MEMS

      • Sensores de Temperatura

      • Otros

    • Sensor MEMS en India, por Perspectiva de Aplicación (Millones de USD, 2018-2032)

      • Consumidor Electrónica

      • Salud

      • Industria

      • Aeroespacial y Defensa

      • Automotriz

    • Perspectivas para Japón (millones de USD, 2018-2032)

    • Perspectivas de sensores MEMS en Japón por material (millones de USD, 2018-2032)

      • Silicio

      • Polímeros

      • Metales

      • Cerámica

    • Sensores MEMS en Japón por tipo (millones de USD, 2018-2032)

      • Acelerómetros

      • Unidades de medición inercial (IMU)

      • Magnetómetro

      • Sensores de presión e inercia

      • Micrófono MEMS

      • Sensores de temperatura

      • Otros

    • Sensor MEMS en Japón, por perspectiva de aplicación (millones de USD, 2018-2032)

      • Electrónica de consumo

      • Salud

      • Industria

      • Aeroespacial y Defensa

      • Automotriz

    • Perspectiva para el resto de Asia-Pacífico (millones de USD, 2018-2032)

    • Perspectiva de sensores MEMS para el resto de Asia-Pacífico, por material (millones de USD, 2018-2032)

      • Silicio

      • Polímeros

      • Metales

      • Cerámica

    • Sensores MEMS para el resto de Asia-Pacífico, por tipo (millones de USD, 2018-2032)

      • Acelerómetros

      • Unidades de Medición Inercial (IMU)

      • Magnetómetro

      • Sensores de Presión e Inerciales

      • Micrófono MEMS

      • Sensores de Temperatura

      • Otros

    • Sensores MEMS para el Resto de Asia-Pacífico, por Perspectiva de Aplicación (Millones de USD, 2018-2032)

      • Consumidor Electrónica

      • Salud

      • Industria

      • Aeroespacial y Defensa

      • Automotriz

  • Perspectiva para el resto del mundo (millones de USD, 2018-2032)

  • Perspectiva de sensores MEMS para el resto del mundo, por material (millones de USD, 2018-2032)

    • Silicio

    • Polímeros

    • Metales

    • Cerámica

  • Sensores MEMS para el resto del mundo, por tipo (millones de USD, 2018-2032)

    • Acelerómetros

    • Unidades de Medición Inercial (IMU)

    • Magnetómetro

    • Sensores de Presión e Inerciales

    • Micrófono MEMS

    • Sensores de Temperatura

    • Otros

  • Sensores MEMS en el Resto del Mundo, por Perspectiva de Aplicación (Millones de USD, 2018-2032)

      • Consumidor Electrónica

      • Salud

      • Industria

      • Aeroespacial y Defensa

      • Automotriz

    • Perspectivas para Oriente Medio y África (millones de USD, 2018-2032)

    • Oriente Medio y Sensores MEMS en África, por perspectiva de materiales (millones de USD, 2018-2032)

      • Silicio

      • Polímeros

      • Metales

      • Cerámica

    • Oriente Medio y Sensores MEMS en África, por tipo (millones de USD, 2018-2032)

      • Acelerómetros

      • Unidades de medición inercial (IMU)

      • Magnetómetro

      • Sensores de presión e inerciales

      • Micrófono MEMS

      • Sensores de temperatura

      • Otros

    • Oriente Medio y Sensores MEMS en África, por perspectiva de aplicación (millones de USD, 2018-2032)

      • Electrónica de consumo

      • Salud

      • Industria

      • Aeroespacial y Defensa

      • Automotriz

    • Perspectiva de Sudamérica (millones de USD, 2018-2032)

    • Perspectiva de sensores MEMS en Sudamérica, por material (millones de USD, 2018-2032)

      • Silicio

      • Polímeros

      • Metales

      • Cerámica

    • Sensores MEMS en Sudamérica, por tipo (millones de USD, 2018-2032)

      • Acelerómetros

      • Unidades de Medición Inercial (IMU)

      • Magnetómetro

      • Sensores de Presión e Inerciales

      • Micrófono MEMS

      • Sensores de Temperatura

      • Otros

    • Sensores MEMS en Sudamérica, por Perspectiva de Aplicación (Millones de USD, 2018-2032)

      • Consumidor Electrónica

      • Salud

      • Industria

      • Aeroespacial y Defensa

      • Automotriz