Request Free Sample ×

Kindly complete the form below to receive a free sample of this Report

* Please use a valid business email

Leading companies partner with us for data-driven Insights

clients tt-cursor
Hero Background

Marché des Tubes Enroulés

ID: MRFR/EnP/1206-CR
190 Pages
Chitranshi Jaiswal
Last Updated: April 24, 2026
Rapport de recherche sur le marché des tubes enroulés Informations par type de service (Intervention sur puits, Forage, Autres), par application (Terrestre, Offshore) et par région (Amérique du Nord, Europe, Asie-Pacifique et Reste du monde) – Prévisions du marché jusqu'en 2035
Download PDF ×

We do not share your information with anyone. However, we may send you emails based on your report interest from time to time. You may contact us at any time to opt-out.

  1. SECTION I : RÉSUMÉ EXÉCUTIF ET POINTS CLÉS
    1. 1.1 RÉSUMÉ EXÉCUTIF
      1. 1.1.1 Aperçu du marché
      2. 1.1.2 Conclusions clés
      3. 1.1.3 Segmentation du marché
      4. 1.1.4 Paysage concurrentiel
      5. 1.1.5 Défis et opportunités
      6. 1.1.6 Perspectives futures 2
  2. SECTION II : DÉLIMITATION, MÉTHODOLOGIE ET STRUCTURE DU MARCHÉ
    1. 2.1 INTRODUCTION AU MARCHÉ
      1. 2.1.1 Définition
      2. 2.1.2 Portée de l'étude
        1. 2.1.2.1 Objectif de recherche
        2. 2.1.2.2 Hypothèse
        3. 2.1.2.3 Limitations
    2. 2.2 MÉTHODOLOGIE DE RECHERCHE
      1. 2.2.1 Aperçu
      2. 2.2.2 Exploration de données
      3. 2.2.3 Recherche secondaire
      4. 2.2.4 Recherche primaire
        1. 2.2.4.1 Interviews primaires et processus de collecte d'informations
        2. 2.2.4.2 Répartition des répondants principaux
      5. 2.2.5 Modèle de prévision
      6. 2.2.6 Estimation de la taille du marché
        1. 2.2.6.1 Approche ascendante
        2. 2.2.6.2 Approche descendante
      7. 2.2.7 Triangulation des données
      8. 2.2.8 Validation 3
  3. SECTION III : ANALYSE QUALITATIVE
    1. 3.1 DYNAMIQUE DU MARCHÉ
      1. 3.1.1 Aperçu
      2. 3.1.2 Facteurs moteurs
      3. 3.1.3 Contraintes
      4. 3.1.4 Opportunités
    2. 3.2 ANALYSE DES FACTEURS DU MARCHÉ
      1. 3.2.1 Analyse de la chaîne de valeur
      2. 3.2.2 Analyse des Cinq Forces de Porter
        1. 3.2.2.1 Pouvoir de négociation des fournisseurs
        2. 3.2.2.2 Pouvoir de négociation des acheteurs
        3. 3.2.2.3 Menace des nouveaux entrants
        4. 3.2.2.4 Menace des substituts
        5. 3.2.2.5 Intensité de la rivalité
      3. 3.2.3 Analyse de l'impact du COVID-19
        1. 3.2.3.1 Analyse de l'impact sur le marché
        2. 3.2.3.2 Impact régional
        3. 3.2.3.3 Analyse des opportunités et des menaces 4
  4. SECTION IV : ANALYSE QUANTITATIVE
    1. 4.1 Énergie & Puissance, PAR Type de service (milliards USD)
      1. 4.1.1 Intervention sur puits
      2. 4.1.2 Forage
      3. 4.1.3 Autres
    2. 4.2 Énergie & Puissance, PAR Application (milliards USD)
      1. 4.2.1 Onshore
      2. 4.2.2 Offshore
    3. 4.3 Énergie & Puissance, PAR Région (milliards USD)
      1. 4.3.1 Amérique du Nord
        1. 4.3.1.1 États-Unis
        2. 4.3.1.2 Canada
      2. 4.3.2 Europe
        1. 4.3.2.1 Allemagne
        2. 4.3.2.2 Royaume-Uni
        3. 4.3.2.3 France
        4. 4.3.2.4 Russie
        5. 4.3.2.5 Italie
        6. 4.3.2.6 Espagne
        7. 4.3.2.7 Reste de l'Europe
      3. 4.3.3 APAC
        1. 4.3.3.1 Chine
        2. 4.3.3.2 Inde
        3. 4.3.3.3 Japon
        4. 4.3.3.4 Corée du Sud
        5. 4.3.3.5 Malaisie
        6. 4.3.3.6 Thaïlande
        7. 4.3.3.7 Indonésie
        8. 4.3.3.8 Reste de l'APAC
      4. 4.3.4 Amérique du Sud
        1. 4.3.4.1 Brésil
        2. 4.3.4.2 Mexique
        3. 4.3.4.3 Argentine
        4. 4.3.4.4 Reste de l'Amérique du Sud
      5. 4.3.5 MEA
        1. 4.3.5.1 Pays du CCG
        2. 4.3.5.2 Afrique du Sud
        3. 4.3.5.3 Reste de la MEA 5
  5. SECTION V : ANALYSE CONCURRENTIELLE
    1. 5.1 Paysage concurrentiel
      1. 5.1.1 Aperçu
      2. 5.1.2 Analyse concurrentielle
      3. 5.1.3 Analyse de la part de marché
      4. 5.1.4 Stratégie de croissance majeure dans l'Énergie & Puissance
      5. 5.1.5 Évaluation comparative
      6. 5.1.6 Acteurs principaux en termes de nombre de développements dans l'Énergie & Puissance
      7. 5.1.7 Développements clés et stratégies de croissance
        1. 5.1.7.1 Lancement de nouveaux produits/Déploiement de services
        2. 5.1.7.2 Fusions & Acquisitions
        3. 5.1.7.3 Coentreprises
      8. 5.1.8 Matrice financière des principaux acteurs
        1. 5.1.8.1 Ventes et revenu d'exploitation
        2. 5.1.8.2 Dépenses de R&D des principaux acteurs. 2023
    2. 5.2 Profils d'entreprise
      1. 5.2.1 Schlumberger (États-Unis)
        1. 5.2.1.1 Aperçu financier
        2. 5.2.1.2 Produits offerts
        3. 5.2.1.3 Développements clés
        4. 5.2.1.4 Analyse SWOT
        5. 5.2.1.5 Stratégies clés
      2. 5.2.2 Halliburton (États-Unis)
        1. 5.2.2.1 Aperçu financier
        2. 5.2.2.2 Produits offerts
        3. 5.2.2.3 Développements clés
        4. 5.2.2.4 Analyse SWOT
        5. 5.2.2.5 Stratégies clés
      3. 5.2.3 Baker Hughes (États-Unis)
        1. 5.2.3.1 Aperçu financier
        2. 5.2.3.2 Produits offerts
        3. 5.2.3.3 Développements clés
        4. 5.2.3.4 Analyse SWOT
        5. 5.2.3.5 Stratégies clés
      4. 5.2.4 Weatherford International (États-Unis)
        1. 5.2.4.1 Aperçu financier
        2. 5.2.4.2 Produits offerts
        3. 5.2.4.3 Développements clés
        4. 5.2.4.4 Analyse SWOT
        5. 5.2.4.5 Stratégies clés
      5. 5.2.5 National Oilwell Varco (États-Unis)
        1. 5.2.5.1 Aperçu financier
        2. 5.2.5.2 Produits offerts
        3. 5.2.5.3 Développements clés
        4. 5.2.5.4 Analyse SWOT
        5. 5.2.5.5 Stratégies clés
      6. 5.2.6 Superior Energy Services (États-Unis)
        1. 5.2.6.1 Aperçu financier
        2. 5.2.6.2 Produits offerts
        3. 5.2.6.3 Développements clés
        4. 5.2.6.4 Analyse SWOT
        5. 5.2.6.5 Stratégies clés
      7. 5.2.7 C&J Energy Services (États-Unis)
        1. 5.2.7.1 Aperçu financier
        2. 5.2.7.2 Produits offerts
        3. 5.2.7.3 Développements clés
        4. 5.2.7.4 Analyse SWOT
        5. 5.2.7.5 Stratégies clés
      8. 5.2.8 Trican Well Service (Canada)
        1. 5.2.8.1 Aperçu financier
        2. 5.2.8.2 Produits offerts
        3. 5.2.8.3 Développements clés
        4. 5.2.8.4 Analyse SWOT
        5. 5.2.8.5 Stratégies clés
      9. 5.2.9 Aker Solutions (Norvège)
        1. 5.2.9.1 Aperçu financier
        2. 5.2.9.2 Produits offerts
        3. 5.2.9.3 Développements clés
        4. 5.2.9.4 Analyse SWOT
        5. 5.2.9.5 Stratégies clés
    3. 5.3 Annexe
      1. 5.3.1 Références
      2. 5.3.2 Rapports connexes 6 LISTE DES FIGURES
    4. 6.1 SYNOPSIS DU MARCHÉ
    5. 6.2 ANALYSE DU MARCHÉ EN AMÉRIQUE DU NORD
    6. 6.3 ANALYSE DU MARCHÉ AUX ÉTATS-UNIS PAR TYPE DE SERVICE
    7. 6.4 ANALYSE DU MARCHÉ AUX ÉTATS-UNIS PAR APPLICATION
    8. 6.5 ANALYSE DU MARCHÉ AU CANADA PAR TYPE DE SERVICE
    9. 6.6 ANALYSE DU MARCHÉ AU CANADA PAR APPLICATION
    10. 6.7 ANALYSE DU MARCHÉ EN EUROPE
    11. 6.8 ANALYSE DU MARCHÉ EN ALLEMAGNE PAR TYPE DE SERVICE
    12. 6.9 ANALYSE DU MARCHÉ EN ALLEMAGNE PAR APPLICATION
    13. 6.10 ANALYSE DU MARCHÉ AU ROYAUME-UNI PAR TYPE DE SERVICE
    14. 6.11 ANALYSE DU MARCHÉ AU ROYAUME-UNI PAR APPLICATION
    15. 6.12 ANALYSE DU MARCHÉ EN FRANCE PAR TYPE DE SERVICE
    16. 6.13 ANALYSE DU MARCHÉ EN FRANCE PAR APPLICATION
    17. 6.14 ANALYSE DU MARCHÉ EN RUSSIE PAR TYPE DE SERVICE
    18. 6.15 ANALYSE DU MARCHÉ EN RUSSIE PAR APPLICATION
    19. 6.16 ANALYSE DU MARCHÉ EN ITALIE PAR TYPE DE SERVICE
    20. 6.17 ANALYSE DU MARCHÉ EN ITALIE PAR APPLICATION
    21. 6.18 ANALYSE DU MARCHÉ EN ESPAGNE PAR TYPE DE SERVICE
    22. 6.19 ANALYSE DU MARCHÉ EN ESPAGNE PAR APPLICATION
    23. 6.20 ANALYSE DU MARCHÉ DANS LE RESTE DE L'EUROPE PAR TYPE DE SERVICE
    24. 6.21 ANALYSE DU MARCHÉ DANS LE RESTE DE L'EUROPE PAR APPLICATION
    25. 6.22 ANALYSE DU MARCHÉ EN APAC
    26. 6.23 ANALYSE DU MARCHÉ EN CHINE PAR TYPE DE SERVICE
    27. 6.24 ANALYSE DU MARCHÉ EN CHINE PAR APPLICATION
    28. 6.25 ANALYSE DU MARCHÉ EN INDE PAR TYPE DE SERVICE
    29. 6.26 ANALYSE DU MARCHÉ EN INDE PAR APPLICATION
    30. 6.27 ANALYSE DU MARCHÉ AU JAPON PAR TYPE DE SERVICE
    31. 6.28 ANALYSE DU MARCHÉ AU JAPON PAR APPLICATION
    32. 6.29 ANALYSE DU MARCHÉ EN CORÉE DU SUD PAR TYPE DE SERVICE
    33. 6.30 ANALYSE DU MARCHÉ EN CORÉE DU SUD PAR APPLICATION
    34. 6.31 ANALYSE DU MARCHÉ EN MALAYSIE PAR TYPE DE SERVICE
    35. 6.32 ANALYSE DU MARCHÉ EN MALAYSIE PAR APPLICATION
    36. 6.33 ANALYSE DU MARCHÉ EN THAÏLANDE PAR TYPE DE SERVICE
    37. 6.34 ANALYSE DU MARCHÉ EN THAÏLANDE PAR APPLICATION
    38. 6.35 ANALYSE DU MARCHÉ EN INDONÉSIE PAR TYPE DE SERVICE
    39. 6.36 ANALYSE DU MARCHÉ EN INDONÉSIE PAR APPLICATION
    40. 6.37 ANALYSE DU MARCHÉ DANS LE RESTE DE L'APAC PAR TYPE DE SERVICE
    41. 6.38 ANALYSE DU MARCHÉ DANS LE RESTE DE L'APAC PAR APPLICATION
    42. 6.39 ANALYSE DU MARCHÉ EN AMÉRIQUE DU SUD
    43. 6.40 ANALYSE DU MARCHÉ AU BRÉSIL PAR TYPE DE SERVICE
    44. 6.41 ANALYSE DU MARCHÉ AU BRÉSIL PAR APPLICATION
    45. 6.42 ANALYSE DU MARCHÉ AU MEXIQUE PAR TYPE DE SERVICE
    46. 6.43 ANALYSE DU MARCHÉ AU MEXIQUE PAR APPLICATION
    47. 6.44 ANALYSE DU MARCHÉ EN ARGENTINE PAR TYPE DE SERVICE
    48. 6.45 ANALYSE DU MARCHÉ EN ARGENTINE PAR APPLICATION
    49. 6.46 ANALYSE DU MARCHÉ DANS LE RESTE DE L'AMÉRIQUE DU SUD PAR TYPE DE SERVICE
    50. 6.47 ANALYSE DU MARCHÉ DANS LE RESTE DE L'AMÉRIQUE DU SUD PAR APPLICATION
    51. 6.48 ANALYSE DU MARCHÉ EN MEA
    52. 6.49 ANALYSE DU MARCHÉ DANS LES PAYS DU CCG PAR TYPE DE SERVICE
    53. 6.50 ANALYSE DU MARCHÉ DANS LES PAYS DU CCG PAR APPLICATION
    54. 6.51 ANALYSE DU MARCHÉ EN AFRIQUE DU SUD PAR TYPE DE SERVICE
    55. 6.52 ANALYSE DU MARCHÉ EN AFRIQUE DU SUD PAR APPLICATION
    56. 6.53 ANALYSE DU MARCHÉ DANS LE RESTE DE LA MEA PAR TYPE DE SERVICE
    57. 6.54 ANALYSE DU MARCHÉ DANS LE RESTE DE LA MEA PAR APPLICATION
    58. 6.55 CRITÈRES D'ACHAT CLÉS DE L'ÉNERGIE & PUISSANCE
    59. 6.56 PROCESSUS DE RECHERCHE DE MRFR
    60. 6.57 ANALYSE DRO DE L'ÉNERGIE & PUISSANCE
    61. 6.58 ANALYSE D'IMPACT DES FACTEURS MOTRICES : ÉNERGIE & PUISSANCE
    62. 6.59 ANALYSE D'IMPACT DES CONTRAINTES : ÉNERGIE & PUISSANCE
    63. 6.60 CHAÎNE D'APPROVISIONNEMENT / VALEUR : ÉNERGIE & PUISSANCE
    64. 6.61 ÉNERGIE & PUISSANCE, PAR TYPE DE SERVICE, 2024 (% PART)
    65. 6.62 ÉNERGIE & PUISSANCE, PAR TYPE DE SERVICE, 2024 À 2035 (milliards USD)
    66. 6.63 ÉNERGIE & PUISSANCE, PAR APPLICATION, 2024 (% PART)
    67. 6.64 ÉNERGIE & PUISSANCE, PAR APPLICATION, 2024 À 2035 (milliards USD)
    68. 6.65 ÉVALUATION COMPARATIVE DES PRINCIPAUX CONCURRENTS 7 LISTE DES TABLEAUX
    69. 7.1 LISTE DES HYPOTHÈSES
    70. 7.2 ESTIMATIONS DE TAILLE DU MARCHÉ EN AMÉRIQUE DU NORD ; PRÉVISION
      1. 7.2.1 PAR TYPE DE SERVICE, 2025-2035 (milliards USD)
      2. 7.2.2 PAR APPLICATION, 2025-2035 (milliards USD)
    71. 7.3 ESTIMATIONS DE TAILLE DU MARCHÉ AUX ÉTATS-UNIS ; PRÉVISION
      1. 7.3.1 PAR TYPE DE SERVICE, 2025-2035 (milliards USD)
      2. 7.3.2 PAR APPLICATION, 2025-2035 (milliards USD)
    72. 7.4 ESTIMATIONS DE TAILLE DU MARCHÉ AU CANADA ; PRÉVISION
      1. 7.4.1 PAR TYPE DE SERVICE, 2025-2035 (milliards USD)
      2. 7.4.2 PAR APPLICATION, 2025-2035 (milliards USD)
    73. 7.5 ESTIMATIONS DE TAILLE DU MARCHÉ EN EUROPE ; PRÉVISION
      1. 7.5.1 PAR TYPE DE SERVICE, 2025-2035 (milliards USD)
      2. 7.5.2 PAR APPLICATION, 2025-2035 (milliards USD)
    74. 7.6 ESTIMATIONS DE TAILLE DU MARCHÉ EN ALLEMAGNE ; PRÉVISION
      1. 7.6.1 PAR TYPE DE SERVICE, 2025-2035 (milliards USD)
      2. 7.6.2 PAR APPLICATION, 2025-2035 (milliards USD)
    75. 7.7 ESTIMATIONS DE TAILLE DU MARCHÉ AU ROYAUME-UNI ; PRÉVISION
      1. 7.7.1 PAR TYPE DE SERVICE, 2025-2035 (milliards USD)
      2. 7.7.2 PAR APPLICATION, 2025-2035 (milliards USD)
    76. 7.8 ESTIMATIONS DE TAILLE DU MARCHÉ EN FRANCE ; PRÉVISION
      1. 7.8.1 PAR TYPE DE SERVICE, 2025-2035 (milliards USD)
      2. 7.8.2 PAR APPLICATION, 2025-2035 (milliards USD)
    77. 7.9 ESTIMATIONS DE TAILLE DU MARCHÉ EN RUSSIE ; PRÉVISION
      1. 7.9.1 PAR TYPE DE SERVICE, 2025-2035 (milliards USD)
      2. 7.9.2 PAR APPLICATION, 2025-2035 (milliards USD)
    78. 7.10 ESTIMATIONS DE TAILLE DU MARCHÉ EN ITALIE ; PRÉVISION
      1. 7.10.1 PAR TYPE DE SERVICE, 2025-2035 (milliards USD)
      2. 7.10.2 PAR APPLICATION, 2025-2035 (milliards USD)
    79. 7.11 ESTIMATIONS DE TAILLE DU MARCHÉ EN ESPAGNE ; PRÉVISION
      1. 7.11.1 PAR TYPE DE SERVICE, 2025-2035 (milliards USD)
      2. 7.11.2 PAR APPLICATION, 2025-2035 (milliards USD)
    80. 7.12 ESTIMATIONS DE TAILLE DU MARCHÉ DANS LE RESTE DE L'EUROPE ; PRÉVISION
      1. 7.12.1 PAR TYPE DE SERVICE, 2025-2035 (milliards USD)
      2. 7.12.2 PAR APPLICATION, 2025-2035 (milliards USD)
    81. 7.13 ESTIMATIONS DE TAILLE DU MARCHÉ EN APAC ; PRÉVISION
      1. 7.13.1 PAR TYPE DE SERVICE, 2025-2035 (milliards USD)
      2. 7.13.2 PAR APPLICATION, 2025-2035 (milliards USD)
    82. 7.14 ESTIMATIONS DE TAILLE DU MARCHÉ EN CHINE ; PRÉVISION
      1. 7.14.1 PAR TYPE DE SERVICE, 2025-2035 (milliards USD)
      2. 7.14.2 PAR APPLICATION, 2025-2035 (milliards USD)
    83. 7.15 ESTIMATIONS DE TAILLE DU MARCHÉ EN INDE ; PRÉVISION
      1. 7.15.1 PAR TYPE DE SERVICE, 2025-2035 (milliards USD)
      2. 7.15.2 PAR APPLICATION, 2025-2035 (milliards USD)
    84. 7.16 ESTIMATIONS DE TAILLE DU MARCHÉ AU JAPON ; PRÉVISION
      1. 7.16.1 PAR TYPE DE SERVICE, 2025-2035 (milliards USD)
      2. 7.16.2 PAR APPLICATION, 2025-2035 (milliards USD)
    85. 7.17 ESTIMATIONS DE TAILLE DU MARCHÉ EN CORÉE DU SUD ; PRÉVISION
      1. 7.17.1 PAR TYPE DE SERVICE, 2025-2035 (milliards USD)
      2. 7.17.2 PAR APPLICATION, 2025-2035 (milliards USD)
    86. 7.18 ESTIMATIONS DE TAILLE DU MARCHÉ EN MALAYSIE ; PRÉVISION
      1. 7.18.1 PAR TYPE DE SERVICE, 2025-2035 (milliards USD)
      2. 7.18.2 PAR APPLICATION, 2025-2035 (milliards USD)
    87. 7.19 ESTIMATIONS DE TAILLE DU MARCHÉ EN THAÏLANDE ; PRÉVISION
      1. 7.19.1 PAR TYPE DE SERVICE, 2025-2035 (milliards USD)
      2. 7.19.2 PAR APPLICATION, 2025-2035 (milliards USD)
    88. 7.20 ESTIMATIONS DE TAILLE DU MARCHÉ EN INDONÉSIE ; PRÉVISION
      1. 7.20.1 PAR TYPE DE SERVICE, 2025-2035 (milliards USD)
      2. 7.20.2 PAR APPLICATION, 2025-2035 (milliards USD)
    89. 7.21 ESTIMATIONS DE TAILLE DU MARCHÉ DANS LE RESTE DE L'APAC ; PRÉVISION
      1. 7.21.1 PAR TYPE DE SERVICE, 2025-2035 (milliards USD)
      2. 7.21.2 PAR APPLICATION, 2025-2035 (milliards USD)
    90. 7.22 ESTIMATIONS DE TAILLE DU MARCHÉ EN AMÉRIQUE DU SUD ; PRÉVISION
      1. 7.22.1 PAR TYPE DE SERVICE, 2025-2035 (milliards USD)
      2. 7.22.2 PAR APPLICATION, 2025-2035 (milliards USD)
    91. 7.23 ESTIMATIONS DE TAILLE DU MARCHÉ AU BRÉSIL ; PRÉVISION
      1. 7.23.1 PAR TYPE DE SERVICE, 2025-2035 (milliards USD)
      2. 7.23.2 PAR APPLICATION, 2025-2035 (milliards USD)
    92. 7.24 ESTIMATIONS DE TAILLE DU MARCHÉ AU MEXIQUE ; PRÉVISION
      1. 7.24.1 PAR TYPE DE SERVICE, 2025-2035 (milliards USD)
      2. 7.24.2 PAR APPLICATION, 2025-2035 (milliards USD)
    93. 7.25 ESTIMATIONS DE TAILLE DU MARCHÉ EN ARGENTINE ; PRÉVISION
      1. 7.25.1 PAR TYPE DE SERVICE, 2025-2035 (milliards USD)
      2. 7.25.2 PAR APPLICATION, 2025-2035 (milliards USD)
    94. 7.26 ESTIMATIONS DE TAILLE DU MARCHÉ DANS LE RESTE DE L'AMÉRIQUE DU SUD ; PRÉVISION
      1. 7.26.1 PAR TYPE DE SERVICE, 2025-2035 (milliards USD)
      2. 7.26.2 PAR APPLICATION, 2025-2035 (milliards USD)
    95. 7.27 ESTIMATIONS DE TAILLE DU MARCHÉ EN MEA ; PRÉVISION
      1. 7.27.1 PAR TYPE DE SERVICE, 2025-2035 (milliards USD)
      2. 7.27.2 PAR APPLICATION, 2025-2035 (milliards USD)
    96. 7.28 ESTIMATIONS DE TAILLE DU MARCHÉ DANS LES PAYS DU CCG ; PRÉVISION
      1. 7.28.1 PAR TYPE DE SERVICE, 2025-2035 (milliards USD)
      2. 7.28.2 PAR APPLICATION, 2025-2035 (milliards USD)
    97. 7.29 ESTIMATIONS DE TAILLE DU MARCHÉ EN AFRIQUE DU SUD ; PRÉVISION
      1. 7.29.1 PAR TYPE DE SERVICE, 2025-2035 (milliards USD)
      2. 7.29.2 PAR APPLICATION, 2025-2035 (milliards USD)
    98. 7.30 ESTIMATIONS DE TAILLE DU MARCHÉ DANS LE RESTE DE LA MEA ; PRÉVISION
      1. 7.30.1 PAR TYPE DE SERVICE, 2025-2035 (milliards USD)
      2. 7.30.2 PAR APPLICATION, 2025-2035 (milliards USD)
    99. 7.31 LANCEMENT DE PRODUIT/DÉVELOPPEMENT DE PRODUIT/APPROBATION
    100. 7.32 ACQUISITION/PARTENARIAT

Segmentation du marché des tubages enroulés

Perspectives par type de service de tubage enroulé (millions USD, 2018-2030)

Intervention sur le puits

Forage

Autres

Perspectives par application de tubage enroulé (millions USD, 2018-2030)

Terrestre

Offshore

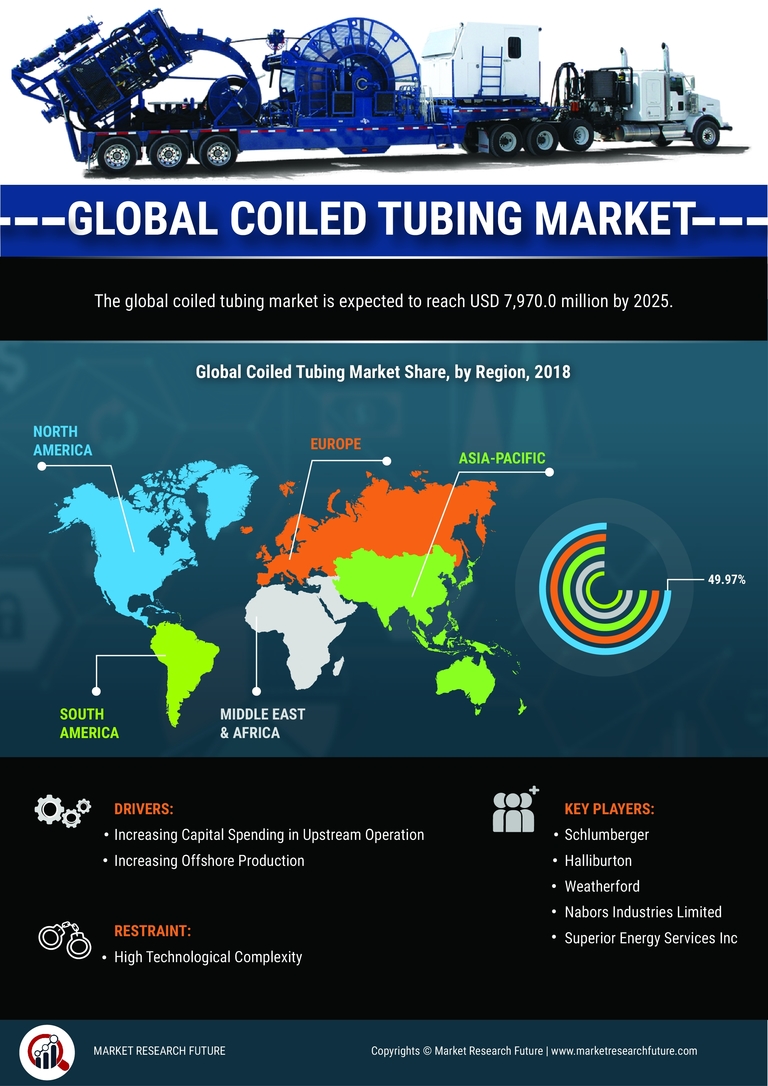
Perspectives régionales de tubage enroulé (millions USD, 2018-2030)

Perspectives de l'Amérique du Nord (millions USD, 2018-2030)

Tubage enroulé en Amérique du Nord par type de service

Intervention sur le puits

Forage

Autres

Tubage enroulé en Amérique du Nord par application

Terrestre

Offshore

Perspectives des États-Unis (millions USD, 2018-2030)

Tubage enroulé aux États-Unis par type de service

Intervention sur le puits

Forage

Autres

Tubage enroulé aux États-Unis par application

Terrestre

Offshore

Perspectives du CANADA (millions USD, 2018-2030)

Tubage enroulé au CANADA par type de service

Intervention sur le puits

Forage

Autres

Tubage enroulé au CANADA par application

Terrestre

Offshore

Perspectives de l'Europe (millions USD, 2018-2030)

Tubage enroulé en Europe par type de service

Intervention sur le puits

Forage

Autres

Tubage enroulé en Europe par application

Terrestre

Offshore

Allemagne Perspectives (millions USD, 2018-2030)

Tubage enroulé en Allemagne par type de service

Intervention sur le puits

Forage

Autres

Tubage enroulé en Allemagne par application

Terrestre

Offshore

France Perspectives (millions USD, 2018-2030)

Tubage enroulé en France par type de service

Intervention sur le puits

Forage

Autres

Tubage enroulé en France par application

Terrestre

Offshore

Royaume-Uni Perspectives (millions USD, 2018-2030)

Tubage enroulé au Royaume-Uni par type de service

Intervention sur le puits

Forage

Autres

Tubage enroulé au Royaume-Uni par application

Terrestre

Offshore

ITALIE Perspectives (millions USD, 2018-2030)

Tubage enroulé en ITALIE par type de service

Intervention sur le puits

Forage

Autres

Tubage enroulé en ITALIE par application

Terrestre

Offshore

ESPAGNE Perspectives (millions USD, 2018-2030)

Tubage enroulé en Espagne par type de service

Intervention sur le puits

Forage

Autres

Tubage enroulé en Espagne par application

Terrestre

Offshore

Perspectives du reste de l'Europe (millions USD, 2018-2030)

Tubage enroulé dans le RESTE DE L'EUROPE par type de service

Intervention sur le puits

Forage

Autres

Tubage enroulé dans le RESTE DE L'EUROPE par application

Terrestre

Offshore

Perspectives de la région Asie-Pacifique (millions USD, 2018-2030)

Tubage enroulé en Asie-Pacifique par type de service

Intervention sur le puits

Forage

Autres

Tubage enroulé en Asie-Pacifique par application

Terrestre

Offshore

Chine Perspectives (millions USD, 2018-2030)

Tubage enroulé en Chine par type de service

Intervention sur le puits

Forage

Autres

Tubage enroulé en Chine par application

Terrestre

Offshore

Japon Perspectives (millions USD, 2018-2030)

Tubage enroulé au Japon par type de service

Intervention sur le puits

Forage

Autres

Tubage enroulé au Japon par application

Terrestre

Offshore

Inde Perspectives (millions USD, 2018-2030)

Tubage enroulé en Inde par type de service

Intervention sur le puits

Forage

Autres

Tubage enroulé en Inde par application

Terrestre

Offshore

Australie Perspectives (millions USD, 2018-2030)

Tubage enroulé en Australie par type de service

Intervention sur le puits

Forage

Autres

Tubage enroulé en Australie par application

Terrestre

Offshore

Perspectives du reste de la région Asie-Pacifique (millions USD, 2018-2030)

Tubage enroulé dans le reste de l'Asie-Pacifique par type de service

Intervention sur le puits

Forage

Autres

Tubage enroulé dans le reste de l'Asie-Pacifique par application

Terrestre

Offshore

Perspectives du reste du monde (millions USD, 2018-2030)

Tubage enroulé dans le reste du monde par type de service

Intervention sur le puits

Forage

Autres

Tubage enroulé dans le reste du monde par application

Terrestre

Offshore

Perspectives du Moyen-Orient (millions USD, 2018-2030)

Tubage enroulé au Moyen-Orient par type de service

Intervention sur le puits

Forage

Autres

Tubage enroulé au Moyen-Orient par application

Terrestre

Offshore

Perspectives de l'Afrique (millions USD, 2018-2030)

Tubage enroulé en Afrique par type de service

Intervention sur le puits

Forage

Autres

Tubage enroulé en Afrique par application

Terrestre

Offshore

Perspectives de l'Amérique Latine (millions USD, 2018-2030)

Tubage enroulé en Amérique Latine par type de service

Intervention sur le puits

Forage

Autres

Tubage enroulé en Amérique Latine par application

Terrestre

Offshore