Hero Background

Marché des antimicrobiens naturels

ID: MRFR/FnB/4097-HCR
111 Pages
Snehal Singh
Last Updated: April 06, 2026
Rapport de recherche sur le marché des antimicrobiens naturels Informations par source (Plantes, Animaux et Microorganismes), par application (Boulangerie et Confiserie, Produits Laitiers et Desserts Surgelés, Boissons, Snacks, Produits Carnés, Huiles et Graisses et Autres) et par région (Amérique du Nord, Europe, Asie-Pacifique et Reste du Monde) – Prévisions du marché jusqu'en 2035
Download PDF ×

We do not share your information with anyone. However, we may send you emails based on your report interest from time to time. You may contact us at any time to opt-out.

  1. 1 SECTION I : RÉSUMÉ EXÉCUTIF ET POINTS CLÉS
    1. 1.1 RÉSUMÉ EXÉCUTIF
      1. 1.1.1 Vue d'ensemble du marché
      2. 1.1.2 Conclusions clés
      3. 1.1.3 Segmentation du marché
      4. 1.1.4 Paysage concurrentiel
      5. 1.1.5 Défis et opportunités
      6. 1.1.6 Perspectives d'avenir
  2. 2 SECTION II : DÉLIMITATION, MÉTHODOLOGIE ET STRUCTURE DU MARCHÉ
    1. 2.1 INTRODUCTION AU MARCHÉ
      1. 2.1.1 Définition
      2. 2.1.2 Portée de l'étude
        1. 2.1.2.1 Objectif de la recherche
        2. 2.1.2.2 Hypothèse
        3. 2.1.2.3 Limitations
    2. 2.2 MÉTHODOLOGIE DE RECHERCHE
      1. 2.2.1 Vue d'ensemble
      2. 2.2.2 Exploration des données
      3. 2.2.3 Recherche secondaire
      4. 2.2.4 Recherche primaire
        1. 2.2.4.1 Interviews primaires et processus de collecte d'informations
        2. 2.2.4.2 Répartition des répondants principaux
      5. 2.2.5 Modèle de prévision
      6. 2.2.6 Estimation de la taille du marché
        1. 2.2.6.1 Approche ascendante
        2. 2.2.6.2 Approche descendante
      7. 2.2.7 Triangulation des données
      8. 2.2.8 Validation
  3. 3 SECTION III : ANALYSE QUALITATIVE
    1. 3.1 DYNAMIQUE DU MARCHÉ
      1. 3.1.1 Vue d'ensemble
      2. 3.1.2 Facteurs moteurs
      3. 3.1.3 Contraintes
      4. 3.1.4 Opportunités
    2. 3.2 ANALYSE DES FACTEURS DU MARCHÉ
      1. 3.2.1 Analyse de la chaîne de valeur
      2. 3.2.2 Analyse des cinq forces de Porter
        1. 3.2.2.1 Pouvoir de négociation des fournisseurs
        2. 3.2.2.2 Pouvoir de négociation des acheteurs
        3. 3.2.2.3 Menace des nouveaux entrants
        4. 3.2.2.4 Menace des substituts
        5. 3.2.2.5 Intensité de la rivalité
      3. 3.2.3 Analyse de l'impact du COVID-19
        1. 3.2.3.1 Analyse de l'impact sur le marché
        2. 3.2.3.2 Impact régional
        3. 3.2.3.3 Analyse des opportunités et des menaces
  4. 4 SECTION IV : ANALYSE QUANTITATIVE
    1. 4.1 Alimentation, boissons et nutrition, PAR source (milliards USD)
      1. 4.1.1 Plantes
      2. 4.1.2 Animaux
      3. 4.1.3 Micro-organismes
    2. 4.2 Alimentation, boissons et nutrition, PAR application (milliards USD)
      1. 4.2.1 Boulangerie et confiserie
      2. 4.2.2 Produits laitiers et desserts congelés
      3. 4.2.3 Boissons
      4. 4.2.4 Snacks
      5. 4.2.5 Produits carnés
      6. 4.2.6 Huiles et graisses
      7. 4.2.7 Autres
    3. 4.3 Alimentation, boissons et nutrition, PAR région (milliards USD)
      1. 4.3.1 Amérique du Nord
        1. 4.3.1.1 États-Unis
        2. 4.3.1.2 Canada
      2. 4.3.2 Europe
        1. 4.3.2.1 Allemagne
        2. 4.3.2.2 Royaume-Uni
        3. 4.3.2.3 France
        4. 4.3.2.4 Russie
        5. 4.3.2.5 Italie
        6. 4.3.2.6 Espagne
        7. 4.3.2.7 Reste de l'Europe
      3. 4.3.3 APAC
        1. 4.3.3.1 Chine
        2. 4.3.3.2 Inde
        3. 4.3.3.3 Japon
        4. 4.3.3.4 Corée du Sud
        5. 4.3.3.5 Malaisie
        6. 4.3.3.6 Thaïlande
        7. 4.3.3.7 Indonésie
        8. 4.3.3.8 Reste de l'APAC
      4. 4.3.4 Amérique du Sud
        1. 4.3.4.1 Brésil
        2. 4.3.4.2 Mexique
        3. 4.3.4.3 Argentine
        4. 4.3.4.4 Reste de l'Amérique du Sud
      5. 4.3.5 MEA
        1. 4.3.5.1 Pays du CCG
        2. 4.3.5.2 Afrique du Sud
        3. 4.3.5.3 Reste de la MEA
  5. 5 SECTION V : ANALYSE CONCURRENTIELLE
    1. 5.1 Paysage concurrentiel
      1. 5.1.1 Vue d'ensemble
      2. 5.1.2 Analyse concurrentielle
      3. 5.1.3 Analyse de la part de marché
      4. 5.1.4 Stratégie de croissance majeure dans l'alimentation, les boissons et la nutrition
      5. 5.1.5 Évaluation comparative
      6. 5.1.6 Acteurs principaux en termes de nombre de développements dans l'alimentation, les boissons et la nutrition
      7. 5.1.7 Développements clés et stratégies de croissance
        1. 5.1.7.1 Lancement de nouveaux produits / Déploiement de services
        2. 5.1.7.2 Fusions et acquisitions
        3. 5.1.7.3 Coentreprises
      8. 5.1.8 Matrice financière des principaux acteurs
        1. 5.1.8.1 Ventes et revenu d'exploitation
        2. 5.1.8.2 Dépenses de R&D des principaux acteurs. 2023
    2. 5.2 Profils d'entreprise
      1. 5.2.1 BASF SE (DE)
        1. 5.2.1.1 Vue d'ensemble financière
        2. 5.2.1.2 Produits offerts
        3. 5.2.1.3 Développements clés
        4. 5.2.1.4 Analyse SWOT
        5. 5.2.1.5 Stratégies clés
      2. 5.2.2 DuPont de Nemours Inc (US)
        1. 5.2.2.1 Vue d'ensemble financière
        2. 5.2.2.2 Produits offerts
        3. 5.2.2.3 Développements clés
        4. 5.2.2.4 Analyse SWOT
        5. 5.2.2.5 Stratégies clés
      3. 5.2.3 Kemin Industries Inc (US)
        1. 5.2.3.1 Vue d'ensemble financière
        2. 5.2.3.2 Produits offerts
        3. 5.2.3.3 Développements clés
        4. 5.2.3.4 Analyse SWOT
        5. 5.2.3.5 Stratégies clés
      4. 5.2.4 Cargill Inc (US)
        1. 5.2.4.1 Vue d'ensemble financière
        2. 5.2.4.2 Produits offerts
        3. 5.2.4.3 Développements clés
        4. 5.2.4.4 Analyse SWOT
        5. 5.2.4.5 Stratégies clés
      5. 5.2.5 Naturex SA (FR)
        1. 5.2.5.1 Vue d'ensemble financière
        2. 5.2.5.2 Produits offerts
        3. 5.2.5.3 Développements clés
        4. 5.2.5.4 Analyse SWOT
        5. 5.2.5.5 Stratégies clés
      6. 5.2.6 Givaudan SA (CH)
        1. 5.2.6.1 Vue d'ensemble financière
        2. 5.2.6.2 Produits offerts
        3. 5.2.6.3 Développements clés
        4. 5.2.6.4 Analyse SWOT
        5. 5.2.6.5 Stratégies clés
      7. 5.2.7 Symrise AG (DE)
        1. 5.2.7.1 Vue d'ensemble financière
        2. 5.2.7.2 Produits offerts
        3. 5.2.7.3 Développements clés
        4. 5.2.7.4 Analyse SWOT
        5. 5.2.7.5 Stratégies clés
      8. 5.2.8 Herbafood Ingredients GmbH (DE)
        1. 5.2.8.1 Vue d'ensemble financière
        2. 5.2.8.2 Produits offerts
        3. 5.2.8.3 Développements clés
        4. 5.2.8.4 Analyse SWOT
        5. 5.2.8.5 Stratégies clés
      9. 5.2.9 Eden Foods Inc (US)
        1. 5.2.9.1 Vue d'ensemble financière
        2. 5.2.9.2 Produits offerts
        3. 5.2.9.3 Développements clés
        4. 5.2.9.4 Analyse SWOT
        5. 5.2.9.5 Stratégies clés
    3. 5.3 Annexe
      1. 5.3.1 Références
      2. 5.3.2 Rapports connexes
  6. 6 LISTE DES FIGURES
    1. 6.1 SYNOPSIS DU MARCHÉ
    2. 6.2 ANALYSE DU MARCHÉ EN AMÉRIQUE DU NORD
    3. 6.3 ANALYSE DU MARCHÉ AUX ÉTATS-UNIS PAR SOURCE
    4. 6.4 ANALYSE DU MARCHÉ AUX ÉTATS-UNIS PAR APPLICATION
    5. 6.5 ANALYSE DU MARCHÉ AU CANADA PAR SOURCE
    6. 6.6 ANALYSE DU MARCHÉ AU CANADA PAR APPLICATION
    7. 6.7 ANALYSE DU MARCHÉ EN EUROPE
    8. 6.8 ANALYSE DU MARCHÉ EN ALLEMAGNE PAR SOURCE
    9. 6.9 ANALYSE DU MARCHÉ EN ALLEMAGNE PAR APPLICATION
    10. 6.10 ANALYSE DU MARCHÉ AU ROYAUME-UNI PAR SOURCE
    11. 6.11 ANALYSE DU MARCHÉ AU ROYAUME-UNI PAR APPLICATION
    12. 6.12 ANALYSE DU MARCHÉ EN FRANCE PAR SOURCE
    13. 6.13 ANALYSE DU MARCHÉ EN FRANCE PAR APPLICATION
    14. 6.14 ANALYSE DU MARCHÉ EN RUSSIE PAR SOURCE
    15. 6.15 ANALYSE DU MARCHÉ EN RUSSIE PAR APPLICATION
    16. 6.16 ANALYSE DU MARCHÉ EN ITALIE PAR SOURCE
    17. 6.17 ANALYSE DU MARCHÉ EN ITALIE PAR APPLICATION
    18. 6.18 ANALYSE DU MARCHÉ EN ESPAGNE PAR SOURCE
    19. 6.19 ANALYSE DU MARCHÉ EN ESPAGNE PAR APPLICATION
    20. 6.20 ANALYSE DU MARCHÉ DANS LE RESTE DE L'EUROPE PAR SOURCE
    21. 6.21 ANALYSE DU MARCHÉ DANS LE RESTE DE L'EUROPE PAR APPLICATION
    22. 6.22 ANALYSE DU MARCHÉ EN APAC
    23. 6.23 ANALYSE DU MARCHÉ EN CHINE PAR SOURCE
    24. 6.24 ANALYSE DU MARCHÉ EN CHINE PAR APPLICATION
    25. 6.25 ANALYSE DU MARCHÉ EN INDE PAR SOURCE
    26. 6.26 ANALYSE DU MARCHÉ EN INDE PAR APPLICATION
    27. 6.27 ANALYSE DU MARCHÉ AU JAPON PAR SOURCE
    28. 6.28 ANALYSE DU MARCHÉ AU JAPON PAR APPLICATION
    29. 6.29 ANALYSE DU MARCHÉ EN CORÉE DU SUD PAR SOURCE
    30. 6.30 ANALYSE DU MARCHÉ EN CORÉE DU SUD PAR APPLICATION
    31. 6.31 ANALYSE DU MARCHÉ EN MALAYSIE PAR SOURCE
    32. 6.32 ANALYSE DU MARCHÉ EN MALAYSIE PAR APPLICATION
    33. 6.33 ANALYSE DU MARCHÉ EN THAÏLANDE PAR SOURCE
    34. 6.34 ANALYSE DU MARCHÉ EN THAÏLANDE PAR APPLICATION
    35. 6.35 ANALYSE DU MARCHÉ EN INDONÉSIE PAR SOURCE
    36. 6.36 ANALYSE DU MARCHÉ EN INDONÉSIE PAR APPLICATION
    37. 6.37 ANALYSE DU MARCHÉ DANS LE RESTE DE L'APAC PAR SOURCE
    38. 6.38 ANALYSE DU MARCHÉ DANS LE RESTE DE L'APAC PAR APPLICATION
    39. 6.39 ANALYSE DU MARCHÉ EN AMÉRIQUE DU SUD
    40. 6.40 ANALYSE DU MARCHÉ AU BRÉSIL PAR SOURCE
    41. 6.41 ANALYSE DU MARCHÉ AU BRÉSIL PAR APPLICATION
    42. 6.42 ANALYSE DU MARCHÉ AU MEXIQUE PAR SOURCE
    43. 6.43 ANALYSE DU MARCHÉ AU MEXIQUE PAR APPLICATION
    44. 6.44 ANALYSE DU MARCHÉ EN ARGENTINE PAR SOURCE
    45. 6.45 ANALYSE DU MARCHÉ EN ARGENTINE PAR APPLICATION
    46. 6.46 ANALYSE DU MARCHÉ DANS LE RESTE DE L'AMÉRIQUE DU SUD PAR SOURCE
    47. 6.47 ANALYSE DU MARCHÉ DANS LE RESTE DE L'AMÉRIQUE DU SUD PAR APPLICATION
    48. 6.48 ANALYSE DU MARCHÉ EN MEA
    49. 6.49 ANALYSE DU MARCHÉ DANS LES PAYS DU CCG PAR SOURCE
    50. 6.50 ANALYSE DU MARCHÉ DANS LES PAYS DU CCG PAR APPLICATION
    51. 6.51 ANALYSE DU MARCHÉ EN AFRIQUE DU SUD PAR SOURCE
    52. 6.52 ANALYSE DU MARCHÉ EN AFRIQUE DU SUD PAR APPLICATION
    53. 6.53 ANALYSE DU MARCHÉ DANS LE RESTE DE LA MEA PAR SOURCE
    54. 6.54 ANALYSE DU MARCHÉ DANS LE RESTE DE LA MEA PAR APPLICATION
    55. 6.55 CRITÈRES D'ACHAT CLÉS DES ALIMENTS, BOISSONS ET NUTRITION
    56. 6.56 PROCESSUS DE RECHERCHE DE MRFR
    57. 6.57 ANALYSE DRO DE L'ALIMENTATION, DES BOISSONS ET DE LA NUTRITION
    58. 6.58 ANALYSE D'IMPACT DES FACTEURS MOTRICES : ALIMENTATION, BOISSONS ET NUTRITION
    59. 6.59 ANALYSE D'IMPACT DES CONTRAINTES : ALIMENTATION, BOISSONS ET NUTRITION
    60. 6.60 CHAÎNE D'APPROVISIONNEMENT / VALEUR : ALIMENTATION, BOISSONS ET NUTRITION
    61. 6.61 ALIMENTATION, BOISSONS ET NUTRITION, PAR SOURCE, 2024 (% PART)
    62. 6.62 ALIMENTATION, BOISSONS ET NUTRITION, PAR SOURCE, 2024 À 2035 (milliards USD)
    63. 6.63 ALIMENTATION, BOISSONS ET NUTRITION, PAR APPLICATION, 2024 (% PART)
    64. 6.64 ALIMENTATION, BOISSONS ET NUTRITION, PAR APPLICATION, 2024 À 2035 (milliards USD)
    65. 6.65 ÉVALUATION COMPARATIVE DES PRINCIPAUX CONCURRENTS
  7. 7 LISTE DES TABLEAUX
    1. 7.1 LISTE DES HYPOTHÈSES
    2. 7.2 ESTIMATIONS DE LA TAILLE DU MARCHÉ EN AMÉRIQUE DU NORD ; PRÉVISIONS
      1. 7.2.1 PAR SOURCE, 2025-2035 (milliards USD)
      2. 7.2.2 PAR APPLICATION, 2025-2035 (milliards USD)
    3. 7.3 ESTIMATIONS DE LA TAILLE DU MARCHÉ AUX ÉTATS-UNIS ; PRÉVISIONS
      1. 7.3.1 PAR SOURCE, 2025-2035 (milliards USD)
      2. 7.3.2 PAR APPLICATION, 2025-2035 (milliards USD)
    4. 7.4 ESTIMATIONS DE LA TAILLE DU MARCHÉ AU CANADA ; PRÉVISIONS
      1. 7.4.1 PAR SOURCE, 2025-2035 (milliards USD)
      2. 7.4.2 PAR APPLICATION, 2025-2035 (milliards USD)
    5. 7.5 ESTIMATIONS DE LA TAILLE DU MARCHÉ EN EUROPE ; PRÉVISIONS
      1. 7.5.1 PAR SOURCE, 2025-2035 (milliards USD)
      2. 7.5.2 PAR APPLICATION, 2025-2035 (milliards USD)
    6. 7.6 ESTIMATIONS DE LA TAILLE DU MARCHÉ EN ALLEMAGNE ; PRÉVISIONS
      1. 7.6.1 PAR SOURCE, 2025-2035 (milliards USD)
      2. 7.6.2 PAR APPLICATION, 2025-2035 (milliards USD)
    7. 7.7 ESTIMATIONS DE LA TAILLE DU MARCHÉ AU ROYAUME-UNI ; PRÉVISIONS
      1. 7.7.1 PAR SOURCE, 2025-2035 (milliards USD)
      2. 7.7.2 PAR APPLICATION, 2025-2035 (milliards USD)
    8. 7.8 ESTIMATIONS DE LA TAILLE DU MARCHÉ EN FRANCE ; PRÉVISIONS
      1. 7.8.1 PAR SOURCE, 2025-2035 (milliards USD)
      2. 7.8.2 PAR APPLICATION, 2025-2035 (milliards USD)
    9. 7.9 ESTIMATIONS DE LA TAILLE DU MARCHÉ EN RUSSIE ; PRÉVISIONS
      1. 7.9.1 PAR SOURCE, 2025-2035 (milliards USD)
      2. 7.9.2 PAR APPLICATION, 2025-2035 (milliards USD)
    10. 7.10 ESTIMATIONS DE LA TAILLE DU MARCHÉ EN ITALIE ; PRÉVISIONS
      1. 7.10.1 PAR SOURCE, 2025-2035 (milliards USD)
      2. 7.10.2 PAR APPLICATION, 2025-2035 (milliards USD)
    11. 7.11 ESTIMATIONS DE LA TAILLE DU MARCHÉ EN ESPAGNE ; PRÉVISIONS
      1. 7.11.1 PAR SOURCE, 2025-2035 (milliards USD)
      2. 7.11.2 PAR APPLICATION, 2025-2035 (milliards USD)
    12. 7.12 ESTIMATIONS DE LA TAILLE DU MARCHÉ DANS LE RESTE DE L'EUROPE ; PRÉVISIONS
      1. 7.12.1 PAR SOURCE, 2025-2035 (milliards USD)
      2. 7.12.2 PAR APPLICATION, 2025-2035 (milliards USD)
    13. 7.13 ESTIMATIONS DE LA TAILLE DU MARCHÉ EN APAC ; PRÉVISIONS
      1. 7.13.1 PAR SOURCE, 2025-2035 (milliards USD)
      2. 7.13.2 PAR APPLICATION, 2025-2035 (milliards USD)
    14. 7.14 ESTIMATIONS DE LA TAILLE DU MARCHÉ EN CHINE ; PRÉVISIONS
      1. 7.14.1 PAR SOURCE, 2025-2035 (milliards USD)
      2. 7.14.2 PAR APPLICATION, 2025-2035 (milliards USD)
    15. 7.15 ESTIMATIONS DE LA TAILLE DU MARCHÉ EN INDE ; PRÉVISIONS
      1. 7.15.1 PAR SOURCE, 2025-2035 (milliards USD)
      2. 7.15.2 PAR APPLICATION, 2025-2035 (milliards USD)
    16. 7.16 ESTIMATIONS DE LA TAILLE DU MARCHÉ AU JAPON ; PRÉVISIONS
      1. 7.16.1 PAR SOURCE, 2025-2035 (milliards USD)
      2. 7.16.2 PAR APPLICATION, 2025-2035 (milliards USD)
    17. 7.17 ESTIMATIONS DE LA TAILLE DU MARCHÉ EN CORÉE DU SUD ; PRÉVISIONS
      1. 7.17.1 PAR SOURCE, 2025-2035 (milliards USD)
      2. 7.17.2 PAR APPLICATION, 2025-2035 (milliards USD)
    18. 7.18 ESTIMATIONS DE LA TAILLE DU MARCHÉ EN MALAYSIE ; PRÉVISIONS
      1. 7.18.1 PAR SOURCE, 2025-2035 (milliards USD)
      2. 7.18.2 PAR APPLICATION, 2025-2035 (milliards USD)
    19. 7.19 ESTIMATIONS DE LA TAILLE DU MARCHÉ EN THAÏLANDE ; PRÉVISIONS
      1. 7.19.1 PAR SOURCE, 2025-2035 (milliards USD)
      2. 7.19.2 PAR APPLICATION, 2025-2035 (milliards USD)
    20. 7.20 ESTIMATIONS DE LA TAILLE DU MARCHÉ EN INDONÉSIE ; PRÉVISIONS
      1. 7.20.1 PAR SOURCE, 2025-2035 (milliards USD)
      2. 7.20.2 PAR APPLICATION, 2025-2035 (milliards USD)
    21. 7.21 ESTIMATIONS DE LA TAILLE DU MARCHÉ DANS LE RESTE DE L'APAC ; PRÉVISIONS
      1. 7.21.1 PAR SOURCE, 2025-2035 (milliards USD)
      2. 7.21.2 PAR APPLICATION, 2025-2035 (milliards USD)
    22. 7.22 ESTIMATIONS DE LA TAILLE DU MARCHÉ EN AMÉRIQUE DU SUD ; PRÉVISIONS
      1. 7.22.1 PAR SOURCE, 2025-2035 (milliards USD)
      2. 7.22.2 PAR APPLICATION, 2025-2035 (milliards USD)
    23. 7.23 ESTIMATIONS DE LA TAILLE DU MARCHÉ AU BRÉSIL ; PRÉVISIONS
      1. 7.23.1 PAR SOURCE, 2025-2035 (milliards USD)
      2. 7.23.2 PAR APPLICATION, 2025-2035 (milliards USD)
    24. 7.24 ESTIMATIONS DE LA TAILLE DU MARCHÉ AU MEXIQUE ; PRÉVISIONS
      1. 7.24.1 PAR SOURCE, 2025-2035 (milliards USD)
      2. 7.24.2 PAR APPLICATION, 2025-2035 (milliards USD)
    25. 7.25 ESTIMATIONS DE LA TAILLE DU MARCHÉ EN ARGENTINE ; PRÉVISIONS
      1. 7.25.1 PAR SOURCE, 2025-2035 (milliards USD)
      2. 7.25.2 PAR APPLICATION, 2025-2035 (milliards USD)
    26. 7.26 ESTIMATIONS DE LA TAILLE DU MARCHÉ DANS LE RESTE DE L'AMÉRIQUE DU SUD ; PRÉVISIONS
      1. 7.26.1 PAR SOURCE, 2025-2035 (milliards USD)
      2. 7.26.2 PAR APPLICATION, 2025-2035 (milliards USD)
    27. 7.27 ESTIMATIONS DE LA TAILLE DU MARCHÉ EN MEA ; PRÉVISIONS
      1. 7.27.1 PAR SOURCE, 2025-2035 (milliards USD)
      2. 7.27.2 PAR APPLICATION, 2025-2035 (milliards USD)
    28. 7.28 ESTIMATIONS DE LA TAILLE DU MARCHÉ DANS LES PAYS DU CCG ; PRÉVISIONS
      1. 7.28.1 PAR SOURCE, 2025-2035 (milliards USD)
      2. 7.28.2 PAR APPLICATION, 2025-2035 (milliards USD)
    29. 7.29 ESTIMATIONS DE LA TAILLE DU MARCHÉ EN AFRIQUE DU SUD ; PRÉVISIONS
      1. 7.29.1 PAR SOURCE, 2025-2035 (milliards USD)
      2. 7.29.2 PAR APPLICATION, 2025-2035 (milliards USD)
    30. 7.30 ESTIMATIONS DE LA TAILLE DU MARCHÉ DANS LE RESTE DE LA MEA ; PRÉVISIONS
      1. 7.30.1 PAR SOURCE, 2025-2035 (milliards USD)
      2. 7.30.2 PAR APPLICATION, 2025-2035 (milliards USD)
    31. 7.31 LANCEMENT DE PRODUIT / DÉVELOPPEMENT / APPROBATION
    32. 7.32 ACQUISITION / PARTENARIAT

Segmentation du marché

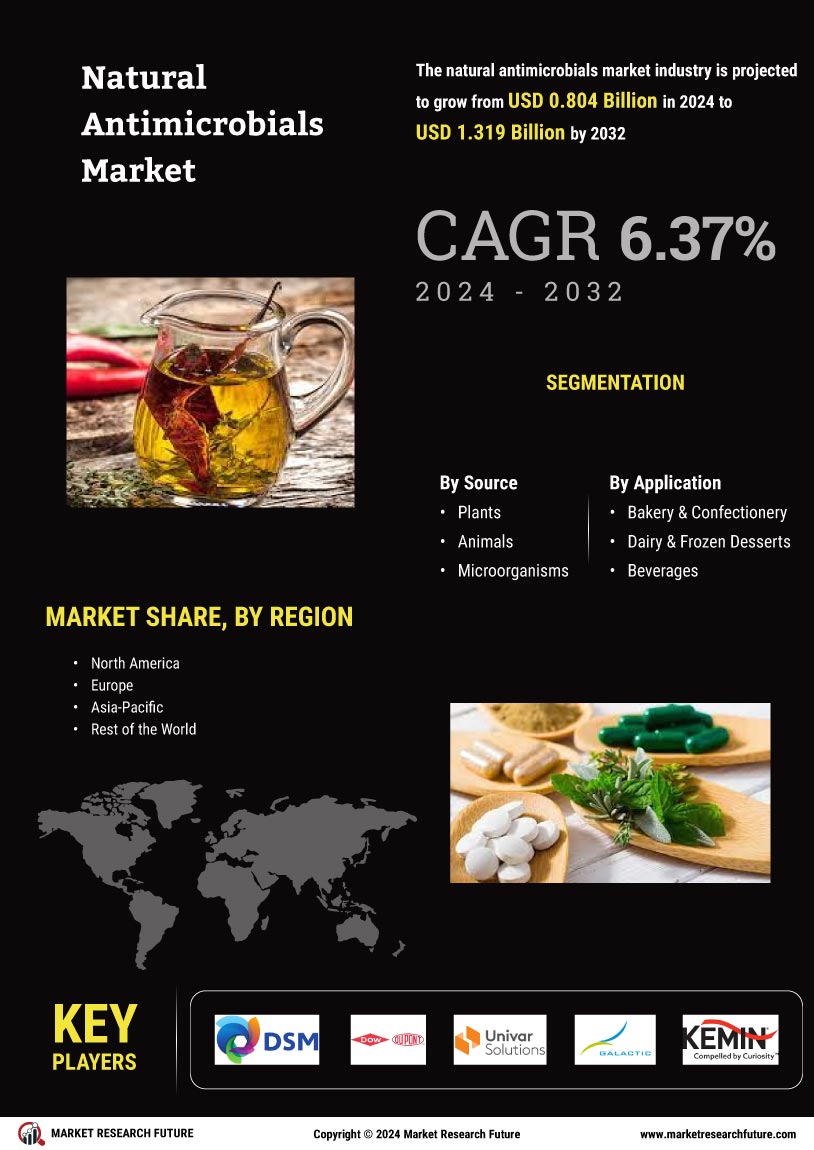
Perspectives des sources d'antimicrobiens naturels (milliards USD, 2018-2032)

  • Végétaux
  • Animaux
  • Microorganismes

Perspectives des applications des antimicrobiens naturels (milliards USD, 2018-2032)

  • Boulogne-Bonbons et Confiseries
  • Produits laitiers et Desserts glacés
  • Boissons
  • Snacks
  • Produits carnés
  • Huiles et Matières grasses
  • Autres

Perspectives régionales des antimicrobiens naturels (milliards USD, 2018-2032)

  • Perspectives pour l'Amérique du Nord (milliards USD, 2018-2032)
    • Antimicrobiens naturels en Amérique du Nord par source
      • Végétaux
      • Animaux
      • Micro-organismes
    • Antimicrobiens naturels en Amérique du Nord par application
      • Boulogne-Bonbons et Confiseries
      • Produits laitiers et Desserts glacés
      • Boissons
      • Snacks
      • Produits carnés
      • Huiles et Matières grasses
      • Autres
    • Perspectives aux États-Unis(milliards USD, 2018-2032)
    • Antimicrobiens naturels aux États-Unis par source
      • Végétaux
      • Animaux
      • Micro-organismes
    • Antimicrobiens naturels aux États-Unis par application
      • Boulangerie et confiserie
      • Produits laitiers et desserts glacés
      • Boissons
      • Snacks
      • Produits carnés
      • Huiles et Matières grasses
      • Autres
    • CANADAPerspectives (milliards USD, 2018-2032)
    • CANADA Antimicrobiens naturels par source
      • Végétaux
      • Animaux
      • Microorganismes
    • CANADA Antimicrobiens naturels par application
      • Boulangerie et confiserie
      • Produits laitiers et desserts glacés
      • Boissons
      • Collations
      • Produits carnés
      • Huiles et Matières grasses
      • Autres
    • Perspectives pour l'Europe (milliards USD, 2018-2032)
      • Antimicrobiens naturels en Europe par source
        • Végétaux
        • Animaux
        • Micro-organismes
      • Antimicrobiens naturels en Europe par application
        • Boulangerie et confiserie
        • Produits laitiers et desserts glacés
        • Boissons
        • Snacks
        • Produits carnés
        • Huiles et Matières grasses
        • Autres
      • Allemagne Perspectives (milliards USD, 2018-2032)
      • Antimicrobiens naturels en Allemagne par source
        • Végétaux
        • Animaux
        • Micro-organismes
      • Antimicrobiens naturels en Allemagne par application
        • Boulangerie et confiserie
        • Produits laitiers et desserts glacés
        • Boissons
        • Snacks
        • Produits carnés
        • Huiles et Matières grasses
        • Autres
      • Perspectives pour la France (milliards USD, 2018-2032)
      • Antimicrobiens naturels en France par source
        • Végétaux
        • Animaux
        • Micro-organismes
      • Antimicrobiens naturels en France par application
        • Boulangerie et confiserie
        • Produits laitiers et desserts glacés
        • Boissons
        • Snacks
        • Produits carnés
        • Huiles et Matières grasses
        • Autres
      • Perspectives pour le Royaume-Uni (milliards USD, 2018-2032)
      • Antimicrobiens naturels au Royaume-Uni par source
        • Végétaux
        • Animaux
        • Micro-organismes
      • Antimicrobiens naturels au Royaume-Uni par application
        • Boulangerie et confiserie
        • Produits laitiers et desserts glacés
        • Boissons
        • Snacks
        • Produits carnés
        • Huiles et Matières grasses
        • Autres
      • ITALIEPerspectives (milliards USD, 2018-2032)
      • ITALIE Antimicrobiens naturels par source
        • Végétaux
        • Animaux
        • Micro-organismes
      • ITALIE Antimicrobiens naturels par application
        • Boulangerie et confiserie
        • Produits laitiers et desserts glacés
        • Boissons
        • Snacks
        • Produits carnés
        • Huiles et Matières grasses
        • Autres
      • ESPAGNEPerspectives (milliards USD, 2018-2032)
      • Antimicrobiens naturels en Espagne par source
        • Végétaux
        • Animaux
        • Micro-organismes
      • Antimicrobiens naturels en Espagne par application
        • Boulogne-Bonbons et Confiseries
        • Produits laitiers et Desserts glacés
        • Boissons
        • Snacks
        • Produits carnés
        • Huiles et Matières grasses
        • Autres
      • Reste de l'EuropePerspectives (milliards USD, 2018-2032)
      • Antimicrobiens naturels du reste de l'Europe par source
        • Végétaux
        • Animaux
        • Micro-organismes
      • Antimicrobiens naturels du reste de l'Europe par application
        • Boulogne-Bonbons et Confiseries
        • Produits laitiers et Desserts glacés
        • Boissons
        • Snacks
        • Produits carnés
        • Huiles et Matières grasses
        • Autres
      • Perspectives Asie-Pacifique (milliards USD, 2018-2032)
        • Antimicrobiens naturels en Asie-Pacifique par source
          • Végétaux
          • Animaux
          • Micro-organismes
        • Antimicrobiens naturels en Asie-Pacifique par application
          • Boulangerie et confiserie
          • Produits laitiers et desserts glacés
          • Boissons
          • Snacks
          • Produits carnés
          • Huiles et Matières grasses
          • Autres
        • Perspectives pour la Chine (milliards USD, 2018-2032)
        • Antimicrobiens naturels en Chine par source
          • Végétaux
          • Animaux
          • Micro-organismes
        • Antimicrobiens naturels en Chine par application
          • Boulangerie et confiserie
          • Produits laitiers et desserts glacés
          • Boissons
          • Snacks
          • Produits carnés
          • Huiles et Matières grasses
          • Autres
        • Perspectives du Japon (milliards USD, 2018-2032)
        • Antimicrobiens naturels au Japon par source
          • Végétaux
          • Animaux
          • Micro-organismes
        • Antimicrobiens naturels au Japon par application
          • Boulangerie et confiserie
          • Produits laitiers et desserts glacés
          • Boissons
          • Snacks
          • Produits carnés
          • Huiles et Matières grasses
          • Autres
        • Perspectives de l'Inde(milliards USD, 2018-2032)
        • Antimicrobiens naturels en Inde par source
          • Végétaux
          • Animaux
          • Micro-organismes
        • Antimicrobiens naturels en Inde par application
          • Boulangerie et confiserie
          • Produits laitiers et desserts glacés
          • Boissons
          • Snacks
          • Produits carnés
          • Huiles et Matières grasses
          • Autres
        • Perspectives pour l'Australie (milliards USD, 2018-2032)
        • Antimicrobiens naturels australiens par source
          • Végétaux
          • Animaux
          • Micro-organismes
        • Antimicrobiens naturels australiens par application
          • Boulangerie et confiserie
          • Produits laitiers et desserts glacés
          • Boissons
          • Snacks
          • Produits carnés
          • Huiles et Matières grasses
          • Autres
        • Perspectives pour le reste de l'Asie-Pacifique (milliards USD, 2018-2032)
        • Antimicrobiens naturels par source dans le reste de l'Asie-Pacifique
          • Végétaux
          • Animaux
          • Micro-organismes
        • Antimicrobiens naturels par application dans le reste de l'Asie-Pacifique
          • Boulangerie et confiserie
          • Produits laitiers et desserts glacés
          • Boissons
          • Snacks
          • Produits carnés
          • Huiles et Matières grasses
          • Autres
        • Perspectives pour le reste du monde (milliards USD, 2018-2032)
          • Antimicrobiens naturels dans le reste du monde par source
            • Végétaux
            • Animaux
            • Micro-organismes
          • Antimicrobiens naturels dans le reste du monde par application
            • Boulangerie et confiserie
            • Produits laitiers et desserts glacés
            • Boissons
            • Snacks
            • Produits carnés
            • Huiles et Matières grasses
            • Autres
          • Perspectives pour le Moyen-Orient(milliards USD, 2018-2032)
          • Antimicrobiens naturels au Moyen-Orient par source
            • Végétaux
            • Animaux
            • Micro-organismes
          • Antimicrobiens naturels au Moyen-Orient par application
            • Boulangerie et confiserie
            • Produits laitiers et desserts glacés
            • Boissons
            • Snacks
            • Produits carnés
            • Huiles et Matières grasses
            • Autres
          • Perspectives pour l'Afrique(milliards USD, 2018-2032)
          • Antimicrobiens naturels en Afrique par source
            • Végétaux
            • Animaux
            • Micro-organismes
          • Antimicrobiens naturels en Afrique par application
            • Boulangerie et confiserie
            • Produits laitiers et desserts glacés
            • Boissons
            • Snacks
            • Produits carnés
            • Huiles et Matières grasses
            • Autres
          • Perspectives pour l'Amérique latine(milliards USD, 2018-2032)
          • Antimicrobiens naturels en Amérique latine par source
            • Végétaux
            • Animaux
            • Micro-organismes
          • Antimicrobiens naturels en Amérique latine par application
            • Boulogne-Bonbons et Confiseries
            • Produits laitiers et Desserts glacés
            • Boissons
            • Snacks
            • Produits carnés
            • Huiles et Graisses
            • Autres