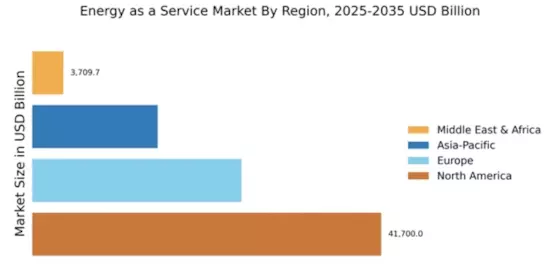
Revenue mapping and service deployment volume analysis were employed to determine the global market valuation. The methodology comprised the following:
Identification of over 50 significant EaaS providers and ESCOs in North America, Europe, Asia-Pacific, Latin America, and the Middle East and Africa
Service mapping for energy supply services, demand response services, distributed energy resource management services, and energy management services
Integrated comprehensive solutions, hardware integration (smart meters, sensors, control systems), and technology stack analysis across software platforms (AI-driven energy optimization, IoT-enabled monitoring, predictive analytics)
An analysis of energy source segmentation that encompasses renewable energy (solar-as-a-service, wind contracts), conventional energy (natural gas, utility electricity), and hybrid energy configurations
End-user vertical analysis that encompasses the residential (smart home energy management), commercial (office structures, retail), industrial (manufacturing, data centers), and government (municipal, federal) sectors
Examination of annual revenues that are specific to energy savings performance contracts (ESPCs) and EaaS portfolios, as reported and modeled
In 2024, the coverage of service providers will account for 72-78% of the global market share.
Extrapolation is employed to generate segment-specific valuations by combining bottom-up (deployed capacity × contract value by country/segment) and top-down (provider revenue validation) methodologies.