Request Free Sample ×

Kindly complete the form below to receive a free sample of this Report

* Please use a valid business email

Leading companies partner with us for data-driven Insights

clients tt-cursor
Hero Background

Aerial Imaging Market

ID: MRFR/AD/9219-HCR
174 Pages
Abbas Raut, Swapnil Palwe
Last Updated: May 28, 2026
Aerial Imaging Market Size, Share, Industry Trend & Analysis Research Report: By Platform Type (UAVs & Drones, Fixed-Wing Aircraft, Helicopters & Rotorcraft, Hybrid-VTOL), By Imaging Technique (Vertical Imaging, Oblique Imaging, LiDAR, Thermal / Infrared), By Imaging Resolution (≤10 cm GSD, 10–30 cm GSD, >30 cm GSD), By Delivery Mode (Subscription Libraries, On-Demand Tasking), By Application (Geospatial Mapping & Land Survey, Disaster & Emergency Management, Agriculture & Forestry, Construction & Engineering), By End-User Industry (Government & Public Agencies, Energy, Power & Utilities, Real Estate & Insurance, Mining & Natural Resources)- Forecast to 2035
Download PDF ×

We do not share your information with anyone. However, we may send you emails based on your report interest from time to time. You may contact us at any time to opt-out.


Aerial Imaging Market Summary

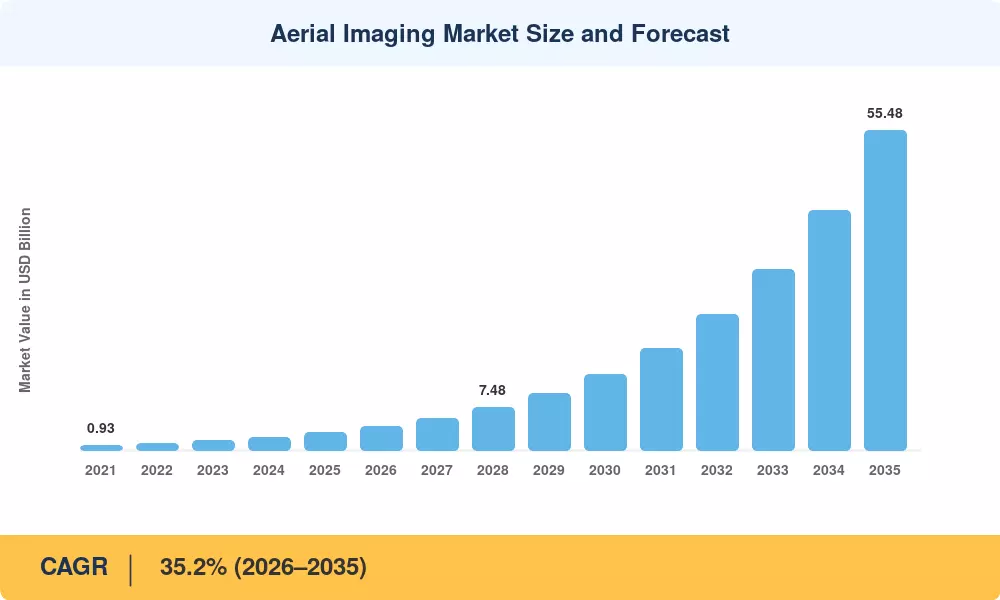
The Aerial Imaging Market stood at USD 2.76 billion in 2025 and is projected to reach USD 4.22 billion in 2026 before climbing to USD 55.48 billion by 2035, reflecting a 35.2% CAGR across the 2026–2035 forecast window. Government digital-twin mandates, including the US Infrastructure Investment and Jobs Act's USD 1.2 billion allocation for geospatial modernization, and aggressive energy-sector inspection budgets are the twin catalysts anchoring this trajectory [2][3]. The Aerial Imaging Market is rewriting how industries collect spatial intelligence at scale.

Legacy manned aerial survey fleets, once the backbone of orthomosaic aerial mapping, are rapidly giving way to hybrid-VTOL platforms equipped with on-device AI chips and real-time 5G streaming. High-resolution aerial survey workflows that previously required 72-hour processing turnarounds now complete in under four hours, a shift underscored by the European Space Agency's EUR 340 million Earth Observation Envelope Program investing heavily in sub-decimetre geodata standards [4]. Aerial photogrammetry software vendors have responded by embedding edge-AI inference directly into flight controllers, collapsing the data-to-decision pipeline.

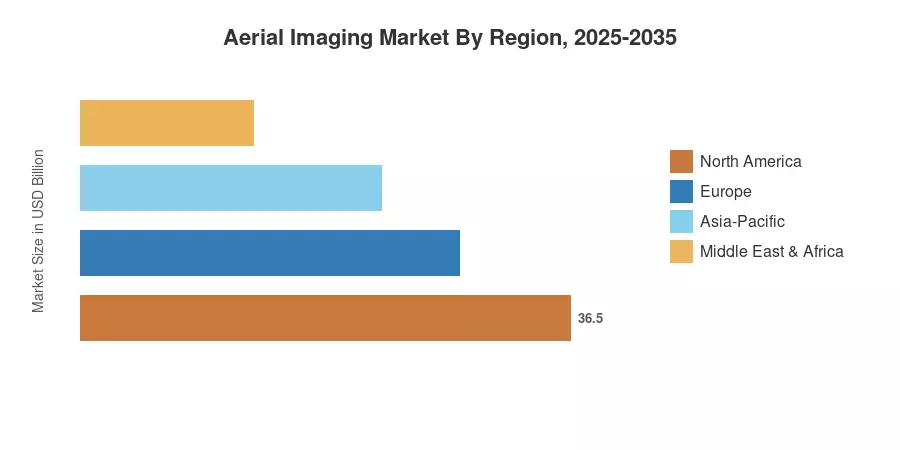
North America commands roughly 36% of the Aerial Imaging Market, driven by FAA Part 107 waiver expansions and utility corridor inspection demand. Asia-Pacific is the fastest-growing region at a projected 37.1% CAGR, fueled by India's SVAMITVA drone-mapping program and China's smart-city sensor mandates. Europe holds the second-largest share, near 27%, anchored by EU Digital Twin initiatives and offshore wind farm thermal aerial imaging inspection requirements The decade ahead will reward operators who pair platform versatility with analytics depth.


Key Report Takeaways

• By Platform

  • UAVs and drones captured 52.1% of the Aerial Imaging Market revenue in 2025, reinforcing their dominance in aerial photography drone services and short-range survey missions


  • LiDAR-based imaging techniques are forecast to grow at a 36.2% CAGR through 2035, overtaking vertical imaging's incumbent position as canopy-penetration and 3D point-cloud demand accelerate
  • Hybrid-VTOL platforms are the fastest-growing sub-segment, driven by declining airframe costs and certifications enabling 80+ km survey missions that previously required manned fixed-wing aircraft.


• By Imaging Technology

  • LiDAR-based imaging techniques are forecast to grow at a 36.2% CAGR through 2035, overtaking vertical imaging's incumbent position as canopy-penetration and 3D point-cloud demand accelerate


• By Delivery Mode

  • Subscription libraries accounted for 57.3% of the Aerial Imaging Market in 2025, while on-demand tasking is expanding at a 36.8% CAGR as project-based procurement gains favor
  • Geospatial mapping and land survey held 34.0% of 2025 revenue, yet disaster and emergency management is advancing fastest at a 36.6% CAGR

• By Application

  • Geospatial mapping and land survey held 34.0% of 2025 revenue, yet disaster and emergency management is advancing fastest at a 36.6% CAGR


• By Region

  • North America retained the largest regional share at approximately 36%, supported by federal infrastructure spending and utility-sector mandates
  • Asia-Pacific is forecast to register a 37.1% CAGR, propelled by national drone-mapping campaigns and smart-city investment across India, China, and South Korea


Market Size and Forecast (2021–2035)

The figures below combine MRFR primary surveys of over 120 aerial imaging operators, payload OEMs, and software vendors with secondary triangulation from public procurement databases, regulatory filings, and trade association data[5].

Market Size Chart
Our Impact
Enabled $4.3B Revenue Impact for Fortune 500 and Leading Multinationals
Partnering with 2000+ Global Organizations Each Year
30K+ Citations by Top-Tier Firms in the Industry
 

Driver Impact Analysis

Driver ~% Impact on CAGR Geographic Relevance Impact Timeline
Government digital-twin & cadastral mandates 18–22% Global Medium-term (2–4 yr)
Energy & utility infrastructure inspection demand 15–18% North America, Europe Short-term (≤2 yr)
Hybrid-VTOL platform cost reduction 12–15% Global Medium-term
On-device AI & edge processing chips 10–13% North America, Asia-Pacific Short-term
Sub-10 cm GSD regulatory specifications 8–11% Europe, North America Long-term (≥4 yr)
5G-enabled real-time streaming & fleet ops 7–9% Asia-Pacific, North America Medium-term
Disaster response & climate-resilience budgets 6–8% Global Long-term


Government Digital-Twin and Cadastral Programs

The national digital twin initiatives are the biggest policy driver for the Aerial Imaging Market. The SVAMITVA plan of India aims to survey 640,000 villages with drone fleets utilizing aerial photogrammetry software with a cumulative outlay of around INR 130 billion by 2028 [2]. The US Geological Survey’s 3D Elevation Program (3DEP) pledged to allocate USD 146 million yearly for nationwide LiDAR collection, establishing a fixed procurement floor for high-resolution aerial survey providers [3]. These rules convert discretionary spending for aerial drone photography services into recurrent government contracts.


Energy-Sector Inspection Demand

Utility companies across North America now allocate USD 2.3 billion annually to aerial and drone-based asset inspection, up from USD 900 million in 2021 [6]. Thermal aerial imaging inspection of transmission towers, solar farms, and wind turbines reduces outage detection times by 60–70% compared to ground crews. Pacific Gas & Electric's wildfire-mitigation drone program alone covers 25,000 circuit miles per year, a template now replicated by twelve major U.S. utilities [6].

Hybrid-VTOL Platform Economics

Hybrid-VTOL airframes solve the range-payload trade-off that historically constrained multirotor-only fleets to sub-15 km missions. Significant manufacturing efficiencies and hardware maturation between 2022 and 2025 have notably lowered the cost barrier for survey-grade platforms. This shifting price point has democratized access, opening the Aerial Imaging Market to mid-tier engineering firms and municipal agencies that previously relied entirely on outsourcing their orthomosaic aerial mapping work.


On-Device AI and Edge Processing

Qualcomm's Flight RB5 and NVIDIA Jetson Orin modules enable onboard inference at 275 TOPS, reducing cloud-upload dependency and cutting processing cycles from hours to minutes [8]. For aerial photogrammetry software vendors, edge AI integration means customers can deliver same-day deliverables — a competitive differentiator that is reshaping procurement criteria across the Aerial Imaging Market.


Restraints Impact Analysis

The restraint estimates below are directional and reflect headwinds that temper, but do not reverse, overall Aerial Imaging Market expansion.

Restraint ~% Drag on CAGR Geographic Relevance Impact Timeline
Fragmented airspace regulations & flight-approval regimes –3 to –5% Global Long-term
Privacy statutes & data-sovereignty restrictions –2 to –4% Europe, North America Medium-term
Cybersecurity & data-integrity liability exposure –2 to –3% Global Medium-term
Skilled pilot shortage & certification bottlenecks –1 to –2% Emerging markets Short-term
LEO satellite competition in coarse-resolution segments –1 to –2% Global Long-term


Fragmented Airspace and Flight-Approval Regimes

No two countries share the exact same regulations for beyond-visual-line-of-sight (BVLOS) operations. While the FAA officially aims to process Part 107 waiver applications within 90 days, securing approvals for complex operations in high-risk airspace zones often involves iterative reviews and protracted operational risk assessments. Meanwhile, the implementation of the EASA U-space framework remains highly fragmented across individual EU member states. This patchwork of regulatory requirements forces cross-border providers of aerial photography drone services to maintain highly specialized, country-specific compliance stacks, notably driving up administrative and operational overhead.


Privacy and Data-Sovereignty Constraints

GDPR's interpretation of incidentally captured personal data in high-resolution aerial survey imagery has triggered enforcement actions in Germany and France, with cumulative fines exceeding EUR 8.5 million since 2022 [12]. Operators serving the Aerial Imaging Market in Europe must now anonymize or redact imagery within 48 hours of capture, adding post-processing overhead that erodes margins on municipal contracts.

Low-Earth-Orbit Satellite Competition

Constellations from Planet Labs and Maxar are pushing revisit rates below 24 hours at 50 cm resolution, directly encroaching on the lower end of the aerial photography drone services value chain. While aerial operators retain decisive advantages in sub-decimeter and oblique-angle niches, this intensifying competitive pressure compresses pricing for downstream applications that tolerate coarser resolutions, such as large-area agricultural monitoring and macro-environmental tracking.


Opportunities

Drone-as-a-Service Subscription Models

Drone services for aerial photography on a subscription basis remove heavy upfront capital obstacles for municipal governments and mid-tier construction enterprises. Platforms that bundle orthomosaic aerial mapping software, flight planning tools, and analytics dashboards into predictable monthly SaaS fees are expanding steadily, introducing a reliable recurring revenue stream to traditionally hardware-centric business models.

[16].


Climate-Resilience and Disaster-Response Imaging

Federal and regional emergency management frameworks increasingly mandate pre- and post-event aerial surveys to accelerate damage assessment and fund allocation. Thermal aerial imaging inspection of flood-impacted infrastructure and wildfire perimeters positions specialized aerial operators as essential public safety partners, creating a resilient, high-priority demand sector within the broader Aerial Imaging Market.

Emerging-Market Cadastral and Agricultural Programs

Sub-Saharan Africa and Southeast Asia contain over 70% of the world's unregistered land parcels [17]. Rwanda's nationwide drone-mapping initiative digitized 11.4 million parcels in three years using aerial photogrammetry software, demonstrating a replicable template for Kenya, Nigeria, and Indonesia. These programs open greenfield demand for high-resolution aerial survey equipment and services.


Autonomous Fleet Operations and UTM Integration

Urban air mobility corridors and unmanned traffic management (UTM) systems under active regulatory development in Japan, South Korea, and Singapore are laying the groundwork for commercial, fully autonomous drone operations. Early movers capable of integrating with these centralized digital air traffic networks stand to capture long-term municipal and infrastructure contracts with multi-year lock-in periods.


Future Outlook

Autonomous Fleet Operations and AI-Driven Analytics

The commercial drone sector is rapidly transitioning toward automated operations within emerging unmanned traffic management corridors. By training advanced machine learning models on high-resolution orthomosaic aerial mapping datasets, operators can identify critical infrastructure anomalies—such as structural concrete cracks, corroded pylons, and severe vegetation encroachment—with high precision. This analytical shift is fundamentally transforming the aerial imaging market from a traditional data-collection industry into an automated, predictive-maintenance ecosystem.


Platform Economics and Subscription Consolidation

The commercial aerial imaging market is shifting from transactional, per-project billing toward centralized data subscription libraries. Market intelligence indicates that an increasing share of industry revenue will flow through integrated platform intermediaries. Aerial photogrammetry software vendors that successfully control both data acquisition pipelines and edge-based analytics are securing significantly higher profit margins than hardware-dependent operators, triggering a wave of vertical integration across the global industry landscape.


Energy Transition and ESG Reporting

The IEA estimates that global renewable energy capacity additions will exceed 700 GW annually by 2030; each gigawatt requires extensive thermal aerial imaging inspection during construction and operation [6][20]. ESG disclosure mandates — including the EU's Corporate Sustainability Reporting Directive — increasingly require third-party verified aerial survey evidence of environmental compliance, creating a regulatory pull for high-resolution aerial survey documentation.

Convergence with Satellite and Terrestrial Sensing

Rather than pure competition, the next decade will see aerial imaging operators integrate LEO satellite basemaps with drone-captured oblique detail layers to deliver fused multi-resolution products. This convergence benefits the Aerial Imaging Market by expanding the addressable use-case set — operators who can deliver seamless 50 cm to 2 cm resolution pyramids will command premium pricing in smart-city and defense contracts [15].


Market Segmentation

By Platform Type

Segment Key Metric Primary Demand Driver
UAVs & Drones 52.1% share (2025) Versatility, cost accessibility
Fixed-Wing Aircraft USD 0.63 Billion (2025) Large-area corridor mapping
Helicopters & Rotorcraft 33.8% CAGR Urban inspection, confined-area access
Hybrid-VTOL 36.2% CAGR Range-payload optimization


The Aerial Imaging Market's platform mix continues to tilt toward UAVs and drones, which served as the entry point for 78% of new commercial operators surveyed in 2024. Hybrid-VTOL platforms are the fastest-growing sub-segment, driven by declining airframe costs and certifications enabling 80+ km survey missions that previously required manned fixed-wing aircraft [7].

By Imaging Technique

Segment Key Metric Primary Demand Driver
Vertical Imaging 45.3% share (2025) Established ortho workflows
Oblique Imaging USD 0.41 Billion (2025) 3D urban modeling, facade inspection
LiDAR 36.2% CAGR Canopy penetration, point-cloud precision
Thermal / Infrared 35.4% CAGR Energy asset inspection, search & rescue


LiDAR's rise reflects growing demand for under-canopy terrain models in forestry and flood-risk applications. Thermal aerial imaging inspection, meanwhile, is becoming standard practice in utility-sector procurement, as regulators require annual infrared surveys of high-voltage transmission assets [6].

By Imaging Resolution

Segment Key Metric Primary Demand Driver
≤10 cm GSD 40.1% share (2025) Defense, cadastral, infrastructure
10–30 cm GSD 36.5% CAGR Agricultural monitoring, mining
>30 cm GSD USD 0.47 Billion (2025) Large-area reconnaissance


Sub-10 cm ground-sample-distance data commands premium pricing in the Aerial Imaging Market because it satisfies the tightest geodata specifications issued by defense and cadastral agencies. High-resolution aerial survey at this tier requires stabilized payloads and precise GPS-RTK positioning, creating a technical moat for specialized operators [4].

By Delivery Mode

Segment Key Metric Primary Demand Driver
Subscription Libraries 57.3% share (2025) Recurring access, budget predictability
On-Demand Tasking 36.8% CAGR Project-specific, rapid turnaround


Subscription models dominate because they give urban planners and utility engineers continuous access to updated orthomosaic aerial mapping layers without re-procuring each flight. On-demand tasking is growing faster as disaster-response agencies and insurance adjusters need bespoke captures within 24–48 hours of an event

By Application

Segment Key Metric Primary Demand Driver
Geospatial Mapping & Land Survey 34.0% share (2025) Cadastral reform, infrastructure planning
Disaster & Emergency Management 36.6% CAGR Climate resilience, FEMA mandates
Agriculture & Forestry USD 0.38 Billion (2025) Precision crop analytics
Construction & Engineering 35.1% CAGR Progress monitoring, volumetric survey


By End-User Industry

Segment Key Metric Primary Demand Driver
Government & Public Agencies 35.9% share (2025) Digital-twin mandates, defense and ISR
Energy, Power & Utilities 36.9% CAGR T&D inspection, renewable-asset monitoring
Real Estate & Insurance USD 0.24 Billion (2025) Property assessment, claims verification
Mining & Natural Resources 35.5% CAGR Volumetric stockpile measurement


The energy, power, and utilities end-user segment is the fastest-growing vertical in the Aerial Imaging Market, with thermal aerial imaging inspection of solar arrays, wind turbines, and transmission corridors now embedded into standard maintenance protocols for over 60% of North American investor-owned utilities [6].


Regional Market Share Analysis

Region Key Metric Primary Investment Themes
North America ~36% share (2025) Utility inspection, federal geospatial mandates
Europe ~27% share (2025) Offshore wind, EU Digital Twin, U-space regulation
Asia-Pacific 37.1% CAGR (2026–2035) Cadastral mapping, smart-city programs
South America USD 0.14 Billion (2025) Precision agriculture, mining survey
Middle East & Africa 36.4% CAGR (2026–2035) Oil & gas inspection, land registration
Total USD 2.76 Billion (2025)

The Aerial Imaging Market exhibits pronounced regional variation driven by regulatory maturity, infrastructure investment cycles, and end-user concentration.


North America

Country Key Metric Key Driver
US ~72% of regional share FAA BVLOS expansion, 3DEP LiDAR program
Canada 34.8% CAGR Pipeline corridor inspection, mining survey
Mexico USD 0.04 Billion (2025) Agricultural modernization, PEMEX facility inspection


North America's leadership in the Aerial Imaging Market rests on the convergence of permissive drone regulation, deep utility-sector budgets, and venture-backed aerial photogrammetry software startups. The FAA processed over 44,000 Part 107 waivers in 2024 alone, reflecting accelerating commercial adoption of aerial photography drone services [11].

Europe

Country Key Metric Key Driver
Germany ~22% of regional share Industrie 4.0 inspection, autobahn survey
UK 35.6% CAGR Offshore wind thermal aerial imaging inspection
France USD 0.09 Billion (2025) Cadastral reform, vineyard precision agriculture
Italy 33.9% CAGR Cultural heritage 3D documentation
Spain ~7% of regional share Solar farm monitoring
Nordic Countries 34.5% CAGR Forestry LiDAR, maritime corridor surveillance
Russia USD 0.04 Billion (2025) Pipeline monitoring (constrained by sanctions)
Rest of Europe ~12% of regional share Mixed infrastructure and agriculture


EASA's U-space regulatory framework — fully operational in seven member states as of 2025 — is standardizing commercial airspace access for high-resolution aerial survey operations, reducing cross-border compliance friction that historically constrained the European Aerial Imaging Market [11].

Asia-Pacific

Country Key Metric Key Driver
China ~34% of regional share Smart-city mandates, DJI ecosystem dominance
India 38.4% CAGR SVAMITVA cadastral drone-mapping at village scale
Japan USD 0.11 Billion (2025) Infrastructure aging inspection, UTM pilots
South Korea 37.2% CAGR K-UAM corridor development
ASEAN ~12% of regional share Palm-oil plantation monitoring, mining
Rest of Asia-Pacific 35.8% CAGR Emerging orthomosaic aerial mapping demand


Asia-Pacific's explosive growth in the Aerial Imaging Market is led by India's SVAMITVA program, which deployed over 350 drone teams to map rural land parcels using aerial photogrammetry software in 2024–2025 [2]. China's National Geomatics Center expanded its mandatory sub-10 cm geodata standard to 280 cities, generating sustained procurement volume for aerial photography drone services providers.

South America

Country Key Metric Key Driver
Brazil ~58% of regional share Agribusiness monitoring, Amazon deforestation tracking
Argentina 34.1% CAGR Lithium mining survey, Vaca Muerta pipeline inspection
Rest of South America USD 0.02 Billion (2025) Mining and cadastral programs


Brazil's national agricultural monitoring program (SAF) incorporated drone-based orthomosaic aerial mapping into its compliance framework in 2024, mandating aerial verification of deforestation-free supply chains for soy and cattle exports [17].

Middle East & Africa

Country Key Metric Key Driver
Saudi Arabia ~31% of regional share NEOM & Vision 2030 smart-city infrastructure
UAE 36.9% CAGR Emirate-level digital-twin initiatives
South Africa USD 0.03 Billion (2025) Mining survey, municipal land audit
Egypt 35.2% CAGR New Administrative Capital construction monitoring
Rest of MEA ~18% of regional share Oil & gas, agricultural survey


Saudi Arabia's NEOM project alone has contracted over USD 120 million in aerial photography drone services and high-resolution aerial survey work through 2028, making it the single largest discrete project opportunity in the regional Aerial Imaging Market [19].


Regional Market Share
 

Competitive Benchmarking

The Aerial Imaging Market exhibits medium concentration, with the top five players commanding an estimated 38–45% of global revenue. The HHI index sits near 620, reflecting a fragmented long tail of regional aerial photography drone services providers and niche aerial photogrammetry software vendors. Barriers to entry remain moderate — platform hardware is increasingly commoditized — but data-library moats and regulatory certifications separate scaled incumbents from smaller entrants.

Company Est. Revenue Share Range Key Offerings Strategic Positioning
Nearmap ~7–10% Subscription aerial imagery libraries, AI-powered analytics Dominant in ANZ and US subscription orthomosaic aerial mapping
EagleView Technologies ~6–9% Property analytics, roof measurement, insurance solutions Deep insurance and government vertical integration
Fugro ~5–8% Geo-data services, offshore survey, LiDAR Diversified geospatial leader across energy and marine
Vexcel Imaging ~4–7% Ultra-high-res aerial cameras, UltraCam platforms OEM sensor leader powering third-party acquisition fleets
Getmapping (Hexagon) ~4–6% National mapping programs, high-resolution aerial survey Anchor supplier for UK and European government contracts
DJI ~3–5% Enterprise drone platforms, payloads and flight controllers Dominant hardware ecosystem for aerial photography drone services
Pix4D ~3–5% Aerial photogrammetry software, cloud processing Software-platform leader in drone mapping workflows
senseFly (AgEagle) ~2–4% Fixed-wing mapping drones, eMotion flight software Precision agriculture and survey-grade fixed-wing niche
Terra Drone ~2–4% Industrial inspection, UTM solutions, LiDAR services Rapid expansion across the Asia-Pacific energy sector
Phase One ~2–3% Medium-format aerial cameras, metric-grade sensors Premium sensor provider for high-resolution aerial survey


Recent News & Developments


Report Scope

Item Detail
Market Scope Global Aerial Imaging Market covering hardware, software, and services
Study Period 2021–2035
CAGR Window 2026–2035 (35.2%)
Base Year 2025 (USD 2.76 Billion)
2026 Forecast Start USD 4.22 Billion
2035 Forecast Endpoint USD 55.48 Billion
Fastest Growing Segment Energy, Power & Utilities end-user (36.9% CAGR)
Companies Profiled 10+, including Nearmap, EagleView, Fugro, Vexcel, DJI, Pix4D, Terra Drone
Valuation Currency USD Billion


FAQs

How does aerial LiDAR compare with photogrammetry for forestry canopy analysis?

LiDAR penetrates dense canopy to capture ground-level terrain models with ±5 cm vertical accuracy, while photogrammetry excels at surface texture and color mapping. Most forestry programs now combine both sensors on a single hybrid-VTOL platform for comprehensive inventories [7].

What cybersecurity standards apply to commercial aerial imaging data?

NIST SP 800-53 and the EU's NIS2 Directive set baseline frameworks for UAS data integrity and encrypted transmission. Operators handling government contracts must typically achieve FedRAMP or equivalent certification [13].

How should procurement teams evaluate subscription-library versus on-demand tasking models?

Subscription libraries suit organizations needing regular, predictable imagery refreshes across fixed geographies. On-demand tasking fits project-specific needs with rapid turnaround but carries 20–30% higher per-capture costs [16].

What insurance considerations affect commercial aerial imaging operators?

Hull and liability policies specific to UAS operations typically cost 2–4% of fleet value annually. Operators should verify cyber-liability riders covering data breach exposure from captured imagery [13].

How are LEO satellite constellations reshaping the Aerial Imaging Market's competitive dynamics?

Satellites compete effectively at 30+ cm resolution with daily revisit rates. Aerial operators differentiate through sub-10 cm detail, oblique angles, and on-demand scheduling that satellites cannot match [15].

What role does 5G connectivity play in real-time aerial survey operations?

5G enables live-streaming of high-resolution aerial survey feeds at 100+ Mbps, supporting remote piloting and instant cloud processing. Coverage gaps in rural areas remain the primary adoption constraint [9].

Which emerging certifications should aerial imaging firms pursue for a competitive advantage?

ISO 19157 for geographic data quality and ASPRS positional accuracy standards are increasingly required in government RFPs. BVLOS operational certificates under FAA or EASA frameworks unlock the highest-value contract tiers [11][14].


Author
Author
Author Profile
Abbas Raut LinkedIn
Research Analyst
Abbas Raut is a Senior Research Analyst with 5+ years of experience delivering data-driven insights and strategic recommendations across the Automotive and Aerospace & Defense sectors. He specializes in emerging technologies, industry value chains, and global market dynamics shaping the future of mobility and defense. In automotive, Abbas has led studies on EVs, charging stations, BMS, superchargers, and more, guiding stakeholders through electrification and regulatory shifts. In Aerospace & Defense, he has analyzed markets for military electronics, drones, radars, and electronic warfare solutions, supporting procurement and investment strategies. With expertise in market sizing, forecasting, benchmarking, and technology adoption, Abbas is known for transforming complex datasets into actionable insights that drive strategy, innovation, and growth.
Co-Author
Co-Author Profile
Swapnil Palwe LinkedIn
Team Lead - Research
With a technical background as Bachelor's in Mechanical Engineering, with MBA in Operations Management , Swapnil has 6+ years of experience in market research, consulting and analytics with the tasks of data mining, analysis, and project execution. He is the POC for our clients, for their consulting projects running under the Automotive/A&D domain. Swapnil has worked on major projects in verticals such as Aerospace & Defense, Automotive and many other domain projects. He has worked on projects for fortune 500 companies' syndicate and consulting projects along with several government projects.

Research Approach


Secondary Research

The secondary research process entailed an extensive examination of regulatory databases, geo-spatial publications, cross-sectoral industry applications, and reputable aviation and geospatial organizations. Key sources included the Federal Aviation Administration (FAA) UAS Integration Office, European Union Aviation Safety Agency (EASA), ICAO (International Civil Aviation Organization), United States Geological Survey (USGS) 3D Elevation Program, NOAA National Geodetic Survey, NASA Earth Observatory, EU Copernicus Programme Emergency Management Service (CEMS), United Nations Global Geospatial Information Management (UN-GGIM), American Society for Photogrammetry and Remote Sensing (ASPRS), International Society for Photogrammetry and Remote Sensing (ISPRS), USDA National Agricultural Statistics Service, Eurostat Urban Atlas, World Bank Global Infrastructure Facility, National Centers for Environmental Information (NCEI), Association for Uncrewed Vehicle Systems International (AUVSI), and national civil aviation authorities from key markets including China (CAAC), Japan (JCAB), and Australia (CASA). These sources were used to collect regulatory compliance data, airspace authorization statistics, national elevation mapping programs, precision agriculture adoption rates, construction sectoral spending correlations, disaster management activation records, and technology landscape analysis for UAV platforms, manned aerial surveys, and satellite imaging constellations.


Primary Research

For the primary research, people on both the supply and demand sides were interviewed to get both qualitative and quantitative information. Supply-side sources were CEOs, Chief Technology Officers, VPs of Flight Operations, heads of Remote Sensing R&D, regulatory compliance officers, and commercial directors from companies that make UAVs, aerial cameras and sensors, photogrammetry software, and satellite images. Demand-side sources included chief surveyors, GIS directors, precision agriculture consultants, construction project managers, defense intelligence analysts, urban planning commissioners, environmental monitoring agency leads, and procurement heads from commercial drone service providers, civil engineering firms, government mapping agencies, and energy/utilities companies. Primary research confirmed flight operation scalability timelines, validated market segmentation across imaging platforms, and gathered information on BVLOS (Beyond Visual Line of Sight) regulatory adoption, software-as-a-service (SaaS) pricing models for geospatial analytics, and the differences between subscription and on-demand service.

Primary Respondent Breakdown:

By Designation: C-level Primaries (28%), Director Level (42%), Others (30%)

By Region: North America (32%), Europe (30%), Asia-Pacific (28%), Rest of World (10%)


Market Size Estimation

Global market valuation was derived through revenue mapping of imaging hardware, software licenses, and service contracts. The methodology included:

Identification of 60+ key service providers and technology vendors across North America, Europe, Asia-Pacific, and Latin America

Product mapping across fixed-wing UAVs, multirotor drones, manned aircraft imaging systems, satellite constellations, LiDAR sensors, multispectral/hyperspectral cameras, and photogrammetry/analytics software

Analysis of reported and modeled annual revenues specific to aerial imaging hardware sales, subscription-based imagery services, and per-acre/ per-project analytical solutions

Coverage of manufacturers and service providers representing 65-70% of global market share in 2024

Extrapolation using bottom-up (flight hours × service rates by application sector) and top-down (vendor revenue validation across hardware, software, and services) approaches to derive segment-specific valuations for agriculture monitoring, construction site surveys, environmental compliance assessments, mining volumetrics, and real estate visualization.

Download Free Sample

Kindly complete the form below to receive a free sample of this Report