Aerospace Components Testing and Repair Market

Aerospace Components Testing and Repair Market Size, Share and Trends Analysis Research Report Information By End Use (Commercial Aviation, Military Aviation, Space Exploration, General Aviation, and Unmanned Aerial Vehicles), By Technology (Traditional Testing, Advanced Testing, Digital Testing, Automated Testing, and Simulation-Based Testing), By Application (Structural, Functional, Non-Destructive, Environmental, and Performance Testing), By Service Type (Testing, Repair, Maintenance, Certification, and Inspection Services), By Component Type (Airframe, Engine, Avionics, Landing Gear, and Fuel System Components), And By Region – Market Forecast Till 2035.

Forecast Period
2025 - 2035
CAGR
4.02%
2024 Market Size
$ 22.5 Billion
2035 Market Size
$ 34.7 Billion
MRO ● Updated April 7, 2026 Report ID: MRFR/MRO/64027-HCR | Pages: 200 | Author: Shubham Munde, Garvit Vyas

Aerospace Components Testing and Repair Market Summary

As per MRFR analysis, the Aerospace Components Testing and Repair Market was estimated at 22.5 USD Billion in 2024. The aerospace components testing and repair industry is projected to grow from 23.4 USD Billion in 2025 to 34.7 USD Billion by 2035, exhibiting a compound annual growth rate (CAGR) of 4.02% during the forecast period 2025 - 2035.

Key Market Trends & Highlights

The Aerospace Components Testing and Repair Market is poised for growth driven by technological advancements and increasing demand for air travel.

  • Technological advancements are enhancing the efficiency and accuracy of aerospace component testing and repair processes.
  • North America remains the largest market, while the Asia-Pacific region is emerging as the fastest-growing area in this sector.
  • Functional testing continues to dominate the market, whereas non-destructive testing is experiencing rapid growth.
  • The increasing demand for air travel and stringent regulatory frameworks are key drivers propelling market expansion.

Market Size & Forecast

2024 Market Size 22.5 (USD Billion)
2035 Market Size 34.7 (USD Billion)
CAGR (2025 - 2035) 4.02%

Major Players

Boeing (US), Airbus (FR), General Electric (US), Honeywell (US), Rolls-Royce (GB), Safran (FR), Northrop Grumman (US), Raytheon Technologies (US), L3Harris Technologies (US)

Our Impact

Enabled $4.3B Revenue Impact for Fortune 500 and Leading Multinationals

Partnering with 2000+ Global Organizations Each Year

30K+ Citations by Top-Tier Firms in the Industry

Aerospace Components Testing and Repair Market Drivers

Growth of the Defense Sector

The Aerospace Components Testing and Repair Market is bolstered by the growth of the defense sector, which requires rigorous testing and maintenance of military aircraft and components. Increased defense spending in various countries is driving demand for specialized testing and repair services tailored to military specifications. The defense aviation market is projected to expand, with investments in advanced aircraft and systems. This growth necessitates a robust Aerospace Components Testing and Repair Market to ensure that military assets remain operational and effective. As defense contracts increase, companies specializing in aerospace testing and repair are likely to benefit from this upward trend, enhancing their market position.

Stringent Regulatory Frameworks

The Aerospace Components Testing and Repair Market is significantly influenced by stringent regulatory frameworks imposed by aviation authorities worldwide. These regulations mandate rigorous testing and maintenance protocols to ensure the safety and reliability of aerospace components. Compliance with these regulations is not merely a legal obligation; it is essential for maintaining operational licenses and ensuring passenger safety. The Federal Aviation Administration (FAA) and the European Union Aviation Safety Agency (EASA) have established comprehensive guidelines that govern testing and repair processes. As regulatory scrutiny intensifies, companies within the Aerospace Components Testing and Repair Market must invest in advanced testing capabilities to adhere to these standards, thereby driving market growth.

Increasing Demand for Air Travel

The Aerospace Components Testing and Repair Market is experiencing a surge in demand driven by the increasing global air travel. As more airlines expand their fleets to accommodate rising passenger numbers, the need for reliable and efficient testing and repair services for aerospace components becomes paramount. According to industry reports, the commercial aviation sector is projected to grow at a compound annual growth rate of approximately 4.5% over the next decade. This growth necessitates stringent testing and repair protocols to ensure safety and compliance with aviation standards. Consequently, the Aerospace Components Testing and Repair Market is likely to witness heightened activity as manufacturers and service providers strive to meet the evolving demands of the aviation sector.

Technological Innovations in Testing Methods

Technological advancements are reshaping the Aerospace Components Testing and Repair Market, introducing innovative testing methods that enhance efficiency and accuracy. The integration of advanced technologies such as artificial intelligence, machine learning, and non-destructive testing techniques is revolutionizing how aerospace components are evaluated. These innovations not only improve the reliability of testing outcomes but also reduce turnaround times for repairs. For instance, the adoption of automated testing systems can potentially decrease operational costs by up to 20%. As these technologies continue to evolve, they are expected to play a crucial role in the Aerospace Components Testing and Repair Market, driving growth and improving service delivery.

Focus on Sustainability and Environmental Impact

The Aerospace Components Testing and Repair Market is increasingly aligning with sustainability initiatives as the aviation sector seeks to minimize its environmental footprint. Companies are exploring eco-friendly materials and processes in the testing and repair of aerospace components. This shift is driven by both regulatory pressures and consumer demand for greener practices. The market is witnessing a rise in the adoption of sustainable practices, such as the recycling of materials and the use of energy-efficient technologies. As a result, organizations that prioritize sustainability in their operations are likely to gain a competitive edge in the Aerospace Components Testing and Repair Market, appealing to environmentally conscious stakeholders.

Market Segment Insights

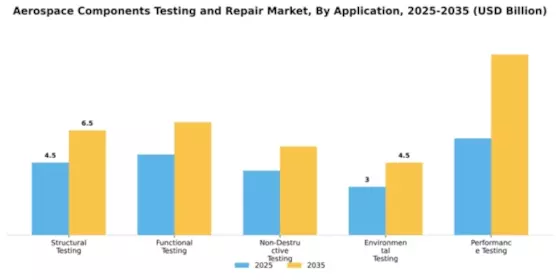
By Application: Functional Testing (Largest) vs. Non-Destructive Testing (Fastest-Growing)

The Aerospace Components Testing and Repair Market is primarily characterized by a diverse array of applications, with Functional Testing holding the largest share. This segment is crucial for ensuring that aerospace components meet specific operational requirements and safety standards. Non-Destructive Testing follows closely behind and is recognized as the fastest-growing segment due to increasing demand for techniques that do not compromise component integrity while ensuring quality control.
Aerospace Components Testing and Repair Market Segment Image 0

Testing: Functional Testing (Dominant) vs. Non-Destructive Testing (Emerging)

Functional Testing plays a pivotal role in the Aerospace Components Testing and Repair Market, primarily focusing on validating the operational capabilities of aerospace components. This dominant segment emphasizes reliability and safety, which are of extreme importance in the aerospace sector. In contrast, Non-Destructive Testing has emerged as a crucial area for growth, as it utilizes advanced technologies to detect defects without causing harm to the components. This emerging segment is gaining traction due to stricter regulations and the need for enhanced safety protocols in the industry, making it an invaluable asset for manufacturers looking to ensure long-term reliability and compliance.
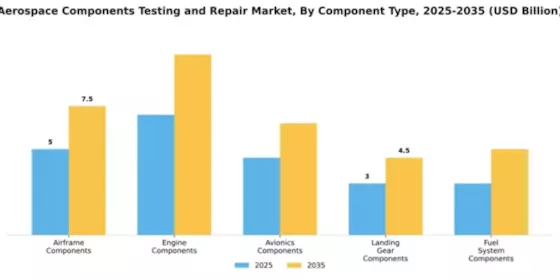
By End Use: Commercial Aviation (Largest) vs. Unmanned Aerial Vehicles (Fastest-Growing)

Aerospace Components Testing and Repair Market Segment Image 1

In the Aerospace Components Testing and Repair Market, the segmentation by end use reveals that Commercial Aviation holds the largest market share. This sector benefits from the high frequency of flights and stringent safety regulations, necessitating consistent testing and repair services. Each segment's dynamics are shaped by factors like aircraft utilization rates and technological advancements that enhance service efficiency. Following closely is Military Aviation, which also commands a significant share due to defense contracts and modernization efforts in military aircraft. In contrast, emerging segments, such as Unmanned Aerial Vehicles, are gaining traction, fueled by advancements in drone technology and increasing applications across various industries.

Commercial Aviation (Dominant) vs. Unmanned Aerial Vehicles (Emerging)

The Commercial Aviation segment is characterized by its well-established infrastructure and continuous demand for maintenance and repairs driven by operational safety mandates. Airlines must comply with rigorous airworthiness standards, creating a constant flow of testing and repair services required for compliance and safety assurance. In contrast, the Unmanned Aerial Vehicles (UAV) segment represents a rapidly evolving field, marked by technological innovations and expanding applications in sectors such as agriculture, logistics, and surveillance. This segment is expected to see accelerated growth as more industries adopt UAV technology, pushing for more specialized testing and maintenance services to support the influx of new drone models and their operational needs.

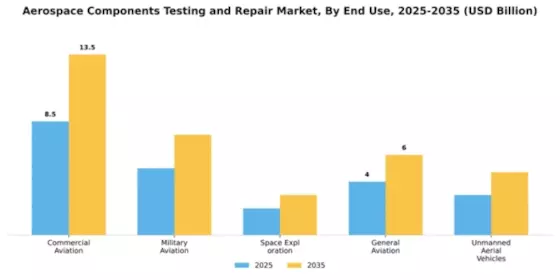
By Component Type: Airframe Components (Largest) vs. Engine Components (Fastest-Growing)

In the Aerospace Components Testing and Repair Market, the distribution of market share highlights the significant dominance of airframe components, which hold the largest share due to their critical role in structural integrity and safety. Engine components also represent a substantial portion of the market, but they are seeing a surge in demand driven by advancements in engine technology and increased flight hours of existing fleets, positioning them as the fastest-growing segment within this landscape. Growth trends indicate that airframe components are essential as the aviation sector gradually recovers post-pandemic, facilitating maintenance and retrofitting of aging aircraft. In contrast, engine components are experiencing robust growth fueled by the rising adoption of more efficient engines and stringent regulations on emissions that prompt operators to invest in testing and repair services. This dynamic showcases a sector evolving with innovations and shifting demands.
Aerospace Components Testing and Repair Market Segment Image 2

Airframe Components (Dominant) vs. Engine Components (Emerging)

Airframe components are critical to ensuring the safety and structural integrity of aircraft, making them the dominant category in the Aerospace Components Testing and Repair Market. This segment encompasses a range of parts such as fuselage structures and wings, which require regular testing and maintenance to comply with aviation safety standards. Conversely, engine components are rapidly emerging as a key focus area due to the continuous evolution of engine technologies and increasing operational demands. These include components like turbines and fuel systems, which are increasingly reliant on cutting-edge testing techniques to enhance performance and reliability. The combination of these segments contributes to an intricate landscape of testing and repair services tailored to the unique needs of aerospace applications.
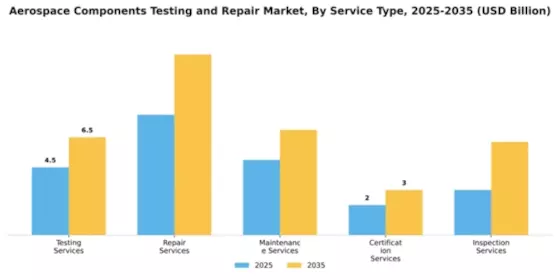
By Service Type: Testing Services (Largest) vs. Repair Services (Fastest-Growing)

Aerospace Components Testing and Repair Market Segment Image 3

In the Aerospace Components Testing and Repair Market, the distribution of services highlights Testing Services as the dominant segment, primarily due to its critical role in ensuring compliance with safety regulations. This segment currently holds a significant share of market revenue. Repair Services, on the other hand, has emerged as the fastest-growing segment, propelled by increasing demand for cost-effective solutions to extend the lifespan of aerospace components and systems. As industries strive for efficiency, these trends will shape the competitive landscape of the market.

Testing Services: Dominant vs. Repair Services: Emerging

Testing Services is a cornerstone in the Aerospace Components Testing and Repair Market, focusing on compliance with stringent aeronautical standards. This segment benefits from advanced technologies such as non-destructive testing and material analysis. In contrast, Repair Services represent an emerging segment meeting the increasing need for sustainable practices, with cost-saving measures driving innovation. Companies are investing in enhanced repair techniques to ensure faster turnaround times and reliability in component performance. While Testing Services remain essential, the growing emphasis on repair underscores a strategic pivot towards sustainable operational practices in the aerospace sector.

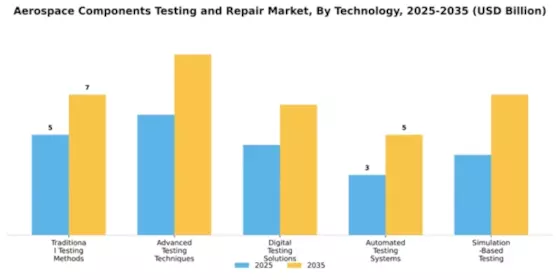
By Technology: Digital Testing Solutions (Largest) vs. Automated Testing Systems (Fastest-Growing)

In the Aerospace Components Testing and Repair Market, the distribution of market share among the technology segment showcases a clear dominance of Digital Testing Solutions. As companies increasingly embrace modernization, digital solutions have become vital for maintaining competitive advantage. This segment is leveraged for its efficiency and accuracy, while Automated Testing Systems are carving a niche for themselves. Although they represent a smaller portion of the market currently, their rapid adoption signals a significant shift in how testing and repair processes are being approached. Growth trends indicate a robust trajectory for both segments, fueled by the increasing demand for precision and speed in aerospace manufacturing. Digital Testing Solutions are at the forefront, as they streamline processes and enhance data analysis capabilities. Meanwhile, Automated Testing Systems are quickly gaining traction due to advancements in robotics and AI, which provide higher throughput and reduced human error, making them essential for future innovations in aerospace testing.
Aerospace Components Testing and Repair Market Segment Image 4

Technology: Digital Testing Solutions (Dominant) vs. Automated Testing Systems (Emerging)

Digital Testing Solutions are characterized by their integration of technology to enhance testing accuracy, efficiency, and data management within the aerospace components market. These solutions offer superior capabilities in real-time monitoring and analysis, making them indispensable in ensuring compliance with strict aerospace standards. On the other hand, Automated Testing Systems present an emerging opportunity, leveraging AI and robotics to bring about significant improvements in speed and consistency. With the capability to perform complex tests with minimal human intervention, these systems are gaining popularity, particularly among manufacturers seeking to scale operations while maintaining high quality standards. Together, these segments reflect the ongoing innovation and transformation in aerospace testing methodologies.

Get more detailed insights about Aerospace Components Testing and Repair Market Request Free Sample

Regional Insights

North America : Market Leader in Aerospace

North America continues to lead the Aerospace Components Testing and Repair Market, holding a significant market share of 10.5 in 2024. The region's growth is driven by robust demand for advanced aerospace technologies, stringent safety regulations, and increased defense spending. The presence of major players like Boeing and General Electric further fuels market expansion, supported by government initiatives promoting innovation and efficiency in aerospace operations. The competitive landscape in North America is characterized by a concentration of key players, including Honeywell and Northrop Grumman, which are investing heavily in R&D to enhance testing capabilities. The U.S. government plays a crucial role in shaping the market through regulations that ensure safety and reliability in aerospace components. This regulatory environment, combined with a strong focus on technological advancements, positions North America as a powerhouse in the aerospace sector.

Europe : Emerging Aerospace Hub

Europe's Aerospace Components Testing and Repair Market is poised for growth, with a market size of 6.75 in 2024. The region benefits from a strong regulatory framework that emphasizes safety and environmental standards, driving demand for testing and repair services. The European Union's initiatives to enhance aerospace innovation and sustainability are key growth drivers, alongside increasing investments in defense and commercial aviation sectors. Leading countries such as France and Germany are home to major players like Airbus and Safran, which are pivotal in shaping the competitive landscape. The presence of these industry giants fosters collaboration and innovation, ensuring that Europe remains at the forefront of aerospace technology. The market is also supported by a skilled workforce and advanced research facilities, further enhancing its competitive edge.

Asia-Pacific : Rapidly Growing Market

The Asia-Pacific region is witnessing rapid growth in the Aerospace Components Testing and Repair Market, with a market size of 4.5 in 2024. This growth is driven by increasing air travel demand, rising investments in defense, and the expansion of commercial aviation. Countries like China and India are focusing on enhancing their aerospace capabilities, supported by government initiatives aimed at boosting local manufacturing and technological advancements. The competitive landscape is evolving, with both established players and new entrants vying for market share. Companies are investing in state-of-the-art testing facilities to meet the growing demand for reliable aerospace components. The region's focus on innovation and collaboration among industry stakeholders is expected to drive further growth, positioning Asia-Pacific as a key player in The Aerospace Components Testing and Repair.

Middle East and Africa : Emerging Market Potential

The Middle East and Africa region presents emerging opportunities in the Aerospace Components Testing and Repair Market, with a market size of 0.75 in 2024. The growth is fueled by increasing investments in aviation infrastructure and a rising number of air travelers. Governments in the region are prioritizing the development of their aerospace sectors, aiming to enhance local capabilities and attract foreign investments. Countries like the UAE and South Africa are leading the charge, with initiatives to establish aerospace hubs and foster innovation. The competitive landscape is gradually evolving, with both local and international players entering the market. As the region continues to develop its aerospace capabilities, it is expected to become a significant player in the global aerospace industry.

Key Players and Competitive Insights

The Aerospace Components Testing and Repair Market is characterized by a dynamic competitive landscape, driven by technological advancements, regulatory compliance, and the increasing demand for efficient maintenance solutions. Major players such as Boeing (US), Airbus (FR), and General Electric (US) are strategically positioned to leverage their extensive experience and technological capabilities. Boeing (US) focuses on enhancing its testing capabilities through digital transformation initiatives, while Airbus (FR) emphasizes sustainability in its operations, aiming to reduce the environmental impact of its testing processes. General Electric (US) is investing heavily in AI and data analytics to optimize repair processes, thereby enhancing operational efficiency. Collectively, these strategies contribute to a competitive environment that prioritizes innovation and responsiveness to market demands.Key business tactics within the Aerospace Components Testing and Repair Market include localizing manufacturing and optimizing supply chains to enhance responsiveness and reduce costs. The market structure appears moderately fragmented, with several key players exerting significant influence. This fragmentation allows for niche players to thrive, while larger companies consolidate their positions through strategic partnerships and acquisitions, thereby shaping the competitive dynamics.In November Boeing (US) announced a partnership with a leading AI firm to develop predictive maintenance solutions aimed at improving the reliability of aerospace components. This strategic move is likely to enhance Boeing's service offerings, positioning the company as a leader in the integration of AI technologies within the testing and repair sector. The collaboration underscores the importance of leveraging advanced technologies to meet evolving customer expectations.In October Airbus (FR) launched a new initiative focused on sustainable testing practices, which includes the implementation of eco-friendly materials and processes in its repair operations. This initiative not only aligns with global sustainability goals but also enhances Airbus's brand reputation as a responsible industry leader. The emphasis on sustainability is becoming increasingly critical as regulatory pressures mount and customer preferences shift towards environmentally friendly solutions.In September General Electric (US) unveiled a state-of-the-art digital platform designed to streamline the testing and repair processes for aerospace components. This platform integrates advanced analytics and machine learning capabilities, allowing for real-time monitoring and predictive insights. The introduction of this platform is expected to significantly reduce downtime and improve the overall efficiency of repair operations, thereby reinforcing General Electric's competitive edge in the market.As of December current trends in the Aerospace Components Testing and Repair Market indicate a strong focus on digitalization, sustainability, and AI integration. Strategic alliances are increasingly shaping the landscape, as companies recognize the need for collaborative approaches to address complex challenges. Looking ahead, competitive differentiation is likely to evolve from traditional price-based competition to a focus on innovation, technological advancements, and supply chain reliability. This shift suggests that companies that prioritize these elements will be better positioned to thrive in an increasingly competitive environment.


Key Companies in the Aerospace Components Testing and Repair Market include

Future Outlook

Aerospace Components Testing and Repair Market Future Outlook

The Aerospace Components Testing and Repair Market is projected to grow at a 4.02% CAGR from 2025 to 2035, driven by technological advancements and increasing demand for safety compliance.

New opportunities lie in:

  • Development of advanced non-destructive testing technologies Expansion of predictive maintenance services for aircraft Integration of AI-driven analytics for repair optimization

By 2035, the market is expected to be robust, driven by innovation and enhanced service offerings.

Market Segmentation

aerospace-components-testing-and-repair-market End Use Outlook

  • Commercial Aviation
  • Military Aviation
  • Space Exploration
  • General Aviation
  • Unmanned Aerial Vehicles

aerospace-components-testing-and-repair-market Technology Outlook

  • Traditional Testing Methods
  • Advanced Testing Techniques
  • Digital Testing Solutions
  • Automated Testing Systems
  • Simulation-Based Testing

aerospace-components-testing-and-repair-market Application Outlook

  • Structural Testing
  • Functional Testing
  • Non-Destructive Testing
  • Environmental Testing
  • Performance Testing

aerospace-components-testing-and-repair-market Service Type Outlook

  • Testing Services
  • Repair Services
  • Maintenance Services
  • Certification Services
  • Inspection Services

aerospace-components-testing-and-repair-market Component Type Outlook

  • Airframe Components
  • Engine Components
  • Avionics Components
  • Landing Gear Components
  • Fuel System Components

Report Scope

MARKET SIZE 2024 22.5(USD Billion)
MARKET SIZE 2025 23.4(USD Billion)
MARKET SIZE 2035 34.7(USD Billion)
COMPOUND ANNUAL GROWTH RATE (CAGR) 4.02% (2025 - 2035)
REPORT COVERAGE Revenue Forecast, Competitive Landscape, Growth Factors, and Trends
BASE YEAR 2024
Market Forecast Period 2025 - 2035
Historical Data 2019 - 2024
Market Forecast Units USD Billion
Key Companies Profiled Boeing (US), Airbus (FR), General Electric (US), Honeywell (US), Rolls-Royce (GB), Safran (FR), Northrop Grumman (US), Raytheon Technologies (US), L3Harris Technologies (US)
Segments Covered Application, End Use, Component Type, Service Type, Technology
Key Market Opportunities Integration of advanced predictive maintenance technologies enhances efficiency in the Aerospace Components Testing and Repair Market.
Key Market Dynamics Technological advancements and regulatory changes drive innovation and efficiency in aerospace components testing and repair services.
Countries Covered North America, Europe, APAC, South America, MEA

Table of Contents

  1. SECTION I: EXECUTIVE SUMMARY AND KEY HIGHLIGHTS |
    1. 1.1 EXECUTIVE SUMMARY | |
      1. 1.1.1 Market Overview | |
      2. 1.1.2 Key Findings | |
      3. 1.1.3 Market Segmentation | |
      4. 1.1.4 Competitive Landscape | |
      5. 1.1.5 Challenges and Opportunities | |
      6. 1.1.6 Future Outlook 2
  2. SECTION II: SCOPING, METHODOLOGY AND MARKET STRUCTURE |
    1. 2.1 MARKET INTRODUCTION | |
      1. 2.1.1 Definition | |
      2. 2.1.2 Scope of the study | | |
        1. 2.1.2.1 Research Objective | | |
        2. 2.1.2.2 Assumption | | |
        3. 2.1.2.3 Limitations |
    2. 2.2 RESEARCH METHODOLOGY | |
      1. 2.2.1 Overview | |
      2. 2.2.2 Data Mining | |
      3. 2.2.3 Secondary Research | |
      4. 2.2.4 Primary Research | | |
        1. 2.2.4.1 Primary Interviews and Information Gathering Process | | |
        2. 2.2.4.2 Breakdown of Primary Respondents | |
      5. 2.2.5 Forecasting Model | |
      6. 2.2.6 Market Size Estimation | | |
        1. 2.2.6.1 Bottom-Up Approach | | |
        2. 2.2.6.2 Top-Down Approach | |
      7. 2.2.7 Data Triangulation | |
      8. 2.2.8 Validation 3
  3. SECTION III: QUALITATIVE ANALYSIS |
    1. 3.1 MARKET DYNAMICS | |
      1. 3.1.1 Overview | |
      2. 3.1.2 Drivers | |
      3. 3.1.3 Restraints | |
      4. 3.1.4 Opportunities |
    2. 3.2 MARKET FACTOR ANALYSIS | |
      1. 3.2.1 Value chain Analysis | |
      2. 3.2.2 Porter's Five Forces Analysis | | |
        1. 3.2.2.1 Bargaining Power of Suppliers | | |
        2. 3.2.2.2 Bargaining Power of Buyers | | |
        3. 3.2.2.3 Threat of New Entrants | | |
        4. 3.2.2.4 Threat of Substitutes | | |
        5. 3.2.2.5 Intensity of Rivalry | |
      3. 3.2.3 COVID-19 Impact Analysis | | |
        1. 3.2.3.1 Market Impact Analysis | | |
        2. 3.2.3.2 Regional Impact | | |
        3. 3.2.3.3 Opportunity and Threat Analysis 4
  4. SECTION IV: QUANTITATIVE ANALYSIS |
    1. 4.1 Food, Beverages & Nutrition, BY Application (USD Billion) | |
      1. 4.1.1 Structural Testing | |
      2. 4.1.2 Functional Testing | |
      3. 4.1.3 Non-Destructive Testing | |
      4. 4.1.4 Environmental Testing | |
      5. 4.1.5 Performance Testing |
    2. 4.2 Food, Beverages & Nutrition, BY End Use (USD Billion) | |
      1. 4.2.1 Commercial Aviation | |
      2. 4.2.2 Military Aviation | |
      3. 4.2.3 Space Exploration | |
      4. 4.2.4 General Aviation | |
      5. 4.2.5 Unmanned Aerial Vehicles |
    3. 4.3 Food, Beverages & Nutrition, BY Component Type (USD Billion) | |
      1. 4.3.1 Airframe Components | |
      2. 4.3.2 Engine Components | |
      3. 4.3.3 Avionics Components | |
      4. 4.3.4 Landing Gear Components | |
      5. 4.3.5 Fuel System Components |
    4. 4.4 Food, Beverages & Nutrition, BY Service Type (USD Billion) | |
      1. 4.4.1 Testing Services | |
      2. 4.4.2 Repair Services | |
      3. 4.4.3 Maintenance Services | |
      4. 4.4.4 Certification Services | |
      5. 4.4.5 Inspection Services |
    5. 4.5 Food, Beverages & Nutrition, BY Technology (USD Billion) | |
      1. 4.5.1 Traditional Testing Methods | |
      2. 4.5.2 Advanced Testing Techniques | |
      3. 4.5.3 Digital Testing Solutions | |
      4. 4.5.4 Automated Testing Systems | |
      5. 4.5.5 Simulation-Based Testing |
    6. 4.6 Food, Beverages & Nutrition, BY Region (USD Billion) | |
      1. 4.6.1 North America | | |
        1. 4.6.1.1 US | | |
        2. 4.6.1.2 Canada | |
      2. 4.6.2 Europe | | |
        1. 4.6.2.1 Germany | | |
        2. 4.6.2.2 UK | | |
        3. 4.6.2.3 France | | |
        4. 4.6.2.4 Russia | | |
        5. 4.6.2.5 Italy | | |
        6. 4.6.2.6 Spain | | |
        7. 4.6.2.7 Rest of Europe | |
      3. 4.6.3 APAC | | |
        1. 4.6.3.1 China | | |
        2. 4.6.3.2 India | | |
        3. 4.6.3.3 Japan | | |
        4. 4.6.3.4 South Korea | | |
        5. 4.6.3.5 Malaysia | | |
        6. 4.6.3.6 Thailand | | |
        7. 4.6.3.7 Indonesia | | |
        8. 4.6.3.8 Rest of APAC | |
      4. 4.6.4 South America | | |
        1. 4.6.4.1 Brazil | | |
        2. 4.6.4.2 Mexico | | |
        3. 4.6.4.3 Argentina | | |
        4. 4.6.4.4 Rest of South America | |
      5. 4.6.5 MEA | | |
        1. 4.6.5.1 GCC Countries | | |
        2. 4.6.5.2 South Africa | | |
        3. 4.6.5.3 Rest of MEA 5
  5. SECTION V: COMPETITIVE ANALYSIS |
    1. 5.1 Competitive Landscape | |
      1. 5.1.1 Overview | |
      2. 5.1.2 Competitive Analysis | |
      3. 5.1.3 Market share Analysis | |
      4. 5.1.4 Major Growth Strategy in the Food, Beverages & Nutrition | |
      5. 5.1.5 Competitive Benchmarking | |
      6. 5.1.6 Leading Players in Terms of Number of Developments in the Food, Beverages & Nutrition | |
      7. 5.1.7 Key developments and growth strategies | | |
        1. 5.1.7.1 New Product Launch/Service Deployment | | |
        2. 5.1.7.2 Merger & Acquisitions | | |
        3. 5.1.7.3 Joint Ventures | |
      8. 5.1.8 Major Players Financial Matrix | | |
        1. 5.1.8.1 Sales and Operating Income | | |
        2. 5.1.8.2 Major Players R&D Expenditure. 2023 |
    2. 5.2 Company Profiles | |
      1. 5.2.1 Boeing (US) | | |
        1. 5.2.1.1 Financial Overview | | |
        2. 5.2.1.2 Products Offered | | |
        3. 5.2.1.3 Key Developments | | |
        4. 5.2.1.4 SWOT Analysis | | |
        5. 5.2.1.5 Key Strategies | |
      2. 5.2.2 Airbus (FR) | | |
        1. 5.2.2.1 Financial Overview | | |
        2. 5.2.2.2 Products Offered | | |
        3. 5.2.2.3 Key Developments | | |
        4. 5.2.2.4 SWOT Analysis | | |
        5. 5.2.2.5 Key Strategies | |
      3. 5.2.3 General Electric (US) | | |
        1. 5.2.3.1 Financial Overview | | |
        2. 5.2.3.2 Products Offered | | |
        3. 5.2.3.3 Key Developments | | |
        4. 5.2.3.4 SWOT Analysis | | |
        5. 5.2.3.5 Key Strategies | |
      4. 5.2.4 Honeywell (US) | | |
        1. 5.2.4.1 Financial Overview | | |
        2. 5.2.4.2 Products Offered | | |
        3. 5.2.4.3 Key Developments | | |
        4. 5.2.4.4 SWOT Analysis | | |
        5. 5.2.4.5 Key Strategies | |
      5. 5.2.5 Rolls-Royce (GB) | | |
        1. 5.2.5.1 Financial Overview | | |
        2. 5.2.5.2 Products Offered | | |
        3. 5.2.5.3 Key Developments | | |
        4. 5.2.5.4 SWOT Analysis | | |
        5. 5.2.5.5 Key Strategies | |
      6. 5.2.6 Safran (FR) | | |
        1. 5.2.6.1 Financial Overview | | |
        2. 5.2.6.2 Products Offered | | |
        3. 5.2.6.3 Key Developments | | |
        4. 5.2.6.4 SWOT Analysis | | |
        5. 5.2.6.5 Key Strategies | |
      7. 5.2.7 Northrop Grumman (US) | | |
        1. 5.2.7.1 Financial Overview | | |
        2. 5.2.7.2 Products Offered | | |
        3. 5.2.7.3 Key Developments | | |
        4. 5.2.7.4 SWOT Analysis | | |
        5. 5.2.7.5 Key Strategies | |
      8. 5.2.8 Raytheon Technologies (US) | | |
        1. 5.2.8.1 Financial Overview | | |
        2. 5.2.8.2 Products Offered | | |
        3. 5.2.8.3 Key Developments | | |
        4. 5.2.8.4 SWOT Analysis | | |
        5. 5.2.8.5 Key Strategies | |
      9. 5.2.9 L3Harris Technologies (US) | | |
        1. 5.2.9.1 Financial Overview | | |
        2. 5.2.9.2 Products Offered | | |
        3. 5.2.9.3 Key Developments | | |
        4. 5.2.9.4 SWOT Analysis | | |
        5. 5.2.9.5 Key Strategies |
    3. 5.3 Appendix | |
      1. 5.3.1 References | |
      2. 5.3.2 Related Reports 6 LIST OF FIGURES |
    4. 6.1 MARKET SYNOPSIS |
    5. 6.2 NORTH AMERICA MARKET ANALYSIS |
    6. 6.3 US MARKET ANALYSIS BY APPLICATION |
    7. 6.4 US MARKET ANALYSIS BY END USE |
    8. 6.5 US MARKET ANALYSIS BY COMPONENT TYPE |
    9. 6.6 US MARKET ANALYSIS BY SERVICE TYPE |
    10. 6.7 US MARKET ANALYSIS BY TECHNOLOGY |
    11. 6.8 CANADA MARKET ANALYSIS BY APPLICATION |
    12. 6.9 CANADA MARKET ANALYSIS BY END USE |
    13. 6.10 CANADA MARKET ANALYSIS BY COMPONENT TYPE |
    14. 6.11 CANADA MARKET ANALYSIS BY SERVICE TYPE |
    15. 6.12 CANADA MARKET ANALYSIS BY TECHNOLOGY |
    16. 6.13 EUROPE MARKET ANALYSIS |
    17. 6.14 GERMANY MARKET ANALYSIS BY APPLICATION |
    18. 6.15 GERMANY MARKET ANALYSIS BY END USE |
    19. 6.16 GERMANY MARKET ANALYSIS BY COMPONENT TYPE |
    20. 6.17 GERMANY MARKET ANALYSIS BY SERVICE TYPE |
    21. 6.18 GERMANY MARKET ANALYSIS BY TECHNOLOGY |
    22. 6.19 UK MARKET ANALYSIS BY APPLICATION |
    23. 6.20 UK MARKET ANALYSIS BY END USE |
    24. 6.21 UK MARKET ANALYSIS BY COMPONENT TYPE |
    25. 6.22 UK MARKET ANALYSIS BY SERVICE TYPE |
    26. 6.23 UK MARKET ANALYSIS BY TECHNOLOGY |
    27. 6.24 FRANCE MARKET ANALYSIS BY APPLICATION |
    28. 6.25 FRANCE MARKET ANALYSIS BY END USE |
    29. 6.26 FRANCE MARKET ANALYSIS BY COMPONENT TYPE |
    30. 6.27 FRANCE MARKET ANALYSIS BY SERVICE TYPE |
    31. 6.28 FRANCE MARKET ANALYSIS BY TECHNOLOGY |
    32. 6.29 RUSSIA MARKET ANALYSIS BY APPLICATION |
    33. 6.30 RUSSIA MARKET ANALYSIS BY END USE |
    34. 6.31 RUSSIA MARKET ANALYSIS BY COMPONENT TYPE |
    35. 6.32 RUSSIA MARKET ANALYSIS BY SERVICE TYPE |
    36. 6.33 RUSSIA MARKET ANALYSIS BY TECHNOLOGY |
    37. 6.34 ITALY MARKET ANALYSIS BY APPLICATION |
    38. 6.35 ITALY MARKET ANALYSIS BY END USE |
    39. 6.36 ITALY MARKET ANALYSIS BY COMPONENT TYPE |
    40. 6.37 ITALY MARKET ANALYSIS BY SERVICE TYPE |
    41. 6.38 ITALY MARKET ANALYSIS BY TECHNOLOGY |
    42. 6.39 SPAIN MARKET ANALYSIS BY APPLICATION |
    43. 6.40 SPAIN MARKET ANALYSIS BY END USE |
    44. 6.41 SPAIN MARKET ANALYSIS BY COMPONENT TYPE |
    45. 6.42 SPAIN MARKET ANALYSIS BY SERVICE TYPE |
    46. 6.43 SPAIN MARKET ANALYSIS BY TECHNOLOGY |
    47. 6.44 REST OF EUROPE MARKET ANALYSIS BY APPLICATION |
    48. 6.45 REST OF EUROPE MARKET ANALYSIS BY END USE |
    49. 6.46 REST OF EUROPE MARKET ANALYSIS BY COMPONENT TYPE |
    50. 6.47 REST OF EUROPE MARKET ANALYSIS BY SERVICE TYPE |
    51. 6.48 REST OF EUROPE MARKET ANALYSIS BY TECHNOLOGY |
    52. 6.49 APAC MARKET ANALYSIS |
    53. 6.50 CHINA MARKET ANALYSIS BY APPLICATION |
    54. 6.51 CHINA MARKET ANALYSIS BY END USE |
    55. 6.52 CHINA MARKET ANALYSIS BY COMPONENT TYPE |
    56. 6.53 CHINA MARKET ANALYSIS BY SERVICE TYPE |
    57. 6.54 CHINA MARKET ANALYSIS BY TECHNOLOGY |
    58. 6.55 INDIA MARKET ANALYSIS BY APPLICATION |
    59. 6.56 INDIA MARKET ANALYSIS BY END USE |
    60. 6.57 INDIA MARKET ANALYSIS BY COMPONENT TYPE |
    61. 6.58 INDIA MARKET ANALYSIS BY SERVICE TYPE |
    62. 6.59 INDIA MARKET ANALYSIS BY TECHNOLOGY |
    63. 6.60 JAPAN MARKET ANALYSIS BY APPLICATION |
    64. 6.61 JAPAN MARKET ANALYSIS BY END USE |
    65. 6.62 JAPAN MARKET ANALYSIS BY COMPONENT TYPE |
    66. 6.63 JAPAN MARKET ANALYSIS BY SERVICE TYPE |
    67. 6.64 JAPAN MARKET ANALYSIS BY TECHNOLOGY |
    68. 6.65 SOUTH KOREA MARKET ANALYSIS BY APPLICATION |
    69. 6.66 SOUTH KOREA MARKET ANALYSIS BY END USE |
    70. 6.67 SOUTH KOREA MARKET ANALYSIS BY COMPONENT TYPE |
    71. 6.68 SOUTH KOREA MARKET ANALYSIS BY SERVICE TYPE |
    72. 6.69 SOUTH KOREA MARKET ANALYSIS BY TECHNOLOGY |
    73. 6.70 MALAYSIA MARKET ANALYSIS BY APPLICATION |
    74. 6.71 MALAYSIA MARKET ANALYSIS BY END USE |
    75. 6.72 MALAYSIA MARKET ANALYSIS BY COMPONENT TYPE |
    76. 6.73 MALAYSIA MARKET ANALYSIS BY SERVICE TYPE |
    77. 6.74 MALAYSIA MARKET ANALYSIS BY TECHNOLOGY |
    78. 6.75 THAILAND MARKET ANALYSIS BY APPLICATION |
    79. 6.76 THAILAND MARKET ANALYSIS BY END USE |
    80. 6.77 THAILAND MARKET ANALYSIS BY COMPONENT TYPE |
    81. 6.78 THAILAND MARKET ANALYSIS BY SERVICE TYPE |
    82. 6.79 THAILAND MARKET ANALYSIS BY TECHNOLOGY |
    83. 6.80 INDONESIA MARKET ANALYSIS BY APPLICATION |
    84. 6.81 INDONESIA MARKET ANALYSIS BY END USE |
    85. 6.82 INDONESIA MARKET ANALYSIS BY COMPONENT TYPE |
    86. 6.83 INDONESIA MARKET ANALYSIS BY SERVICE TYPE |
    87. 6.84 INDONESIA MARKET ANALYSIS BY TECHNOLOGY |
    88. 6.85 REST OF APAC MARKET ANALYSIS BY APPLICATION |
    89. 6.86 REST OF APAC MARKET ANALYSIS BY END USE |
    90. 6.87 REST OF APAC MARKET ANALYSIS BY COMPONENT TYPE |
    91. 6.88 REST OF APAC MARKET ANALYSIS BY SERVICE TYPE |
    92. 6.89 REST OF APAC MARKET ANALYSIS BY TECHNOLOGY |
    93. 6.90 SOUTH AMERICA MARKET ANALYSIS |
    94. 6.91 BRAZIL MARKET ANALYSIS BY APPLICATION |
    95. 6.92 BRAZIL MARKET ANALYSIS BY END USE |
    96. 6.93 BRAZIL MARKET ANALYSIS BY COMPONENT TYPE |
    97. 6.94 BRAZIL MARKET ANALYSIS BY SERVICE TYPE |
    98. 6.95 BRAZIL MARKET ANALYSIS BY TECHNOLOGY |
    99. 6.96 MEXICO MARKET ANALYSIS BY APPLICATION |
    100. 6.97 MEXICO MARKET ANALYSIS BY END USE |
    101. 6.98 MEXICO MARKET ANALYSIS BY COMPONENT TYPE |
    102. 6.99 MEXICO MARKET ANALYSIS BY SERVICE TYPE |
    103. 6.100 MEXICO MARKET ANALYSIS BY TECHNOLOGY |
    104. 6.101 ARGENTINA MARKET ANALYSIS BY APPLICATION |
    105. 6.102 ARGENTINA MARKET ANALYSIS BY END USE |
    106. 6.103 ARGENTINA MARKET ANALYSIS BY COMPONENT TYPE |
    107. 6.104 ARGENTINA MARKET ANALYSIS BY SERVICE TYPE |
    108. 6.105 ARGENTINA MARKET ANALYSIS BY TECHNOLOGY |
    109. 6.106 REST OF SOUTH AMERICA MARKET ANALYSIS BY APPLICATION |
    110. 6.107 REST OF SOUTH AMERICA MARKET ANALYSIS BY END USE |
    111. 6.108 REST OF SOUTH AMERICA MARKET ANALYSIS BY COMPONENT TYPE |
    112. 6.109 REST OF SOUTH AMERICA MARKET ANALYSIS BY SERVICE TYPE |
    113. 6.110 REST OF SOUTH AMERICA MARKET ANALYSIS BY TECHNOLOGY |
    114. 6.111 MEA MARKET ANALYSIS |
    115. 6.112 GCC COUNTRIES MARKET ANALYSIS BY APPLICATION |
    116. 6.113 GCC COUNTRIES MARKET ANALYSIS BY END USE |
    117. 6.114 GCC COUNTRIES MARKET ANALYSIS BY COMPONENT TYPE |
    118. 6.115 GCC COUNTRIES MARKET ANALYSIS BY SERVICE TYPE |
    119. 6.116 GCC COUNTRIES MARKET ANALYSIS BY TECHNOLOGY |
    120. 6.117 SOUTH AFRICA MARKET ANALYSIS BY APPLICATION |
    121. 6.118 SOUTH AFRICA MARKET ANALYSIS BY END USE |
    122. 6.119 SOUTH AFRICA MARKET ANALYSIS BY COMPONENT TYPE |
    123. 6.120 SOUTH AFRICA MARKET ANALYSIS BY SERVICE TYPE |
    124. 6.121 SOUTH AFRICA MARKET ANALYSIS BY TECHNOLOGY |
    125. 6.122 REST OF MEA MARKET ANALYSIS BY APPLICATION |
    126. 6.123 REST OF MEA MARKET ANALYSIS BY END USE |
    127. 6.124 REST OF MEA MARKET ANALYSIS BY COMPONENT TYPE |
    128. 6.125 REST OF MEA MARKET ANALYSIS BY SERVICE TYPE |
    129. 6.126 REST OF MEA MARKET ANALYSIS BY TECHNOLOGY |
    130. 6.127 KEY BUYING CRITERIA OF FOOD, BEVERAGES & NUTRITION |
    131. 6.128 RESEARCH PROCESS OF MRFR |
    132. 6.129 DRO ANALYSIS OF FOOD, BEVERAGES & NUTRITION |
    133. 6.130 DRIVERS IMPACT ANALYSIS: FOOD, BEVERAGES & NUTRITION |
    134. 6.131 RESTRAINTS IMPACT ANALYSIS: FOOD, BEVERAGES & NUTRITION |
    135. 6.132 SUPPLY / VALUE CHAIN: FOOD, BEVERAGES & NUTRITION |
    136. 6.133 FOOD, BEVERAGES & NUTRITION, BY APPLICATION, 2024 (% SHARE) |
    137. 6.134 FOOD, BEVERAGES & NUTRITION, BY APPLICATION, 2024 TO 2035 (USD Billion) |
    138. 6.135 FOOD, BEVERAGES & NUTRITION, BY END USE, 2024 (% SHARE) |
    139. 6.136 FOOD, BEVERAGES & NUTRITION, BY END USE, 2024 TO 2035 (USD Billion) |
    140. 6.137 FOOD, BEVERAGES & NUTRITION, BY COMPONENT TYPE, 2024 (% SHARE) |
    141. 6.138 FOOD, BEVERAGES & NUTRITION, BY COMPONENT TYPE, 2024 TO 2035 (USD Billion) |
    142. 6.139 FOOD, BEVERAGES & NUTRITION, BY SERVICE TYPE, 2024 (% SHARE) |
    143. 6.140 FOOD, BEVERAGES & NUTRITION, BY SERVICE TYPE, 2024 TO 2035 (USD Billion) |
    144. 6.141 FOOD, BEVERAGES & NUTRITION, BY TECHNOLOGY, 2024 (% SHARE) |
    145. 6.142 FOOD, BEVERAGES & NUTRITION, BY TECHNOLOGY, 2024 TO 2035 (USD Billion) |
    146. 6.143 BENCHMARKING OF MAJOR COMPETITORS 7 LIST OF TABLES |
    147. 7.1 LIST OF ASSUMPTIONS | |
      1. 7.1.1 |
    148. 7.2 North America MARKET SIZE ESTIMATES; FORECAST | |
      1. 7.2.1 BY APPLICATION, 2025-2035 (USD Billion) | |
      2. 7.2.2 BY END USE, 2025-2035 (USD Billion) | |
      3. 7.2.3 BY COMPONENT TYPE, 2025-2035 (USD Billion) | |
      4. 7.2.4 BY SERVICE TYPE, 2025-2035 (USD Billion) | |
      5. 7.2.5 BY TECHNOLOGY, 2025-2035 (USD Billion) |
    149. 7.3 US MARKET SIZE ESTIMATES; FORECAST | |
      1. 7.3.1 BY APPLICATION, 2025-2035 (USD Billion) | |
      2. 7.3.2 BY END USE, 2025-2035 (USD Billion) | |
      3. 7.3.3 BY COMPONENT TYPE, 2025-2035 (USD Billion) | |
      4. 7.3.4 BY SERVICE TYPE, 2025-2035 (USD Billion) | |
      5. 7.3.5 BY TECHNOLOGY, 2025-2035 (USD Billion) |
    150. 7.4 Canada MARKET SIZE ESTIMATES; FORECAST | |
      1. 7.4.1 BY APPLICATION, 2025-2035 (USD Billion) | |
      2. 7.4.2 BY END USE, 2025-2035 (USD Billion) | |
      3. 7.4.3 BY COMPONENT TYPE, 2025-2035 (USD Billion) | |
      4. 7.4.4 BY SERVICE TYPE, 2025-2035 (USD Billion) | |
      5. 7.4.5 BY TECHNOLOGY, 2025-2035 (USD Billion) |
    151. 7.5 Europe MARKET SIZE ESTIMATES; FORECAST | |
      1. 7.5.1 BY APPLICATION, 2025-2035 (USD Billion) | |
      2. 7.5.2 BY END USE, 2025-2035 (USD Billion) | |
      3. 7.5.3 BY COMPONENT TYPE, 2025-2035 (USD Billion) | |
      4. 7.5.4 BY SERVICE TYPE, 2025-2035 (USD Billion) | |
      5. 7.5.5 BY TECHNOLOGY, 2025-2035 (USD Billion) |
    152. 7.6 Germany MARKET SIZE ESTIMATES; FORECAST | |
      1. 7.6.1 BY APPLICATION, 2025-2035 (USD Billion) | |
      2. 7.6.2 BY END USE, 2025-2035 (USD Billion) | |
      3. 7.6.3 BY COMPONENT TYPE, 2025-2035 (USD Billion) | |
      4. 7.6.4 BY SERVICE TYPE, 2025-2035 (USD Billion) | |
      5. 7.6.5 BY TECHNOLOGY, 2025-2035 (USD Billion) |
    153. 7.7 UK MARKET SIZE ESTIMATES; FORECAST | |
      1. 7.7.1 BY APPLICATION, 2025-2035 (USD Billion) | |
      2. 7.7.2 BY END USE, 2025-2035 (USD Billion) | |
      3. 7.7.3 BY COMPONENT TYPE, 2025-2035 (USD Billion) | |
      4. 7.7.4 BY SERVICE TYPE, 2025-2035 (USD Billion) | |
      5. 7.7.5 BY TECHNOLOGY, 2025-2035 (USD Billion) |
    154. 7.8 France MARKET SIZE ESTIMATES; FORECAST | |
      1. 7.8.1 BY APPLICATION, 2025-2035 (USD Billion) | |
      2. 7.8.2 BY END USE, 2025-2035 (USD Billion) | |
      3. 7.8.3 BY COMPONENT TYPE, 2025-2035 (USD Billion) | |
      4. 7.8.4 BY SERVICE TYPE, 2025-2035 (USD Billion) | |
      5. 7.8.5 BY TECHNOLOGY, 2025-2035 (USD Billion) |
    155. 7.9 Russia MARKET SIZE ESTIMATES; FORECAST | |
      1. 7.9.1 BY APPLICATION, 2025-2035 (USD Billion) | |
      2. 7.9.2 BY END USE, 2025-2035 (USD Billion) | |
      3. 7.9.3 BY COMPONENT TYPE, 2025-2035 (USD Billion) | |
      4. 7.9.4 BY SERVICE TYPE, 2025-2035 (USD Billion) | |
      5. 7.9.5 BY TECHNOLOGY, 2025-2035 (USD Billion) |
    156. 7.10 Italy MARKET SIZE ESTIMATES; FORECAST | |
      1. 7.10.1 BY APPLICATION, 2025-2035 (USD Billion) | |
      2. 7.10.2 BY END USE, 2025-2035 (USD Billion) | |
      3. 7.10.3 BY COMPONENT TYPE, 2025-2035 (USD Billion) | |
      4. 7.10.4 BY SERVICE TYPE, 2025-2035 (USD Billion) | |
      5. 7.10.5 BY TECHNOLOGY, 2025-2035 (USD Billion) |
    157. 7.11 Spain MARKET SIZE ESTIMATES; FORECAST | |
      1. 7.11.1 BY APPLICATION, 2025-2035 (USD Billion) | |
      2. 7.11.2 BY END USE, 2025-2035 (USD Billion) | |
      3. 7.11.3 BY COMPONENT TYPE, 2025-2035 (USD Billion) | |
      4. 7.11.4 BY SERVICE TYPE, 2025-2035 (USD Billion) | |
      5. 7.11.5 BY TECHNOLOGY, 2025-2035 (USD Billion) |
    158. 7.12 Rest of Europe MARKET SIZE ESTIMATES; FORECAST | |
      1. 7.12.1 BY APPLICATION, 2025-2035 (USD Billion) | |
      2. 7.12.2 BY END USE, 2025-2035 (USD Billion) | |
      3. 7.12.3 BY COMPONENT TYPE, 2025-2035 (USD Billion) | |
      4. 7.12.4 BY SERVICE TYPE, 2025-2035 (USD Billion) | |
      5. 7.12.5 BY TECHNOLOGY, 2025-2035 (USD Billion) |
    159. 7.13 APAC MARKET SIZE ESTIMATES; FORECAST | |
      1. 7.13.1 BY APPLICATION, 2025-2035 (USD Billion) | |
      2. 7.13.2 BY END USE, 2025-2035 (USD Billion) | |
      3. 7.13.3 BY COMPONENT TYPE, 2025-2035 (USD Billion) | |
      4. 7.13.4 BY SERVICE TYPE, 2025-2035 (USD Billion) | |
      5. 7.13.5 BY TECHNOLOGY, 2025-2035 (USD Billion) |
    160. 7.14 China MARKET SIZE ESTIMATES; FORECAST | |
      1. 7.14.1 BY APPLICATION, 2025-2035 (USD Billion) | |
      2. 7.14.2 BY END USE, 2025-2035 (USD Billion) | |
      3. 7.14.3 BY COMPONENT TYPE, 2025-2035 (USD Billion) | |
      4. 7.14.4 BY SERVICE TYPE, 2025-2035 (USD Billion) | |
      5. 7.14.5 BY TECHNOLOGY, 2025-2035 (USD Billion) |
    161. 7.15 India MARKET SIZE ESTIMATES; FORECAST | |
      1. 7.15.1 BY APPLICATION, 2025-2035 (USD Billion) | |
      2. 7.15.2 BY END USE, 2025-2035 (USD Billion) | |
      3. 7.15.3 BY COMPONENT TYPE, 2025-2035 (USD Billion) | |
      4. 7.15.4 BY SERVICE TYPE, 2025-2035 (USD Billion) | |
      5. 7.15.5 BY TECHNOLOGY, 2025-2035 (USD Billion) |
    162. 7.16 Japan MARKET SIZE ESTIMATES; FORECAST | |
      1. 7.16.1 BY APPLICATION, 2025-2035 (USD Billion) | |
      2. 7.16.2 BY END USE, 2025-2035 (USD Billion) | |
      3. 7.16.3 BY COMPONENT TYPE, 2025-2035 (USD Billion) | |
      4. 7.16.4 BY SERVICE TYPE, 2025-2035 (USD Billion) | |
      5. 7.16.5 BY TECHNOLOGY, 2025-2035 (USD Billion) |
    163. 7.17 South Korea MARKET SIZE ESTIMATES; FORECAST | |
      1. 7.17.1 BY APPLICATION, 2025-2035 (USD Billion) | |
      2. 7.17.2 BY END USE, 2025-2035 (USD Billion) | |
      3. 7.17.3 BY COMPONENT TYPE, 2025-2035 (USD Billion) | |
      4. 7.17.4 BY SERVICE TYPE, 2025-2035 (USD Billion) | |
      5. 7.17.5 BY TECHNOLOGY, 2025-2035 (USD Billion) |
    164. 7.18 Malaysia MARKET SIZE ESTIMATES; FORECAST | |
      1. 7.18.1 BY APPLICATION, 2025-2035 (USD Billion) | |
      2. 7.18.2 BY END USE, 2025-2035 (USD Billion) | |
      3. 7.18.3 BY COMPONENT TYPE, 2025-2035 (USD Billion) | |
      4. 7.18.4 BY SERVICE TYPE, 2025-2035 (USD Billion) | |
      5. 7.18.5 BY TECHNOLOGY, 2025-2035 (USD Billion) |
    165. 7.19 Thailand MARKET SIZE ESTIMATES; FORECAST | |
      1. 7.19.1 BY APPLICATION, 2025-2035 (USD Billion) | |
      2. 7.19.2 BY END USE, 2025-2035 (USD Billion) | |
      3. 7.19.3 BY COMPONENT TYPE, 2025-2035 (USD Billion) | |
      4. 7.19.4 BY SERVICE TYPE, 2025-2035 (USD Billion) | |
      5. 7.19.5 BY TECHNOLOGY, 2025-2035 (USD Billion) |
    166. 7.20 Indonesia MARKET SIZE ESTIMATES; FORECAST | |
      1. 7.20.1 BY APPLICATION, 2025-2035 (USD Billion) | |
      2. 7.20.2 BY END USE, 2025-2035 (USD Billion) | |
      3. 7.20.3 BY COMPONENT TYPE, 2025-2035 (USD Billion) | |
      4. 7.20.4 BY SERVICE TYPE, 2025-2035 (USD Billion) | |
      5. 7.20.5 BY TECHNOLOGY, 2025-2035 (USD Billion) |
    167. 7.21 Rest of APAC MARKET SIZE ESTIMATES; FORECAST | |
      1. 7.21.1 BY APPLICATION, 2025-2035 (USD Billion) | |
      2. 7.21.2 BY END USE, 2025-2035 (USD Billion) | |
      3. 7.21.3 BY COMPONENT TYPE, 2025-2035 (USD Billion) | |
      4. 7.21.4 BY SERVICE TYPE, 2025-2035 (USD Billion) | |
      5. 7.21.5 BY TECHNOLOGY, 2025-2035 (USD Billion) |
    168. 7.22 South America MARKET SIZE ESTIMATES; FORECAST | |
      1. 7.22.1 BY APPLICATION, 2025-2035 (USD Billion) | |
      2. 7.22.2 BY END USE, 2025-2035 (USD Billion) | |
      3. 7.22.3 BY COMPONENT TYPE, 2025-2035 (USD Billion) | |
      4. 7.22.4 BY SERVICE TYPE, 2025-2035 (USD Billion) | |
      5. 7.22.5 BY TECHNOLOGY, 2025-2035 (USD Billion) |
    169. 7.23 Brazil MARKET SIZE ESTIMATES; FORECAST | |
      1. 7.23.1 BY APPLICATION, 2025-2035 (USD Billion) | |
      2. 7.23.2 BY END USE, 2025-2035 (USD Billion) | |
      3. 7.23.3 BY COMPONENT TYPE, 2025-2035 (USD Billion) | |
      4. 7.23.4 BY SERVICE TYPE, 2025-2035 (USD Billion) | |
      5. 7.23.5 BY TECHNOLOGY, 2025-2035 (USD Billion) |
    170. 7.24 Mexico MARKET SIZE ESTIMATES; FORECAST | |
      1. 7.24.1 BY APPLICATION, 2025-2035 (USD Billion) | |
      2. 7.24.2 BY END USE, 2025-2035 (USD Billion) | |
      3. 7.24.3 BY COMPONENT TYPE, 2025-2035 (USD Billion) | |
      4. 7.24.4 BY SERVICE TYPE, 2025-2035 (USD Billion) | |
      5. 7.24.5 BY TECHNOLOGY, 2025-2035 (USD Billion) |
    171. 7.25 Argentina MARKET SIZE ESTIMATES; FORECAST | |
      1. 7.25.1 BY APPLICATION, 2025-2035 (USD Billion) | |
      2. 7.25.2 BY END USE, 2025-2035 (USD Billion) | |
      3. 7.25.3 BY COMPONENT TYPE, 2025-2035 (USD Billion) | |
      4. 7.25.4 BY SERVICE TYPE, 2025-2035 (USD Billion) | |
      5. 7.25.5 BY TECHNOLOGY, 2025-2035 (USD Billion) |
    172. 7.26 Rest of South America MARKET SIZE ESTIMATES; FORECAST | |
      1. 7.26.1 BY APPLICATION, 2025-2035 (USD Billion) | |
      2. 7.26.2 BY END USE, 2025-2035 (USD Billion) | |
      3. 7.26.3 BY COMPONENT TYPE, 2025-2035 (USD Billion) | |
      4. 7.26.4 BY SERVICE TYPE, 2025-2035 (USD Billion) | |
      5. 7.26.5 BY TECHNOLOGY, 2025-2035 (USD Billion) |
    173. 7.27 MEA MARKET SIZE ESTIMATES; FORECAST | |
      1. 7.27.1 BY APPLICATION, 2025-2035 (USD Billion) | |
      2. 7.27.2 BY END USE, 2025-2035 (USD Billion) | |
      3. 7.27.3 BY COMPONENT TYPE, 2025-2035 (USD Billion) | |
      4. 7.27.4 BY SERVICE TYPE, 2025-2035 (USD Billion) | |
      5. 7.27.5 BY TECHNOLOGY, 2025-2035 (USD Billion) |
    174. 7.28 GCC Countries MARKET SIZE ESTIMATES; FORECAST | |
      1. 7.28.1 BY APPLICATION, 2025-2035 (USD Billion) | |
      2. 7.28.2 BY END USE, 2025-2035 (USD Billion) | |
      3. 7.28.3 BY COMPONENT TYPE, 2025-2035 (USD Billion) | |
      4. 7.28.4 BY SERVICE TYPE, 2025-2035 (USD Billion) | |
      5. 7.28.5 BY TECHNOLOGY, 2025-2035 (USD Billion) |
    175. 7.29 South Africa MARKET SIZE ESTIMATES; FORECAST | |
      1. 7.29.1 BY APPLICATION, 2025-2035 (USD Billion) | |
      2. 7.29.2 BY END USE, 2025-2035 (USD Billion) | |
      3. 7.29.3 BY COMPONENT TYPE, 2025-2035 (USD Billion) | |
      4. 7.29.4 BY SERVICE TYPE, 2025-2035 (USD Billion) | |
      5. 7.29.5 BY TECHNOLOGY, 2025-2035 (USD Billion) |
    176. 7.30 Rest of MEA MARKET SIZE ESTIMATES; FORECAST | |
      1. 7.30.1 BY APPLICATION, 2025-2035 (USD Billion) | |
      2. 7.30.2 BY END USE, 2025-2035 (USD Billion) | |
      3. 7.30.3 BY COMPONENT TYPE, 2025-2035 (USD Billion) | |
      4. 7.30.4 BY SERVICE TYPE, 2025-2035 (USD Billion) | |
      5. 7.30.5 BY TECHNOLOGY, 2025-2035 (USD Billion) |
    177. 7.31 PRODUCT LAUNCH/PRODUCT DEVELOPMENT/APPROVAL | |
      1. 7.31.1 |
    178. 7.32 ACQUISITION/PARTNERSHIP | |

FAQs

What is the projected market valuation of the Aerospace Components Testing and Repair Market by 2035?

The projected market valuation for the Aerospace Components Testing and Repair Market is 34.7 USD Billion by 2035.

What was the market valuation of the Aerospace Components Testing and Repair Market in 2024?

The overall market valuation was 22.5 USD Billion in 2024.

What is the expected CAGR for the Aerospace Components Testing and Repair Market during the forecast period 2025 - 2035?

The expected CAGR for the Aerospace Components Testing and Repair Market during the forecast period 2025 - 2035 is 4.02%.

Which segment is projected to have the highest valuation in the Aerospace Components Testing and Repair Market by 2035?

The Performance Testing segment is projected to reach 11.2 USD Billion by 2035.

What are the key players in the Aerospace Components Testing and Repair Market?

Key players include Boeing, Airbus, General Electric, Honeywell, Rolls-Royce, Safran, Northrop Grumman, Raytheon Technologies, and L3Harris Technologies.

How much is the Commercial Aviation segment expected to grow by 2035?

The Commercial Aviation segment is expected to grow from 8.5 USD Billion to 13.5 USD Billion by 2035.

What is the projected valuation for Engine Components in the Aerospace Components Testing and Repair Market by 2035?

The projected valuation for Engine Components is expected to reach 10.5 USD Billion by 2035.

What is the anticipated growth for Repair Services in the Aerospace Components Testing and Repair Market?

Repair Services are anticipated to grow from 8.0 USD Billion to 12.0 USD Billion by 2035.

Which technology segment is expected to see significant growth by 2035?

The Advanced Testing Techniques segment is expected to grow from 6.0 USD Billion to 9.0 USD Billion by 2035.

What is the expected valuation for Non-Destructive Testing by 2035?

The Non-Destructive Testing segment is expected to reach 5.5 USD Billion by 2035.

Author
Author
Author Profile
Shubham Munde LinkedIn
Team Lead - Research
Shubham brings over 7 years of expertise in Market Intelligence and Strategic Consulting, with a strong focus on the Automotive, Aerospace, and Defense sectors. Backed by a solid foundation in semiconductors, electronics, and software, he has successfully delivered high-impact syndicated and custom research on a global scale. His core strengths include market sizing, forecasting, competitive intelligence, consumer insights, and supply chain mapping. Widely recognized for developing scalable growth strategies, Shubham empowers clients to navigate complex markets and achieve a lasting competitive edge. Trusted by start-ups and Fortune 500 companies alike, he consistently converts challenges into strategic opportunities that drive sustainable growth.
Co-Author
Co-Author Profile
Garvit Vyas LinkedIn
Vice President - Operations
Garvit Vyas is a Research Analyst with experience in working across multiple industry domains in the market research sector. Over the past four years, he has been actively involved in analyzing diverse markets, gathering industry insights, and contributing to the development of comprehensive research reports. His work includes studying market trends, evaluating competitive landscapes, and supporting data-driven business insights. In the early phase of his career, Garvit worked on cross-domain research projects, which helped him build a strong foundation in market analysis, data interpretation, and industry intelligence across various sectors. Later, he transitioned into the Quality Control (QC) function, where he focuses on reviewing and refining research reports and marketing collaterals to ensure accuracy, consistency, and high editorial standards. His responsibilities include validating research data, improving report structure, and maintaining the overall quality of published content. Garvit is committed to maintaining strong research integrity and delivering reliable insights that support informed business decision-making.
Share::
Request Free Sample
Download Free Sample

Kindly complete the form below to receive a free sample of this Report

Share::
Request Free Sample
Download PDF ×

We do not share your information with anyone. However, we may send you emails based on your report interest from time to time. You may contact us at any time to opt-out.