AI Infrastructure Market (2026 - 2035)

AI Infrastructure Market Size, Share and Research Report: By Component (Hardware, Software, Services), By Deployment Model (On-Premise, Cloud, Hybrid), By Application (Natural Language Processing, Computer Vision, Machine Learning, Predictive Analytics, Virtual Assistants), By Target Industries (Healthcare, Financial Services, Manufacturing, Retail, Transportation) and By Regional (North America, Europe, South America, Asia-Pacific, Middle East and Africa) - Industry Forecast to 2035.
ID: MRFR/ICT/28379-HCR
128 Pages
Ankit Gupta
Last Updated: July 13, 2026
AI Infrastructure Market
Market Size
Forecast Period2026-2035
CAGR (2026-2035)27.12%
2025 Market SizeUSD 32.0 Billion
2026 Market SizeUSD 40.7 Billion
2035 Market SizeUSD 353.0 Billion
Key Players
NVIDIA
Microsoft
Amazon
Alphabet
AMD
Intel
Opportunities
  • Liquid Cooling Retrofit Wave
  • AI Workload Optimization Platforms
  • Emerging Market Build-Outs

AI Infrastructure Market Summary

The ai infrastructure market closed 2025 at roughly USD 32.0 billion and is on track to reach USD 40.7 billion in 2026, then expand to USD 353.0 billion by 2035 at a 27.12% CAGR across the 2026–2035 forecast window. Two catalysts anchor this trajectory: the U.S. CHIPS and Science Act, which commits about USD 52 billion to domestic semiconductor capacity, and the unprecedented capital expenditure pledge from the eight largest hyperscalers — roughly USD 371 billion earmarked for AI data center build-outs in 2025 alone [1][2].

The antiquated CPU-centric, air-cooled data center model is being replaced. Operators are replacing it with GPU and custom-accelerator clusters that are connected via InfiniBand and 800G Ethernet fabrics. These clusters are powered by liquid-cooled containers that generate 100–130 kilowatts of compute density. In fiscal 2024, NVIDIA's Data Center segment generated USD 47.5 billion in revenue, a figure that indicates the extent to which the GPU computing infrastructure for AI build-out has become concentrated.


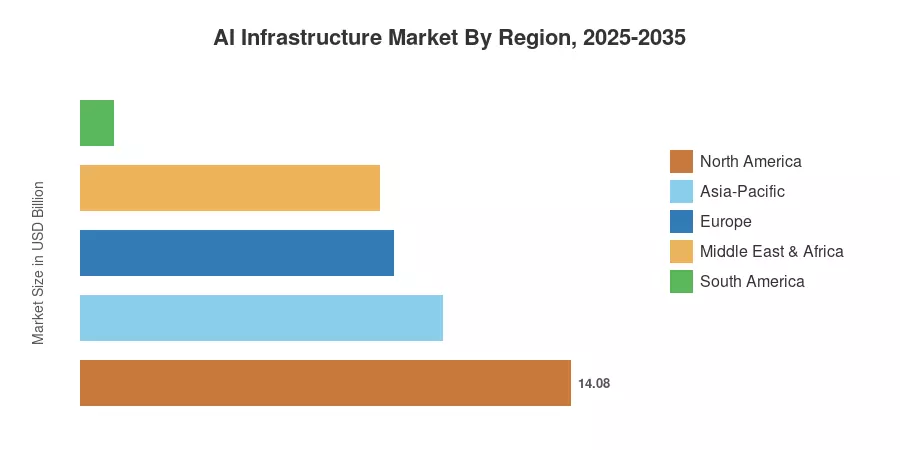
North America commands roughly 44% of global value, anchored by U.S. hyperscaler spend and the Stargate program. Asia-Pacific is the fastest-growing region, advancing at about 32.5% CAGR on the back of China's domestic AI policy push and India's IndiaAI Mission. Europe sits second-largest in absolute terms at approximately USD 9.0 billion in 2025, propelled by AI Act compliance investment and sovereign cloud projects. The decade ahead will be defined by who can secure power, accelerators, and inference economics — in that order.

Key Report Takeaways

• By Technology

  • Hardware remains the value anchor, accounting for roughly USD 19.0 billion of 2025 spend
  • Software is the fastest-growing layer at ~31% CAGR through 2035, led by orchestration and AI workload optimization platforms
  • Services hold approximately 12% share, with managed inference and MLOps consulting expanding rapidly

• By Sector

  • Healthcare commands about 22% sector share, driven by diagnostic imaging and drug discovery pipelines
  • Financial services is the fastest-growing vertical at ~30% CAGR, led by real-time fraud detection and risk scoring
  • Manufacturing holds roughly USD 4.8 billion in 2025 value through predictive maintenance and vision QC adoption

• By Region

  • North America holds 44% global share, anchored by hyperscaler campus build-outs
  • Asia-Pacific grows at 32.5% CAGR, the highest of any region
  • Europe represents approximately USD 9.0 billion in 2025 absolute value

Market Size and Forecast (2021–2035)

Figures below are triangulated from hyperscaler 10-K filings, NVIDIA quarterly disclosures tracker data, Synergy Research data center capex tables, and IEA's Electricity 2024 outlook on data center load growth. Historicals are adjusted to a constant-currency basis; forecasts assume continued accelerator supply normalization through 2027.
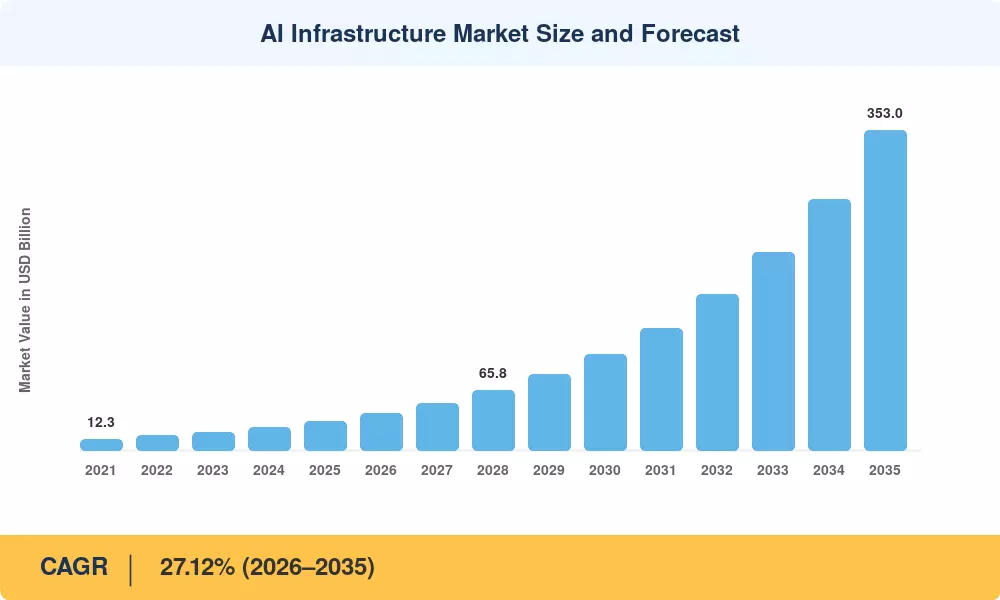
AI Infrastructure Market Size and Forecast
Our Impact
Enabled $4.3B Revenue Impact for Fortune 500 and Leading Multinationals
Partnering with 2000+ Global Organizations Each Year
30K+ Citations by Top-Tier Firms in the Industry

Driver Impact Analysis

Driver ~% Impact on CAGR Geographic Relevance Impact Timeline
Hyperscaler capex surge +5.5% Global, NA-led Short-term
Generative AI training demand +4.8% NA, APAC Short-term
Sovereign AI initiatives +3.5% EU, India, GCC Medium-term
Accelerator supply normalization +2.7% Global Medium-term
Edge AI deployment +2.0% APAC, NA Medium-term
Public AI infrastructure funding +1.8% US, EU Long-term
Inference platform monetization +1.5% Global Short-term


Hyperscaler Capital Expenditure Surge

The eight largest hyperscalers — Microsoft, Alphabet, Meta, Amazon, Oracle, Alibaba, Tencent, and Baidu — committed roughly USD 371 billion in 2025 capital expenditure, with the majority directed at AI data center hardware [1]. Microsoft alone telegraphed a USD 80 billion fiscal 2025 capex envelope, with more than half tied to AI-enabled infrastructure. This narrows the gap between announced demand and deployed capacity, but it also concentrates the buying power of the high-performance AI data center hardware market into roughly a dozen procurement teams.

Generative AI Training Demand

Frontier model training runs have moved from thousands of GPUs to tens of thousands per cluster within three years. OpenAI's GPT-4 reportedly used about 25,000 A100s; successor-class runs are sized for 100,000+ H100/B200 nodes. Each generation roughly doubles the compute requirement, and that doubling translates almost directly into scalable AI training compute clusters demand. NVIDIA's Data Center revenue of USD 47.5 billion in FY2024 captures the magnitude [3].

Sovereign AI Initiatives

Governments are no longer leaving accelerator allocation to market forces. India's IndiaAI Mission allocated INR 10,372 crore (about USD 1.25 billion), including a 10,000+ GPU shared compute facility [7]. France committed EUR 109 billion at its 2025 AI Action Summit. Saudi Arabia launched Humain with PIF backing in May 2025. These programs collectively underwrite a parallel demand stream that is not visible in hyperscaler capex tables.

Inference Platform Economics

Training was the 2020–2024 story; inference is the 2025–2035 story. Industry estimates suggest inference will absorb 70–80% of AI compute spend by 2030 as deployed models scale to billions of daily queries. This shift favors AI model serving infrastructure built around lower-power accelerators, sparsity-aware silicon, and disaggregated memory, opening room for AMD MI300X, Intel Gaudi, and custom silicon from AWS and Google.

Restraints Impact Analysis

Restraint ~% Impact on CAGR Geographic Relevance Impact Timeline
Power and grid interconnection delays -3.0% NA, EU Medium-term
GPU supply concentration risk -2.2% Global Short-term
Cooling and water constraints -1.5% APAC, MEA Medium-term
Regulatory compliance burden (EU AI Act) -1.0% EU Short-term
Capex-to-revenue ROI scrutiny -1.8% NA Medium-term


Power and Grid Interconnection

The IEA projects global data center electricity demand will roughly double to over 945 TWh by 2030, with AI as the primary driver [9]. Dominion Energy's interconnection queue in Northern Virginia stretches past 2030 for new large-load customers. Ireland has paused new Dublin-area data center connections. ERCOT in Texas has flagged AI loads as a top-three forward planning risk. Power, not silicon, is now the binding constraint for 2027–2030 capacity additions.

GPU Supply Concentration

NVIDIA controls roughly 80–90% of the AI training accelerator market, and TSMC fabricates the vast majority of those parts on advanced nodes. Any disruption — geopolitical, geological, or capacity-driven — telegraphs directly into deployment timelines. Buyers have responded by qualifying AMD, Intel, and custom silicon, but software-stack switching costs remain meaningful [3].

Capex Discipline and ROI Pressure

Equity markets have begun questioning whether hyperscaler AI capex will generate proportional revenue. Several Q4 2024 earnings calls saw analyst pushback on multi-year capex trajectories. If revenue from AI products lags capex by more than 24 months, marginal projects will be deferred — a real risk to the forecast tail [15].

AI Infrastructure Market Opportunities

Liquid Cooling Retrofit Wave

Air cooling caps out around 40 kW per rack; Blackwell-class deployments push 130 kW. This forces direct-to-chip and immersion cooling retrofits across legacy halls. The retrofit total addressable market is significant for established mechanical OEMs and a handful of specialist entrants

AI Workload Optimization Platforms

A new software category sits between the application layer and the silicon: orchestration software that fragments models across heterogeneous accelerators, manages KV-caches, and arbitrates between training and inference workloads. AI workload optimization platforms represent a high-margin opportunity where enterprises can monetize utilization gains of 30–50% on existing fleets

Emerging Market Build-Outs

India added more than 600 MW of new data center capacity in 2024, with another 1.5 GW under construction. Brazil's data center sector is forecast to triple by 2030. Saudi Arabia's Humain and the UAE's G42 collectively plan multi-gigawatt AI campuses. These markets offer first-mover positioning for hardware OEMs, hyperscale operators, and clean-energy developers

AI Model Serving Infrastructure

Inference workloads scale with users, not with model size, and they are far more latency-sensitive than training. The opportunity sits in AI model serving infrastructure designed for sub-100ms response: lower-power GPUs, sparsity-aware ASICs, and edge inference appliances. Margins on inference-optimized stacks are expected to exceed training margins by 2028

Sustainable AI Compute

Hyperscalers signed a record 30+ GW of clean-energy power purchase agreements in 2024 to cover AI loads [16]. Behind-the-meter solar, small modular reactors, and waste-heat recovery offer new business models. Microsoft's Three Mile Island deal and Amazon's Talen Energy nuclear PPA mark the shift from green marketing to operational necessity

AI Infrastructure Market Future Outlook

Agentic and Autonomous Operations

By 2030, a majority of AI compute will serve agentic workloads — long-running, tool-using agents rather than single-shot chat queries. This shifts infrastructure requirements toward persistent state, memory tiers measured in petabytes, and orchestration platforms able to schedule millions of concurrent agent sessions. Operators that crack agent economics will define the second half of the forecast window.

Platform Economics and Inference Marketplaces

Inference is becoming a commodity-like service priced per million tokens. Margins will compress at the hyperscaler API layer, pushing differentiation into the platform tier — model routing, fine-tuning pipelines, and retrieval-augmented generation services. Token volumes are projected to grow 50x by 2030 versus 2024, but unit prices may fall 80%, creating winners among operators with the best utilization.

Electrification Supercycle

The IEA forecasts global data center electricity demand reaching roughly 945 TWh by 2030, equivalent to current Japan-level consumption [9]. Behind-the-meter generation, dedicated nuclear PPAs, and grid-forming inverter coupling will become standard line items in AI campus design. Power procurement is now a strategic capability, not a procurement function.

ESG and Sustainability Disclosure

The EU's Corporate Sustainability Reporting Directive (CSRD) and California SB 253 require Scope 1–3 disclosure for large operators, including embodied carbon from accelerator manufacturing [18]. Expect AI infrastructure procurement RFPs to standardize on PUE, WUE, carbon intensity, and supplier-level disclosures by 2027. Operators without credible sustainability data will be filtered out of enterprise procurement panels.

AI Infrastructure Market Segmentation

By Component

Segment Metric Primary Demand Driver
Hardware USD 19.0 Billion (2025) GPU, accelerator, networking spend
Software 31% CAGR MLOps, orchestration, optimization
Services 12% share Integration, managed inference, advisory


Hardware anchors the market through accelerators, high-bandwidth memory, networking fabric, and storage. NVIDIA, AMD, and Intel collectively define the upstream silicon layer, while Arista, Broadcom, and Marvell define the networking layer. Software is the structurally faster grower because every dollar of hardware spent generates a multiple of orchestration, monitoring, and optimization software demand over the asset life.

By Deployment Model

Segment Metric Primary Demand Driver
Cloud 59% share Hyperscaler AI-as-a-service
On-Premise USD 7.0 Billion (2025) Regulated industries, sovereign workloads
Hybrid 29% CAGR Inference at edge, training in the cloud


Cloud deployment dominates because it transfers capex risk to hyperscalers and provides on-demand access to the latest accelerators. Hybrid models are the fastest-growing pattern because enterprises increasingly run training in cloud and inference on-premise or at the edge for latency and data sovereignty.

By Application

Segment Metric Primary Demand Driver
Natural Language Processing 33% share Foundation models, customer service
Computer Vision 28% CAGR Autonomous systems, medical imaging
Machine Learning Platforms USD 6.5 Billion (2025) Predictive analytics, fraud, risk
Predictive Analytics 12% share Operations, demand forecasting
Virtual Assistants USD 2.4 Billion (2025) Enterprise productivity copilots


By Target Industry

Segment Metric Primary Demand Driver
Healthcare 22% share Imaging, drug discovery, EHR analytics
Financial Services 30% CAGR Real-time fraud, algorithmic trading
Manufacturing USD 4.8 Billion (2025) Predictive maintenance, vision QC
Retail 14% share Personalization, demand forecasting
Transportation USD 2.9 Billion (2025) Autonomous fleet, route optimization


Regional Market Share Analysis

Region Metric Primary Investment Themes
North America 44% share Hyperscaler campuses, sovereign AI, accelerator fabs
Europe USD 9.0 Billion (2025) AI Act compliance, sovereign cloud, gigafactories
Asia-Pacific 32.5% CAGR China AI policy, IndiaAI Mission, Japan METI subsidies
South America 3% share Hyperscale entry, clean-energy adjacency
Middle East & Africa 26.8% CAGR Sovereign AI funds, UAE/Saudi campuses
Total USD 32.0 Billion (2025)


North America

Country Metric Key Driver
United States 92% of regional share Hyperscaler capex, CHIPS Act, Stargate
Canada USD 0.6 Billion (2025) Cold-climate efficiency, Quebec hydropower
Mexico 18% CAGR Nearshoring colocation demand


The United States operates as the gravity well of global AI infrastructure spend. The CHIPS and Science Act has triggered Intel Ohio, TSMC Arizona, and Samsung Taylor fab construction, while the Stargate initiative — a USD 500 billion four-year program announced in January 2025 — anchors forward demand visibility through 2029 [6]. Canada plays a niche but profitable role through hydropower-cooled campuses in Quebec and a stable regulatory regime favored by Canadian banks and U.S. enterprises seeking jurisdictional diversification.

Europe

Country Metric Key Driver
Germany 24% of regional share Industrial AI, automotive vision systems
United Kingdom USD 2.1 Billion (2025) Financial services AI, sovereign compute
France 26% CAGR AI Action Summit commitments, EDF nuclear edge
Netherlands 11% of regional share Amsterdam internet exchange, hyperscaler hub
Nordics USD 1.2 Billion (2025) Renewable power, low cooling cost


Europe's market is shaped less by raw capex and more by regulation and sovereignty. The EU AI Act entered force in August 2024 with phased obligations through 2027, creating compliance-driven demand for traceable, auditable AI infrastructure [14]. France's EUR 109 billion AI Action Summit announcement in February 2025, paired with EDF's nuclear-backed compute campuses, signals a credible bid for European AI sovereignty.

Asia-Pacific

Country Metric Key Driver
China 51% of regional share New Generation AI Plan, domestic accelerators
India 35% CAGR IndiaAI Mission, 10,000-GPU shared facility
Japan USD 1.4 Billion (2025) METI AI subsidies, Sakura Internet
South Korea USD 1.2 Billion (2025) K-Cloud, Samsung HBM leadership
Singapore 8% of regional share Regional hyperscale hub, green data center roadmap


Asia-Pacific is the structural growth story. China's domestic accelerator ecosystem — Huawei Ascend, Cambricon, Biren — is closing the performance gap under export-control pressure, while domestic hyperscale operators (Alibaba, Baidu, Tencent, ByteDance) absorb supply. India's IndiaAI Mission funded a 10,000+ GPU shared compute facility in March 2024 [7]. Japan's METI has subsidized AI compute build-outs through SoftBank, KDDI, and Sakura Internet.

South America

Country Metric Key Driver
Brazil 62% of regional share Hyperscale entry, BNDES financing
Chile USD 0.18 Billion (2025) Renewable-rich cooling, Santiago hub
Colombia 22% CAGR Bogotá colocation expansion


Brazil dominates the regional picture through São Paulo and Rio de Janeiro hyperscale campuses. AWS, Microsoft, and Google have all expanded local zones, and BNDES has channelled concessional financing into data center construction. Chile leverages cool Atacama-adjacent ambient temperatures and high renewable penetration as a low-cost AI hosting jurisdiction.

Middle East and Africa

Country Metric Key Driver
Saudi Arabia 38% of regional share Humain, PIF AI deployment
United Arab Emirates USD 0.45 Billion (2025) G42, MGX, Stargate UAE
South Africa 14% of regional share Cape Town and Johannesburg hubs
Egypt 24% CAGR National AI strategy, regional gateway


The Gulf is the region's defining force. Saudi Arabia's Humain, launched in May 2025 under PIF, is targeting multi-gigawatt AI capacity with U.S. accelerator partnerships [17]. The UAE's G42 and sovereign vehicle MGX co-invested in U.S. and domestic AI infrastructure across 2024–2025. Cheap power, capital availability, and policy speed give the region disproportionate weight versus its current share.

AI Infrastructure Market By Region, 2025-2035

Competitive Benchmarking

The ai infrastructure market is moderately concentrated. The top five vendors capture an estimated 55–65% of total value, and HHI lands in the 1,400–1,700 range — concentrated enough to draw antitrust attention in the U.S. and EU but not monopolistic. Differentiation runs along three axes: accelerator performance per watt, software ecosystem lock-in, and end-to-end stack integration.

Company Est. Revenue Share Range Key Offerings for AI Infrastructure Strategic Positioning
NVIDIA ~28–32% H100/B200, NVLink, CUDA, NIM Silicon and software platform leader
Microsoft ~9–12% Azure AI, ND-series VMs, Maia Hyperscaler with OpenAI alignment
Amazon (AWS) ~8–11% Trainium, Inferentia, EC2 P5/UltraClusters Custom silicon plus cloud scale
Alphabet (Google) ~7–10% TPU v5p, GCP AI Hypercomputer Vertical integration, Gemini stack
AMD ~4–6% MI300X, ROCm, Instinct accelerators Second-source GPU challenger
Intel ~3–5% Gaudi 3, Xeon, foundry roadmap Foundry-backed accelerator path
IBM ~2–4% watsonx, Granite models, on-prem AI Enterprise and regulated workloads
Oracle ~2–4% OCI Supercluster, GPU bare metal Sovereign and enterprise compute
SuperMicro ~2–3% GPU server systems, liquid-cooled racks OEM scale-out specialist
Alibaba / Baidu / Tencent ~5–8% combined Domestic accelerators, cloud AI China hyperscale anchor


Recent News & Developments

  • NVIDIA (March 2024): Launched the Blackwell B200 GPU and GB200 superchip platform, doubling training throughput versus H100 [3]
  • European Union (August 2024): EU AI Act entered force with phased compliance through 2027, creating regulated demand for auditable AI infrastructure [14]
  • U.S. Federal (January 2025): Stargate Project announced — a USD 500 billion four-year AI infrastructure program led by OpenAI, Oracle, SoftBank, and MGX [6]
  • Microsoft (January 2025): Confirmed USD 80 billion AI infrastructure capex commitment for fiscal 2025, with more than half in U.S. data centers [15]
  • AWS (December 2024): General availability of Trainium2 instances at re:Invent, with UltraServer configurations targeting trillion-parameter training [19]
  • Saudi Arabia (May 2025): Public Investment Fund launched Humain, a sovereign AI vehicle with multi-gigawatt campus targets [17]
  • India (March 2024): IndiaAI Mission approved at INR 10,372 crore (USD 1.25 billion), including a 10,000+ GPU shared compute facility [7]
  • Meta (October 2024): Committed up to USD 65 billion fiscal 2025 capex, citing AI infrastructure as the primary driver [1]

AI Infrastructure Market Report Scope

Parameter Detail
Market Scope Global ai infrastructure market covering hardware, software, and services
Study Period 2021–2035
Base Year 2025
Forecast Period 2026–2035
CAGR 27.12% (2026–2035)
Market Size 2025 USD 32.0 Billion
Market Size 2026 USD 40.7 Billion
Market Size 2035 USD 353.0 Billion
Fastest Growing Segments Software, Hybrid Deployment, Financial Services
Companies Profiled NVIDIA, Microsoft, AWS, Alphabet, AMD, Intel, IBM, Oracle, SuperMicro, Alibaba, Baidu, Tencent
Valuation Currency USD Billion


FAQs

How should an enterprise CIO evaluate AI accelerator procurement between NVIDIA, AMD, and custom hyperscaler silicon?
Procurement teams should benchmark across four dimensions rather than headline FLOPS. First, total cost of ownership per token served — not per accelerator — because inference economics dominate over a five-year asset life. Second, software portability: CUDA still carries lock-in, but ROCm and OpenAI's Triton are narrowing the gap, and major frameworks abstract away most kernel-level differences. Third, supply reliability under allocation regimes; AMD MI300X and Intel Gaudi 3 have shorter waitlists than B200 as of 2025. Fourth, integration depth with existing MLOps tooling. Most large enterprises are now running dual-vendor strategies with NVIDIA as the training default and an alternative for inference. Hyperscaler-custom silicon (Trainium, TPU, Maia) only makes sense for workloads tightly bound to a single cloud. The right answer is rarely sole-source [3][8].
What contractual protections should buyers negotiate for multi-year GPU capacity reservations?
Long-term capacity contracts have shifted from a buyer's market to a seller's market between 2023 and 2025. Negotiation leverage now sits with providers, but four protections remain achievable. Lock substitution rights — the right to upgrade to next-generation parts at agreed price points, not just take what is delivered. Insist on transparency on noisy-neighbor performance for multi-tenant inference. Build in audit rights for power and cooling configurations affecting effective performance. Negotiate exit ramps tied to provider service-level breaches rather than headline pricing. The single most overlooked clause is power-availability commitment: hyperscalers increasingly cannot guarantee energization timelines for new campuses, and contract language should reflect that risk [15][20].
How is the EU AI Act reshaping AI infrastructure procurement specifically?
The Act layers obligations onto the entire infrastructure stack, not just model developers. Operators must support traceability of training data lineage, model versioning, and inference logging for high-risk applications. This raises infrastructure requirements for immutable storage, audit-grade telemetry, and isolated compute enclaves. Foundation model providers face additional transparency obligations from August 2025, which cascade into infrastructure SLAs. Procurement teams should require AI Act conformity attestations from cloud providers and verify that contractual data residency commitments are technically enforceable, not just policy commitments. Non-EU operators serving EU customers face the same obligations; jurisdiction does not provide an escape route [14].
What is the realistic outlook for liquid cooling adoption in existing data center fleets?
Air cooling tops out around 40 kW per rack; Blackwell-class deployments require 100–130 kW. Greenfield campuses are designed liquid-ready from day one, but retrofit economics determine the pace of fleet conversion. Rear-door heat exchangers offer the lowest-cost retrofit path at roughly USD 15,000 per rack and can support up to 80 kW. Full direct-to-chip retrofits run USD 40,000–80,000 per rack and require coolant distribution unit installation. Immersion remains niche for the highest-density training pods. Industry surveys suggest liquid-cooled rack penetration will move from ~15% in 2025 to ~60% by 2032, with retrofit activity peaking around 2027–2029 [19].
Should mid-market enterprises build private AI clusters or commit to hyperscaler reserved capacity?
The break-even between build and rent has shifted decisively toward rent for any organization needing less than roughly 1,000 high-end GPUs sustained. Hyperscaler reserved instance pricing reflects scale advantages no enterprise can match for hardware procurement, power contracts, or facility utilization. The build case becomes credible only when data sovereignty, regulatory mandate, or proprietary workload economics override pure unit cost. Even then, colocation rather than greenfield build typically wins on time-to-deployment. A useful test: if the workload could tolerate a 10–14-day re-platform window between cloud regions, the build case is rarely strong enough to justify capex [8][20].
How are sovereign AI initiatives changing the competitive landscape for global vendors?
Sovereign AI funds are creating a parallel demand curve that bypasses traditional enterprise procurement. India, France, Saudi Arabia, the UAE, Singapore, and South Korea have each committed national-level capital to AI compute. For global vendors, this means three things: long-cycle public-sector sales motions that look more like defense contracting than cloud SaaS; technology transfer and local manufacturing commitments increasingly tied to access; and competition from domestic champions (Huawei Ascend, Sakura Internet, G42 Condor) that previously had no global presence. Sovereign demand also tends to favor end-to-end stack vendors over component suppliers, which advantages NVIDIA, Oracle, and hyperscalers with credible sovereign cloud offerings [7][17].
What integration challenges most often derail enterprise AI infrastructure deployments?
Three failure modes dominate post-deployment reviews. Data pipeline readiness lags hardware readiness; clusters sit idle waiting for cleaned training data, and effective utilization frequently runs below 50% in the first 12 months. Second, networking is consistently under-specified — GPU clusters require non-blocking fat-tree topologies and high-bandwidth east-west traffic that legacy enterprise networks cannot support without dedicated AI fabric overlays. Third, MLOps tooling integration is treated as a follow-on rather than a precondition; the result is shadow pipelines, model drift, and audit failures. The pattern is consistent: organizations that invest in data engineering and MLOps maturity ahead of accelerator procurement achieve two to three times the utilization of those that bolt them on afterward [4][8].
Author
Author
Author Profile
Ankit Gupta LinkedIn
Team Lead - Research
Ankit Gupta is a seasoned market intelligence and strategic research professional with over six plus years of experience in the ICT and Semiconductor industries. With academic roots in Telecom, Marketing, and Electronics, he blends technical insight with business strategy. Ankit has led 200+ projects, including work for Fortune 500 clients like Microsoft and Rio Tinto, covering market sizing, tech forecasting, and go-to-market strategies. Known for bridging engineering and enterprise decision-making, his insights support growth, innovation, and investment planning across diverse technology markets.

Research Approach


Secondary Research

The secondary research process involved comprehensive analysis of regulatory databases, technical standards publications, peer-reviewed computing journals, semiconductor industry reports, and authoritative technology organizations. Key sources included the National Institute of Standards and Technology (NIST), European Union Agency for Cybersecurity (ENISA), U.S. Department of Energy (DOE) Office of Science, National Science Foundation (NSF) Computer and Information Science and Engineering (CISE) Directorate, Semiconductor Industry Association (SIA), European Commission Digital Strategy & EuroHPC Joint Undertaking, International Data Corporation (IDC), IEEE Xplore Digital Library, Association for Computing Machinery (ACM) Digital Library, U.S. Bureau of Economic Analysis (BEA) Technology Sector Reports, Organization for Economic Co-operation and Development (OECD) AI Policy Observatory, International Telecommunication Union (ITU) AI Standardization Reports, and national digital transformation strategies from key markets including China's Ministry of Science and Technology AI Development Plan and India's Ministry of Electronics and Information Technology (MeitY) AI initiatives. These sources were used to collect data center capacity statistics, AI chip production metrics, cloud infrastructure deployment data, high-performance computing (HPC) adoption trends, regulatory frameworks for AI governance, energy consumption standards, and competitive landscape analysis for GPU/TPU accelerators, AI servers, storage systems, networking equipment, and AI software platforms.


Primary Research

Qualitative and quantitative insights were obtained by interviewing supply-side and demand-side stakeholders during the primary research process. CEOs, CTOs, VPs of AI Infrastructure, data center operations leaders, and product leads from semiconductor manufacturers, cloud service providers, AI hardware OEMs, and enterprise software vendors comprised supply-side sources. The demand-side sources included chief data officers, AI/ML directors, IT infrastructure architects, procurement leaders from Fortune 500 enterprises, and digital transformation heads from healthcare systems, financial institutions, manufacturing conglomerates, and retail chains. The primary research garnered insights on hyperscaler deployment patterns, pricing strategies for compute instances, and enterprise adoption barriers, as well as confirmed AI chip roadmap timelines and validated market segmentation.

Primary Respondent Breakdown:

By Designation: C-level Primaries (32%), Director Level (31%), Others (37%)

By Region: North America (38%), Europe (25%), Asia-Pacific (32%), Rest of World (5%)


Market Size Estimation

Global market valuation was derived through revenue mapping and infrastructure capacity analysis. The methodology included:

Identification of 50+ key manufacturers across North America, Europe, Asia-Pacific, and Latin America

Product mapping across AI hardware (GPUs, TPUs, ASICs, CPUs, networking equipment, storage), AI software (development platforms, MLOps, inference engines), and professional services (consulting, integration, managed services)

Analysis of reported and modeled annual revenues specific to AI infrastructure portfolios

Coverage of manufacturers representing 75-80% of global market share in 2024

Extrapolation using bottom-up (compute instance volume × pricing by deployment model and region) and top-down (vendor revenue validation across chipmakers, server OEMs, and cloud hyperscalers) approaches to derive segment-specific valuations

Download Free Sample

Kindly complete the form below to receive a free sample of this Report

Download PDF ×

We do not share your information with anyone. However, we may send you emails based on your report interest from time to time. You may contact us at any time to opt-out.
















