Segmentation Quick Reference
| Dimension | Sub-Segments | Dominant Segment | Fastest Growing Segment |
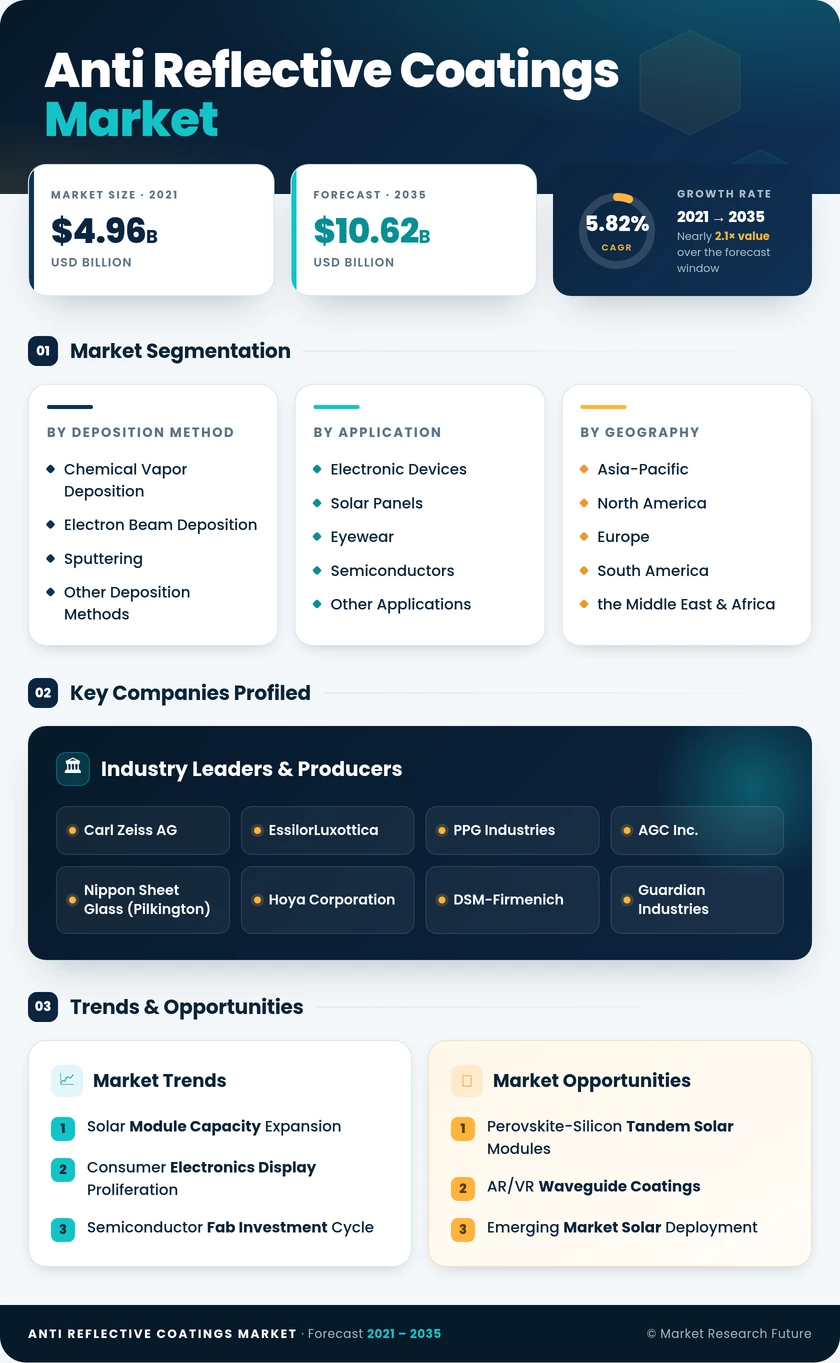
| By Deposition Method | Chemical Vapor Deposition, Electron Beam Deposition, Sputtering, Other Deposition Methods | Chemical Vapor Deposition | Sputtering |
| By Application | Electronic Devices, Solar Panels, Eyewear, Semiconductors, Other Applications | Electronic Devices | Solar Panels |
| By Geography | Asia-Pacific, North America, Europe, South America, the Middle East & Africa | Asia-Pacific | Asia-Pacific |
Market Segmentation Overview
By Deposition Method
| Sub-Segment | Key Trend |
| Chemical Vapor Deposition | Plasma-enhanced variants expanding into semiconductor EUV optics and CMOS image sensors |
| Electron Beam Deposition | Preferred for defense-grade multilayer stacks requiring extreme spectral precision |
| Sputtering | Inline magnetron systems dominate large-area solar and display glass coating. |
| Other Deposition Methods | Sol-gel and dip-coat processes remain cost-competitive for commodity eyewear. |
Chemical vapor deposition leads by revenue share due to its critical role in semiconductor fabrication, where conformal coating of complex 3D geometries is non-negotiable. Sputtering, however, is closing the gap as solar and display panel manufacturers invest in high-throughput inline systems that coat substrates exceeding 3 meters in width.
By Application
| Sub-Segment | Key Trend |
| Electronic Devices | Multi-layer anti-reflective stacks are becoming standard on foldable OLED and automotive displays. |
| Solar Panels | Bifacial and tandem architectures doubling or tripling the coating area per module. |
| Eyewear | Premium blue-light-filtering anti-reflective lenses are gaining consumer traction. |
| Semiconductors | EUV lithography and advanced packaging are driving demand for angstrom-level coating precision |
| Other Applications | Medical endoscope optics, architectural smart glass, and defense targeting systems |
Electronic devices hold the largest application share, propelled by the relentless expansion of smartphone, tablet, and automotive display production. Solar panels represent the fastest-growing application, as global PV installation targets and the structural shift toward bifacial modules create compounding demand for coating materials and services.
By Geography
| Sub-Segment | Key Trend |
| Asia-Pacific | China's solar module dominance and South Korea's OLED ecosystem anchor regional leadership |
| North America | CHIPS Act fab investments and defense procurement sustain premium coating demand |
| Europe | Automotive HUD integration and PFAS regulatory compliance reshape the coating supply chain. |
| South America | Brazil's distributed solar boom creates greenfield coating market opportunities. |
| Middle East & Africa | Vision 2030 mega-projects and concentrated solar power installations drive specialty demand. |
Asia-Pacific commands the largest regional share and grows fastest, supported by China's unmatched solar manufacturing scale and South Korea's advanced display fabrication infrastructure. North America and Europe compete for leadership in high-specification semiconductor and defense optics coatings, where value per coated surface area is significantly higher than in commodity glass applications.