Request Free Sample ×

Kindly complete the form below to receive a free sample of this Report

* Please use a valid business email

Leading companies partner with us for data-driven Insights

clients tt-cursor
Hero Background

APAC Li Ion Battery Recycling Market

ID: MRFR/EnP/52539-HCR
200 Pages
Snehal Singh
Last Updated: March 31, 2026
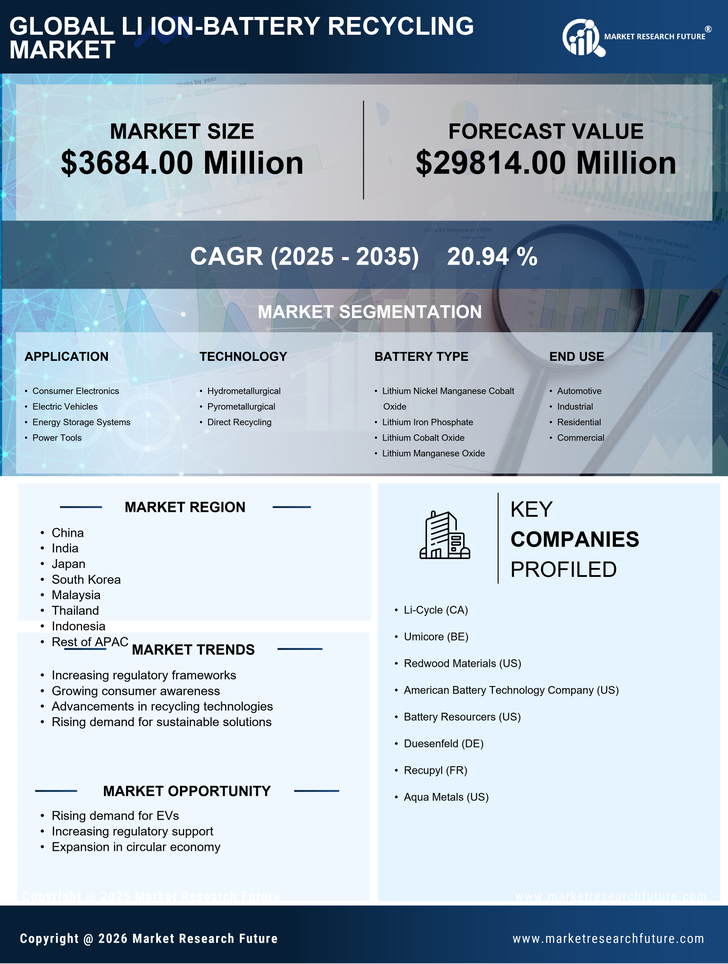
APAC Li-ion Battery Recycling Market Research Report By Application (Consumer Electronics, Electric Vehicles, Energy Storage Systems, Power Tools), By Technology (Hydrometallurgical, Pyrometallurgical, Direct Recycling), By Battery Type (Lithium Nickel Manganese Cobalt Oxide, Lithium Iron Phosphate, Lithium Cobalt Oxide, Lithium Manganese Oxide), By End Use (Automotive, Industrial, Residential, Commercial) and By Regional (China, India, Japan, South Korea, Malaysia, Thailand, Indonesia, Rest of APAC) - Forecast to 2035
Download PDF ×

We do not share your information with anyone. However, we may send you emails based on your report interest from time to time. You may contact us at any time to opt-out.

  1. 1 SECTION I: EXECUTIVE SUMMARY AND KEY HIGHLIGHTS
    1. 1.1 EXECUTIVE SUMMARY
      1. 1.1.1 Market Overview
      2. 1.1.2 Key Findings
      3. 1.1.3 Market Segmentation
      4. 1.1.4 Competitive Landscape
      5. 1.1.5 Challenges and Opportunities
      6. 1.1.6 Future Outlook
  2. 2 SECTION II: SCOPING, METHODOLOGY AND MARKET STRUCTURE
    1. 2.1 MARKET INTRODUCTION
      1. 2.1.1 Definition
      2. 2.1.2 Scope of the study
        1. 2.1.2.1 Research Objective
        2. 2.1.2.2 Assumption
        3. 2.1.2.3 Limitations
    2. 2.2 RESEARCH METHODOLOGY
      1. 2.2.1 Overview
      2. 2.2.2 Data Mining
      3. 2.2.3 Secondary Research
      4. 2.2.4 Primary Research
        1. 2.2.4.1 Primary Interviews and Information Gathering Process
        2. 2.2.4.2 Breakdown of Primary Respondents
      5. 2.2.5 Forecasting Model
      6. 2.2.6 Market Size Estimation
        1. 2.2.6.1 Bottom-Up Approach
        2. 2.2.6.2 Top-Down Approach
      7. 2.2.7 Data Triangulation
      8. 2.2.8 Validation
  3. 3 SECTION III: QUALITATIVE ANALYSIS
    1. 3.1 MARKET DYNAMICS
      1. 3.1.1 Overview
      2. 3.1.2 Drivers
      3. 3.1.3 Restraints
      4. 3.1.4 Opportunities
    2. 3.2 MARKET FACTOR ANALYSIS
      1. 3.2.1 Value chain Analysis
      2. 3.2.2 Porter's Five Forces Analysis
        1. 3.2.2.1 Bargaining Power of Suppliers
        2. 3.2.2.2 Bargaining Power of Buyers
        3. 3.2.2.3 Threat of New Entrants
        4. 3.2.2.4 Threat of Substitutes
        5. 3.2.2.5 Intensity of Rivalry
      3. 3.2.3 COVID-19 Impact Analysis
        1. 3.2.3.1 Market Impact Analysis
        2. 3.2.3.2 Regional Impact
        3. 3.2.3.3 Opportunity and Threat Analysis
  4. 4 SECTION IV: QUANTITATIVE ANALYSIS
    1. 4.1 Energy & Power, BY Application (USD Billion)
      1. 4.1.1 Consumer Electronics
      2. 4.1.2 Electric Vehicles
      3. 4.1.3 Energy Storage Systems
      4. 4.1.4 Industrial Applications
    2. 4.2 Energy & Power, BY End Use (USD Billion)
      1. 4.2.1 Automotive
      2. 4.2.2 Electronics
      3. 4.2.3 Renewable Energy
      4. 4.2.4 Telecommunications
    3. 4.3 Energy & Power, BY Recycling Process (USD Billion)
      1. 4.3.1 Hydrometallurgical
      2. 4.3.2 Pyrometallurgical
      3. 4.3.3 Direct Recycling
      4. 4.3.4 Mechanical Recycling
    4. 4.4 Energy & Power, BY Battery Type (USD Billion)
      1. 4.4.1 Lithium Nickel Manganese Cobalt Oxide
      2. 4.4.2 Lithium Iron Phosphate
      3. 4.4.3 Lithium Cobalt Oxide
      4. 4.4.4 Lithium Manganese Oxide
    5. 4.5 Energy & Power, BY Collection Method (USD Billion)
      1. 4.5.1 Drop-off Centers
      2. 4.5.2 Mobile Collection Units
      3. 4.5.3 Retail Collection Programs
      4. 4.5.4 Partnerships with Manufacturers
  5. 5 SECTION V: COMPETITIVE ANALYSIS
    1. 5.1 Competitive Landscape
      1. 5.1.1 Overview
      2. 5.1.2 Competitive Analysis
      3. 5.1.3 Market share Analysis
      4. 5.1.4 Major Growth Strategy in the Energy & Power
      5. 5.1.5 Competitive Benchmarking
      6. 5.1.6 Leading Players in Terms of Number of Developments in the Energy & Power
      7. 5.1.7 Key developments and growth strategies
        1. 5.1.7.1 New Product Launch/Service Deployment
        2. 5.1.7.2 Merger & Acquisitions
        3. 5.1.7.3 Joint Ventures
      8. 5.1.8 Major Players Financial Matrix
        1. 5.1.8.1 Sales and Operating Income
        2. 5.1.8.2 Major Players R&D Expenditure. 2023
    2. 5.2 Company Profiles
      1. 5.2.1 Umicore (BE)
        1. 5.2.1.1 Financial Overview
        2. 5.2.1.2 Products Offered
        3. 5.2.1.3 Key Developments
        4. 5.2.1.4 SWOT Analysis
        5. 5.2.1.5 Key Strategies
      2. 5.2.2 Li-Cycle (CA)
        1. 5.2.2.1 Financial Overview
        2. 5.2.2.2 Products Offered
        3. 5.2.2.3 Key Developments
        4. 5.2.2.4 SWOT Analysis
        5. 5.2.2.5 Key Strategies
      3. 5.2.3 SungEel HiTech (KR)
        1. 5.2.3.1 Financial Overview
        2. 5.2.3.2 Products Offered
        3. 5.2.3.3 Key Developments
        4. 5.2.3.4 SWOT Analysis
        5. 5.2.3.5 Key Strategies
      4. 5.2.4 Dowa Holdings (JP)
        1. 5.2.4.1 Financial Overview
        2. 5.2.4.2 Products Offered
        3. 5.2.4.3 Key Developments
        4. 5.2.4.4 SWOT Analysis
        5. 5.2.4.5 Key Strategies
      5. 5.2.5 Recupyl (FR)
        1. 5.2.5.1 Financial Overview
        2. 5.2.5.2 Products Offered
        3. 5.2.5.3 Key Developments
        4. 5.2.5.4 SWOT Analysis
        5. 5.2.5.5 Key Strategies
      6. 5.2.6 Aqua Metals (US)
        1. 5.2.6.1 Financial Overview
        2. 5.2.6.2 Products Offered
        3. 5.2.6.3 Key Developments
        4. 5.2.6.4 SWOT Analysis
        5. 5.2.6.5 Key Strategies
      7. 5.2.7 Fortum (FI)
        1. 5.2.7.1 Financial Overview
        2. 5.2.7.2 Products Offered
        3. 5.2.7.3 Key Developments
        4. 5.2.7.4 SWOT Analysis
        5. 5.2.7.5 Key Strategies
      8. 5.2.8 Nippon Steel (JP)
        1. 5.2.8.1 Financial Overview
        2. 5.2.8.2 Products Offered
        3. 5.2.8.3 Key Developments
        4. 5.2.8.4 SWOT Analysis
        5. 5.2.8.5 Key Strategies
      9. 5.2.9 Tianjin Bamo Technology (CN)
        1. 5.2.9.1 Financial Overview
        2. 5.2.9.2 Products Offered
        3. 5.2.9.3 Key Developments
        4. 5.2.9.4 SWOT Analysis
        5. 5.2.9.5 Key Strategies
    3. 5.3 Appendix
      1. 5.3.1 References
      2. 5.3.2 Related Reports
  6. 6 LIST OF FIGURES
    1. 6.1 MARKET SYNOPSIS
    2. 6.2 APAC MARKET ANALYSIS BY APPLICATION
    3. 6.3 APAC MARKET ANALYSIS BY END USE
    4. 6.4 APAC MARKET ANALYSIS BY RECYCLING PROCESS
    5. 6.5 APAC MARKET ANALYSIS BY BATTERY TYPE
    6. 6.6 APAC MARKET ANALYSIS BY COLLECTION METHOD
    7. 6.7 KEY BUYING CRITERIA OF ENERGY & POWER
    8. 6.8 RESEARCH PROCESS OF MRFR
    9. 6.9 DRO ANALYSIS OF ENERGY & POWER
    10. 6.10 DRIVERS IMPACT ANALYSIS: ENERGY & POWER
    11. 6.11 RESTRAINTS IMPACT ANALYSIS: ENERGY & POWER
    12. 6.12 SUPPLY / VALUE CHAIN: ENERGY & POWER
    13. 6.13 ENERGY & POWER, BY APPLICATION, 2024 (% SHARE)
    14. 6.14 ENERGY & POWER, BY APPLICATION, 2024 TO 2035 (USD Billion)
    15. 6.15 ENERGY & POWER, BY END USE, 2024 (% SHARE)
    16. 6.16 ENERGY & POWER, BY END USE, 2024 TO 2035 (USD Billion)
    17. 6.17 ENERGY & POWER, BY RECYCLING PROCESS, 2024 (% SHARE)
    18. 6.18 ENERGY & POWER, BY RECYCLING PROCESS, 2024 TO 2035 (USD Billion)
    19. 6.19 ENERGY & POWER, BY BATTERY TYPE, 2024 (% SHARE)
    20. 6.20 ENERGY & POWER, BY BATTERY TYPE, 2024 TO 2035 (USD Billion)
    21. 6.21 ENERGY & POWER, BY COLLECTION METHOD, 2024 (% SHARE)
    22. 6.22 ENERGY & POWER, BY COLLECTION METHOD, 2024 TO 2035 (USD Billion)
    23. 6.23 BENCHMARKING OF MAJOR COMPETITORS
  7. 7 LIST OF TABLES
    1. 7.1 LIST OF ASSUMPTIONS
  8. 7.1.1
    1. 7.2 APAC MARKET SIZE ESTIMATES; FORECAST
      1. 7.2.1 BY APPLICATION, 2026-2035 (USD Billion)
      2. 7.2.2 BY END USE, 2026-2035 (USD Billion)
      3. 7.2.3 BY RECYCLING PROCESS, 2026-2035 (USD Billion)
      4. 7.2.4 BY BATTERY TYPE, 2026-2035 (USD Billion)
      5. 7.2.5 BY COLLECTION METHOD, 2026-2035 (USD Billion)
    2. 7.3 PRODUCT LAUNCH/PRODUCT DEVELOPMENT/APPROVAL
  9. 7.3.1
    1. 7.4 ACQUISITION/PARTNERSHIP
  10. 7.4.1

APAC Energy & Power Market Segmentation

Energy & Power By Application (USD Billion, 2022-2035)

  • Consumer Electronics
  • Electric Vehicles
  • Energy Storage Systems
  • Industrial Applications

Energy & Power By End Use (USD Billion, 2022-2035)

  • Automotive
  • Electronics
  • Renewable Energy
  • Telecommunications

Energy & Power By Recycling Process (USD Billion, 2022-2035)

  • Hydrometallurgical
  • Pyrometallurgical
  • Direct Recycling
  • Mechanical Recycling

Energy & Power By Battery Type (USD Billion, 2022-2035)

  • Lithium Nickel Manganese Cobalt Oxide
  • Lithium Iron Phosphate
  • Lithium Cobalt Oxide
  • Lithium Manganese Oxide

Energy & Power By Collection Method (USD Billion, 2022-2035)

  • Drop-off Centers
  • Mobile Collection Units
  • Retail Collection Programs
  • Partnerships with Manufacturers