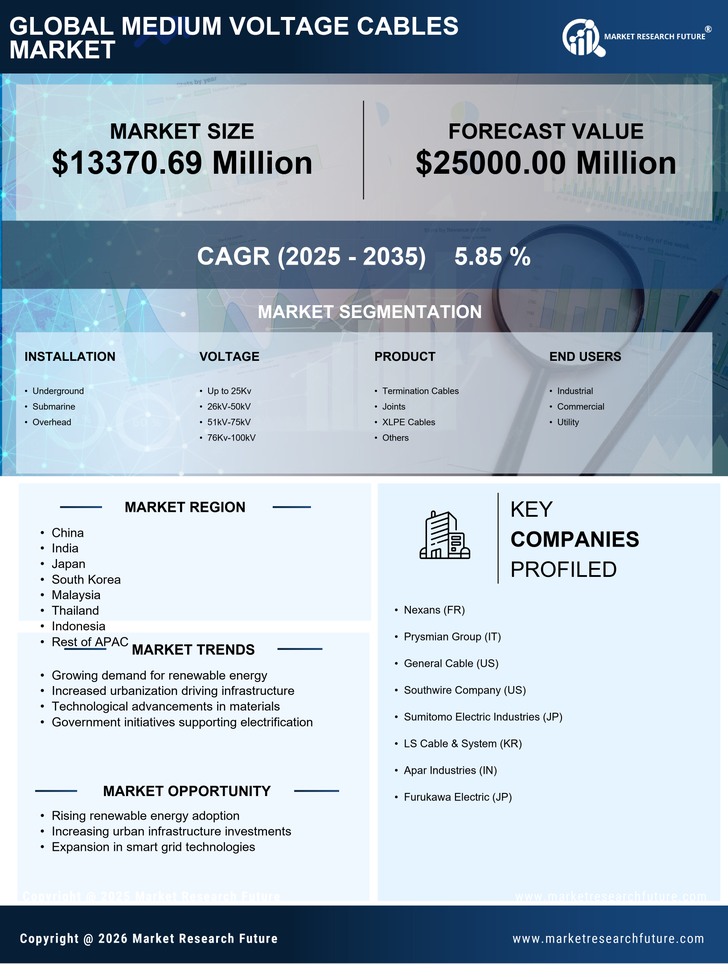
Request Free Sample ×

Kindly complete the form below to receive a free sample of this Report

* Please use a valid business email

Leading companies partner with us for data-driven Insights

clients tt-cursor
Hero Background

APAC Medium Voltage Cables Market

ID: MRFR/EnP/53667-HCR
200 Pages
Chitranshi Jaiswal
Last Updated: February 06, 2026
APAC Medium Voltage Cables Market Research Report By Installation (Underground, Submarine, Overhead), By Voltage (Up to 25Kv, 26kV-50kV, 51kV-75kV, 76Kv-100kV), By Product (Termination Cables, Joints, XLPE Cables, Others), By End-User (Industrial, Commercial, Utility) and By Regional (China, India, Japan, South Korea, Malaysia, Thailand, Indonesia, Rest of APAC)- Forecast to 2035
Download PDF ×

We do not share your information with anyone. However, we may send you emails based on your report interest from time to time. You may contact us at any time to opt-out.

  1. 1 SECTION I: EXECUTIVE SUMMARY AND KEY HIGHLIGHTS
    1. 1.1 EXECUTIVE SUMMARY
      1. 1.1.1 Market Overview
      2. 1.1.2 Key Findings
      3. 1.1.3 Market Segmentation
      4. 1.1.4 Competitive Landscape
      5. 1.1.5 Challenges and Opportunities
      6. 1.1.6 Future Outlook
  2. 2 SECTION II: SCOPING, METHODOLOGY AND MARKET STRUCTURE
    1. 2.1 MARKET INTRODUCTION
      1. 2.1.1 Definition
      2. 2.1.2 Scope of the study
        1. 2.1.2.1 Research Objective
        2. 2.1.2.2 Assumption
        3. 2.1.2.3 Limitations
    2. 2.2 RESEARCH METHODOLOGY
      1. 2.2.1 Overview
      2. 2.2.2 Data Mining
      3. 2.2.3 Secondary Research
      4. 2.2.4 Primary Research
        1. 2.2.4.1 Primary Interviews and Information Gathering Process
        2. 2.2.4.2 Breakdown of Primary Respondents
      5. 2.2.5 Forecasting Model
      6. 2.2.6 Market Size Estimation
        1. 2.2.6.1 Bottom-Up Approach
        2. 2.2.6.2 Top-Down Approach
      7. 2.2.7 Data Triangulation
      8. 2.2.8 Validation
  3. 3 SECTION III: QUALITATIVE ANALYSIS
    1. 3.1 MARKET DYNAMICS
      1. 3.1.1 Overview
      2. 3.1.2 Drivers
      3. 3.1.3 Restraints
      4. 3.1.4 Opportunities
    2. 3.2 MARKET FACTOR ANALYSIS
      1. 3.2.1 Value chain Analysis
      2. 3.2.2 Porter's Five Forces Analysis
        1. 3.2.2.1 Bargaining Power of Suppliers
        2. 3.2.2.2 Bargaining Power of Buyers
        3. 3.2.2.3 Threat of New Entrants
        4. 3.2.2.4 Threat of Substitutes
        5. 3.2.2.5 Intensity of Rivalry
      3. 3.2.3 COVID-19 Impact Analysis
        1. 3.2.3.1 Market Impact Analysis
        2. 3.2.3.2 Regional Impact
        3. 3.2.3.3 Opportunity and Threat Analysis
  4. 4 SECTION IV: QUANTITATIVE ANALYSIS
    1. 4.1 Pharmaceutical, BY Installation (USD Million)
      1. 4.1.1 Underground
      2. 4.1.2 Submarine
      3. 4.1.3 Overhead
    2. 4.2 Pharmaceutical, BY Voltage (USD Million)
      1. 4.2.1 Up to 25Kv
      2. 4.2.2 26kV-50kV
      3. 4.2.3 51kV-75kV
      4. 4.2.4 76Kv-100kV
    3. 4.3 Pharmaceutical, BY Product (USD Million)
      1. 4.3.1 Termination Cables
      2. 4.3.2 Joints
      3. 4.3.3 XLPE Cables
      4. 4.3.4 Others
    4. 4.4 Pharmaceutical, BY End Users (USD Million)
      1. 4.4.1 Industrial
      2. 4.4.2 Commercial
      3. 4.4.3 Utility
  5. 5 SECTION V: COMPETITIVE ANALYSIS
    1. 5.1 Competitive Landscape
      1. 5.1.1 Overview
      2. 5.1.2 Competitive Analysis
      3. 5.1.3 Market share Analysis
      4. 5.1.4 Major Growth Strategy in the Pharmaceutical
      5. 5.1.5 Competitive Benchmarking
      6. 5.1.6 Leading Players in Terms of Number of Developments in the Pharmaceutical
      7. 5.1.7 Key developments and growth strategies
        1. 5.1.7.1 New Product Launch/Service Deployment
        2. 5.1.7.2 Merger & Acquisitions
        3. 5.1.7.3 Joint Ventures
      8. 5.1.8 Major Players Financial Matrix
        1. 5.1.8.1 Sales and Operating Income
        2. 5.1.8.2 Major Players R&D Expenditure. 2023
    2. 5.2 Company Profiles
      1. 5.2.1 Nexans (FR)
        1. 5.2.1.1 Financial Overview
        2. 5.2.1.2 Products Offered
        3. 5.2.1.3 Key Developments
        4. 5.2.1.4 SWOT Analysis
        5. 5.2.1.5 Key Strategies
      2. 5.2.2 Prysmian Group (IT)
        1. 5.2.2.1 Financial Overview
        2. 5.2.2.2 Products Offered
        3. 5.2.2.3 Key Developments
        4. 5.2.2.4 SWOT Analysis
        5. 5.2.2.5 Key Strategies
      3. 5.2.3 General Cable (US)
        1. 5.2.3.1 Financial Overview
        2. 5.2.3.2 Products Offered
        3. 5.2.3.3 Key Developments
        4. 5.2.3.4 SWOT Analysis
        5. 5.2.3.5 Key Strategies
      4. 5.2.4 Southwire Company (US)
        1. 5.2.4.1 Financial Overview
        2. 5.2.4.2 Products Offered
        3. 5.2.4.3 Key Developments
        4. 5.2.4.4 SWOT Analysis
        5. 5.2.4.5 Key Strategies
      5. 5.2.5 Sumitomo Electric Industries (JP)
        1. 5.2.5.1 Financial Overview
        2. 5.2.5.2 Products Offered
        3. 5.2.5.3 Key Developments
        4. 5.2.5.4 SWOT Analysis
        5. 5.2.5.5 Key Strategies
      6. 5.2.6 LS Cable & System (KR)
        1. 5.2.6.1 Financial Overview
        2. 5.2.6.2 Products Offered
        3. 5.2.6.3 Key Developments
        4. 5.2.6.4 SWOT Analysis
        5. 5.2.6.5 Key Strategies
      7. 5.2.7 Apar Industries (IN)
        1. 5.2.7.1 Financial Overview
        2. 5.2.7.2 Products Offered
        3. 5.2.7.3 Key Developments
        4. 5.2.7.4 SWOT Analysis
        5. 5.2.7.5 Key Strategies
      8. 5.2.8 Furukawa Electric (JP)
        1. 5.2.8.1 Financial Overview
        2. 5.2.8.2 Products Offered
        3. 5.2.8.3 Key Developments
        4. 5.2.8.4 SWOT Analysis
        5. 5.2.8.5 Key Strategies
    3. 5.3 Appendix
      1. 5.3.1 References
      2. 5.3.2 Related Reports
  6. 6 LIST OF FIGURES
    1. 6.1 MARKET SYNOPSIS
    2. 6.2 APAC MARKET ANALYSIS BY INSTALLATION
    3. 6.3 APAC MARKET ANALYSIS BY VOLTAGE
    4. 6.4 APAC MARKET ANALYSIS BY PRODUCT
    5. 6.5 APAC MARKET ANALYSIS BY END USERS
    6. 6.6 KEY BUYING CRITERIA OF PHARMACEUTICAL
    7. 6.7 RESEARCH PROCESS OF MRFR
    8. 6.8 DRO ANALYSIS OF PHARMACEUTICAL
    9. 6.9 DRIVERS IMPACT ANALYSIS: PHARMACEUTICAL
    10. 6.10 RESTRAINTS IMPACT ANALYSIS: PHARMACEUTICAL
    11. 6.11 SUPPLY / VALUE CHAIN: PHARMACEUTICAL
    12. 6.12 PHARMACEUTICAL, BY INSTALLATION, 2024 (% SHARE)
    13. 6.13 PHARMACEUTICAL, BY INSTALLATION, 2024 TO 2035 (USD Million)
    14. 6.14 PHARMACEUTICAL, BY VOLTAGE, 2024 (% SHARE)
    15. 6.15 PHARMACEUTICAL, BY VOLTAGE, 2024 TO 2035 (USD Million)
    16. 6.16 PHARMACEUTICAL, BY PRODUCT, 2024 (% SHARE)
    17. 6.17 PHARMACEUTICAL, BY PRODUCT, 2024 TO 2035 (USD Million)
    18. 6.18 PHARMACEUTICAL, BY END USERS, 2024 (% SHARE)
    19. 6.19 PHARMACEUTICAL, BY END USERS, 2024 TO 2035 (USD Million)
    20. 6.20 BENCHMARKING OF MAJOR COMPETITORS
  7. 7 LIST OF TABLES
    1. 7.1 LIST OF ASSUMPTIONS
  8. 7.1.1
    1. 7.2 APAC MARKET SIZE ESTIMATES; FORECAST
      1. 7.2.1 BY INSTALLATION, 2025-2035 (USD Million)
      2. 7.2.2 BY VOLTAGE, 2025-2035 (USD Million)
      3. 7.2.3 BY PRODUCT, 2025-2035 (USD Million)
      4. 7.2.4 BY END USERS, 2025-2035 (USD Million)
    2. 7.3 PRODUCT LAUNCH/PRODUCT DEVELOPMENT/APPROVAL
  9. 7.3.1
    1. 7.4 ACQUISITION/PARTNERSHIP
  10. 7.4.1

APAC Pharmaceutical Market Segmentation

Pharmaceutical By Installation (USD Million, 2025-2035)

  • Underground
  • Submarine
  • Overhead

Pharmaceutical By Voltage (USD Million, 2025-2035)

  • Up to 25Kv
  • 26kV-50kV
  • 51kV-75kV
  • 76Kv-100kV

Pharmaceutical By Product (USD Million, 2025-2035)

  • Termination Cables
  • Joints
  • XLPE Cables
  • Others

Pharmaceutical By End Users (USD Million, 2025-2035)

  • Industrial
  • Commercial
  • Utility