API Management Market (2025 - 2035)

ID: MRFR/ICT/1796-HCR
100 Pages
Apoorva Priyadarshi
Last Updated: July 08, 2026
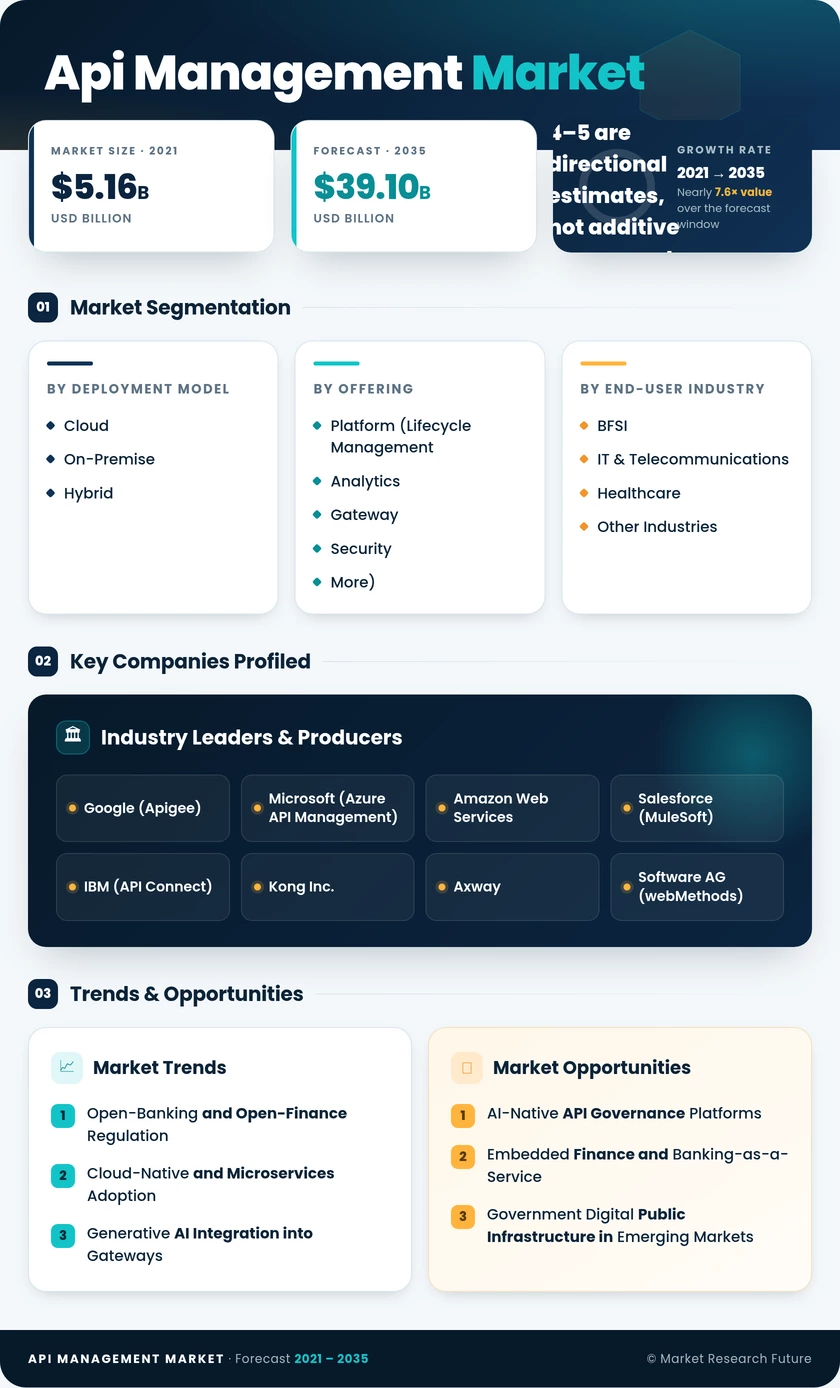
API Management Market Size, Share and Research Report By Deployment Model (Cloud, On-Premise, Hybrid), By Offering (Platform (API Lifecycle Management, Analytics & Monitoring, Gateway, Security, and More), Services), By End-User Industry (BFSI, IT and Telecommunications, Healthcare, Other Industries), By Enterprise Size (Large Enterprises, Small and Medium-Sized Enterprises) and By Regional (North America, Europe, South America, Asia Pacific, Middle East and Africa) - Industry Forecast to 2035.
API Management Market
Market Size
Forecast Period2025-2035
CAGR (2025-2035)15.2%
2025 Market SizeUSD 9.50 Billion
2035 Market SizeUSD 39.10 Billion
Key Players
Google
Microsoft
Amazon Web Services
Salesforce
IBM
Kong Inc.
Opportunities
  • AI-Native API Governance Platforms
  • Embedded Finance and Banking-as-a-Service
  • Government Digital Public Infrastructure in Emerging Markets
  1. 1 Market Overview |
    1. 1.1 Study Assumptions & Market Definition |
    2. 1.2 Scope of the Study |
    3. 1.3 Research Methodology
  2. 2 Market Summary & Key Takeaways
  3. 3 Market Dynamics |
    1. 3.1 Market Drivers Analysis | |
      1. 3.1.1 Open-Banking and Open-Finance Regulation | |
      2. 3.1.2 Cloud-Native and Microservices Adoption | |
      3. 3.1.3 Generative AI Integration into Gateways | |
      4. 3.1.4 5G-Driven Telecom API Commercialization | |
      5. 3.1.5 Healthcare Interoperability Mandates | |
      6. 3.1.6 Government Digital Public Infrastructure | |
      7. 3.1.7 Embedded Finance and BaaS Proliferation |
    2. 3.2 Market Restraints Analysis | |
      1. 3.2.1 Data-Sovereignty and Cross-Border Compliance Complexity | |
      2. 3.2.2 Integration Complexity in Legacy-Heavy Enterprises | |
      3. 3.2.3 Vendor Lock-In and Portability Concerns | |
      4. 3.2.4 Cybersecurity Attack Surface Expansion | |
      5. 3.2.5 Skills Shortage in API Architecture Roles |
    3. 3.3 Market Opportunity Analysis | |
      1. 3.3.1 AI-Native API Governance Platforms | |
      2. 3.3.2 Embedded Finance and Banking-as-a-Service | |
      3. 3.3.3 Government Digital Public Infrastructure in Emerging Markets | |
      4. 3.3.4 API Monetization as a Revenue Channel | |
      5. 3.3.5 Edge-Native API Management |
    4. 3.4 Industry Value Chain Analysis |
    5. 3.5 Porter's Five Forces Analysis
  4. 4 Global API Management Market Size & Forecast (2021–2035) |
    1. 4.1 Historical Market Size (2021–2025) |
    2. 4.2 Current & Forecast Market Size (2026–2035) |
    3. 4.3 Market Size by Revenue (USD Billion) |
    4. 4.4 Year-over-Year Growth Analysis
  5. 5 Segmentation Analysis |
    1. 5.1 By Deployment Model | |
      1. 5.1.1 Cloud | |
      2. 5.1.2 On-Premise | |
      3. 5.1.3 Hybrid |
    2. 5.2 By Offering | |
      1. 5.2.1 Platform (API Lifecycle Management, Analytics & Monitoring, Gateway, Security, and More) | |
      2. 5.2.2 Services |
    3. 5.3 By End-User Industry | |
      1. 5.3.1 BFSI | |
      2. 5.3.2 IT and Telecommunications | |
      3. 5.3.3 Healthcare | |
      4. 5.3.4 Other Industries |
    4. 5.4 By Enterprise Size | |
      1. 5.4.1 Large Enterprises | |
      2. 5.4.2 Small and Medium-Sized Enterprises
  6. 6 Regional Analysis |
    1. 6.1 North America | |
      1. 6.1.1 United States | |
      2. 6.1.2 Canada | |
      3. 6.1.3 Mexico |
    2. 6.2 Europe | |
      1. 6.2.1 Germany | |
      2. 6.2.2 United Kingdom | |
      3. 6.2.3 France | |
      4. 6.2.4 Italy | |
      5. 6.2.5 Spain | |
      6. 6.2.6 Nordic Countries | |
      7. 6.2.7 Russia | |
      8. 6.2.8 Rest of Europe |
    3. 6.3 Asia-Pacific | |
      1. 6.3.1 China | |
      2. 6.3.2 India | |
      3. 6.3.3 Japan | |
      4. 6.3.4 South Korea | |
      5. 6.3.5 ASEAN | |
      6. 6.3.6 Rest of Asia-Pacific |
    4. 6.4 South America | |
      1. 6.4.1 Brazil | |
      2. 6.4.2 Argentina | |
      3. 6.4.3 Rest of South America |
    5. 6.5 Middle East & Africa | |
      1. 6.5.1 Saudi Arabia | |
      2. 6.5.2 UAE | |
      3. 6.5.3 South Africa | |
      4. 6.5.4 Egypt | |
      5. 6.5.5 Rest of MEA
  7. 7 Competitive Landscape |
    1. 7.1 Market Share Analysis (2025) |
    2. 7.2 Competitive Benchmarking Matrix |
    3. 7.3 Company Profiles | |
      1. 7.3.1 Google (Apigee) | |
      2. 7.3.2 Microsoft (Azure API Management) | |
      3. 7.3.3 Amazon Web Services | |
      4. 7.3.4 Salesforce (MuleSoft) | |
      5. 7.3.5 IBM (API Connect) | |
      6. 7.3.6 Kong Inc. | |
      7. 7.3.7 Axway | |
      8. 7.3.8 Software AG (webMethods) | |
      9. 7.3.9 Broadcom (Layer7) | |
      10. 7.3.10 Akamai Technologies
  8. 8 Future Outlook & Strategic Recommendations (2026–2035) |
    1. 8.1 AI-Autonomous API Operations |
    2. 8.2 Platform Economics and API Marketplaces |
    3. 8.3 Zero-Trust API Security Architecture |
    4. 8.4 Sustainability and ESG Data Exchange
  9. 9 Recent Developments & News
  10. 10 Frequently Asked Questions (FAQs)
  11. 11 Report Scope & Methodology |
    1. 11.1 Study Period & Base Year |
    2. 11.2 Data Sources & Citations |
    3. 11.3 Abbreviations
  12. 12 LIST OF TABLES |
  13. TABLE 1 Global API Management Market Size & Forecast, by Revenue (USD Billion), 2021–2035 |
  14. TABLE 2 Global API Management Market – Year-over-Year Growth Analysis, 2021–2035 |
  15. TABLE 3 Global API Management Market – Driver Impact Analysis |
  16. TABLE 4 Global API Management Market – Restraints Impact Analysis |
  17. TABLE 5 Global API Management Market Size, by Deployment Model, 2021–2035 (USD Billion) |
  18. TABLE 6 Global API Management Market Size, by Offering, 2021–2035 (USD Billion) |
  19. TABLE 7 Global API Management Market Size, by End-User Industry, 2021–2035 (USD Billion) |
  20. TABLE 8 Global API Management Market Size, by Enterprise Size, 2021–2035 (USD Billion) |
  21. TABLE 9 Global API Management Market Size, by Region, 2021–2035 (USD Billion) |
  22. TABLE 10 North America API Management Market Size, by Country, 2021–2035 (USD Billion) |
  23. TABLE 11 Europe API Management Market Size, by Country, 2021–2035 (USD Billion) |
  24. TABLE 12 Asia-Pacific API Management Market Size, by Country, 2021–2035 (USD Billion) |
  25. TABLE 13 South America API Management Market Size, by Country, 2021–2035 (USD Billion) |
  26. TABLE 14 Middle East & Africa API Management Market Size, by Country, 2021–2035 (USD Billion) |
  27. TABLE 15 North America API Management Market Size, by Deployment Model, 2021–2035 (USD Billion) |
  28. TABLE 16 North America API Management Market Size, by Offering, 2021–2035 (USD Billion) |
  29. TABLE 17 North America API Management Market Size, by End-User Industry, 2021–2035 (USD Billion) |
  30. TABLE 18 North America API Management Market Size, by Enterprise Size, 2021–2035 (USD Billion) |
  31. TABLE 19 Europe API Management Market Size, by Deployment Model, 2021–2035 (USD Billion) |
  32. TABLE 20 Europe API Management Market Size, by Offering, 2021–2035 (USD Billion) |
  33. TABLE 21 Europe API Management Market Size, by End-User Industry, 2021–2035 (USD Billion) |
  34. TABLE 22 Europe API Management Market Size, by Enterprise Size, 2021–2035 (USD Billion) |
  35. TABLE 23 Asia-Pacific API Management Market Size, by Deployment Model, 2021–2035 (USD Billion) |
  36. TABLE 24 Asia-Pacific API Management Market Size, by Offering, 2021–2035 (USD Billion) |
  37. TABLE 25 Asia-Pacific API Management Market Size, by End-User Industry, 2021–2035 (USD Billion) |
  38. TABLE 26 Asia-Pacific API Management Market Size, by Enterprise Size, 2021–2035 (USD Billion) |
  39. TABLE 27 South America API Management Market Size, by Deployment Model, 2021–2035 (USD Billion) |
  40. TABLE 28 South America API Management Market Size, by Offering, 2021–2035 (USD Billion) |
  41. TABLE 29 South America API Management Market Size, by End-User Industry, 2021–2035 (USD Billion) |
  42. TABLE 30 South America API Management Market Size, by Enterprise Size, 2021–2035 (USD Billion) |
  43. TABLE 31 Middle East & Africa API Management Market Size, by Deployment Model, 2021–2035 (USD Billion) |
  44. TABLE 32 Middle East & Africa API Management Market Size, by Offering, 2021–2035 (USD Billion) |
  45. TABLE 33 Middle East & Africa API Management Market Size, by End-User Industry, 2021–2035 (USD Billion) |
  46. TABLE 34 Middle East & Africa API Management Market Size, by Enterprise Size, 2021–2035 (USD Billion) |
  47. TABLE 35 Competitive Benchmarking Matrix – Global API Management Market, 2025 |
  48. TABLE 36 Company Profiles – Key Players, Global API Management Market |
  49. TABLE 37 Recent Developments & Strategic Announcements, 2024–2025 |
  50. TABLE 38 Report Scope & Methodology Summary |
  51. TABLE 39 Detailed Sources and Citations
  52. 13 LIST OF FIGURES |
  53. FIGURE 1 Global API Management Market Dynamics (Drivers, Restraints, Opportunities) |
  54. FIGURE 2 Industry Value Chain Analysis – API Management Market |
  55. FIGURE 3 Porter's Five Forces Analysis – API Management Market |
  56. FIGURE 4 Global API Management Market Size Trend & Forecast (USD Billion), 2021–2035 |
  57. FIGURE 5 API Management Market Share, by Deployment Model (2025) |
  58. FIGURE 6 API Management Market Share, by Offering (2025) |
  59. FIGURE 7 API Management Market Share, by End-User Industry (2025) |
  60. FIGURE 8 API Management Market Share, by Enterprise Size (2025) |
  61. FIGURE 9 API Management Market Share, by Region (2025) |
  62. FIGURE 10 North America API Management Market – Country Share (2025) |
  63. FIGURE 11 Europe API Management Market – Country Share (2025) |
  64. FIGURE 12 Asia-Pacific API Management Market – Country Share (2025) |
  65. FIGURE 13 South America API Management Market – Country Share (2025) |
  66. FIGURE 14 Middle East & Africa API Management Market – Country Share (2025) |
  67. FIGURE 15 Competitive Landscape – Market Share Analysis (2025) |
  68. FIGURE 16 Competitive Positioning Matrix – API Management Market

SEGMENTATION QUICK REFERENCE

DimensionSub-SegmentsDominant SegmentFastest Growing Segment
Deployment ModelCloud, On-Premise, HybridCloud (74.0% share, 2025)Hybrid (19.4% CAGR)
OfferingPlatform (Lifecycle Management, Analytics, Gateway, Security, More), ServicesPlatform (65.6% share, 2025)Services (24.6% CAGR)
End-User IndustryBFSI, IT & Telecommunications, Healthcare, Other IndustriesBFSI (29.3% share, 2025)Healthcare (17.3% CAGR)
Enterprise SizeLarge Enterprises, Small and Medium-Sized EnterprisesLarge Enterprises (53.8% share, 2025)SMEs (23.5% CAGR)
GeographyNorth America, Europe, Asia-Pacific, South America, Middle East & AfricaNorth America (42.1% share, 2025)Asia-Pacific (18.6% CAGR)


MARKET SEGMENTATION OVERVIEW

By Deployment Model

Sub-SegmentKey Trend
CloudMulti-cloud and serverless workloads driving gateway-as-a-service adoption
On-PremiseSustained demand from defense, intelligence, and data-sovereignty-constrained verticals
HybridRegulated industries adopting split architectures with centralized policy planes


Cloud deployment remains the default choice for organizations building API programs from scratch, offering elastic scaling and managed operations. Hybrid models are growing fastest as banks and healthcare systems route sensitive workloads through on-premise gateways while directing public-facing traffic to cloud-managed endpoints.

By Offering

Sub-SegmentKey Trend
Platform (Lifecycle Management, Analytics, Gateway, Security, More)Suite consolidation replacing best-of-breed point solutions
ServicesManaged API operations and migration consulting scaling rapidly


Platform solutions command the majority of revenue as enterprises prioritize integrated suites that reduce vendor management overhead. Services growth reflects the complexity of migrating legacy middleware estates to modern architectures and the rising demand for outsourced API operations among mid-market firms.

By End-User Industry

Sub-SegmentKey Trend
BFSIOpen-banking and open-finance mandates compelling standardized API infrastructure
IT and Telecommunications5G Open Gateway and developer-platform strategies creating new API revenue streams
HealthcareFHIR-based interoperability standards driving rapid API adoption
Other IndustriesManufacturing IoT, retail commerce, and government DPI broadening the buyer base


BFSI leads all verticals due to the direct regulatory link between open-banking mandates and API infrastructure procurement. Healthcare is the fastest-growing vertical as interoperability regulations require FHIR-compliant patient-data APIs across providers, payers, and public-health systems.

By Enterprise Size

Sub-SegmentKey Trend
Large EnterprisesCentralized governance across complex multi-cloud, multi-region estates
Small and Medium-Sized EnterprisesSelf-service portals and usage-based pricing lowering adoption barriers


Large enterprises account for the majority of current spending, driven by the need to govern thousands of internal and external API endpoints. SMEs represent the fastest-growing buyer segment as cloud-native vendors introduce freemium tiers and consumption-based billing that eliminate upfront licensing costs.


Download PDF ×

We do not share your information with anyone. However, we may send you emails based on your report interest from time to time. You may contact us at any time to opt-out.