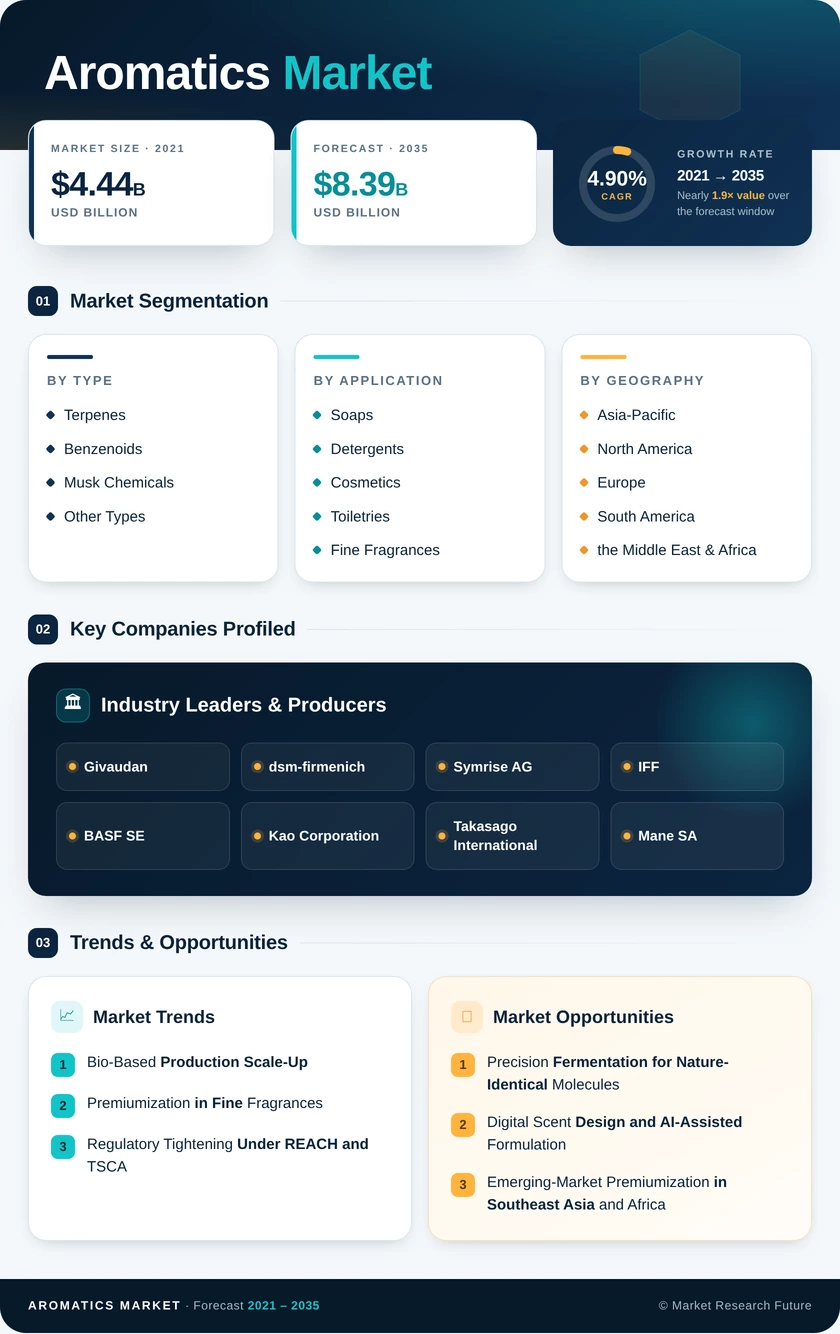
Aromatics Market (2026 - 2035)

ID: MRFR/CnM/0425-HCR
135 Pages
Chitranshi Jaiswal
Last Updated: July 08, 2026
Aromatic Market Research Report Information By Type (P-Xylene, O-Xylene, Toluene, Benzene, and Others), By Application (Additive and Solvent), By Industry (Paint & Coatings, Adhesives, Pharmaceuticals, Chemicals, and Others), and By Region (North America, Europe, Asia-Pacific, and Rest Of The World) – Market Forecast Till 2035
Aromatics Market
Market Size
Forecast Period2026-2035
CAGR (2026-2035)4.90%
2025 Market SizeUSD 5.22 Billion
2035 Market SizeUSD 8.39 Billion
Key Players
Givaudan
dsm-firmenich
Symrise AG
IFF
BASF SE
Kao Corporation
Opportunities
  • Precision Fermentation for Nature-Identical Molecules
  • Digital Scent Design and AI-Assisted Formulation
  • Emerging-Market Premiumization in Southeast Asia and Africa
  1. 1 Market Overview |
    1. 1.1 Study Assumptions & Market Definition |
    2. 1.2 Scope of the Study |
    3. 1.3 Research Methodology
  2. 2 Market Summary & Key Takeaways
  3. 3 Market Dynamics |
    1. 3.1 Market Drivers Analysis | |
      1. 3.1.1 Bio-Based & Fermentation-Derived Production Scale-Up | |
      2. 3.1.2 Premiumization in Fine Fragrances | |
      3. 3.1.3 REACH & TSCA Regulatory Tightening | |
      4. 3.1.4 Asia-Pacific Personal-Care Consumption Growth | |
      5. 3.1.5 Clean-Label & Natural-Identical Ingredient Demand | |
      6. 3.1.6 Rise of Niche and Indie Fragrance Brands | |
      7. 3.1.7 E-Commerce Expansion for Personal-Care Products |
    2. 3.2 Market Restraints Analysis | |
      1. 3.2.1 Volatile Petrochemical Feedstock Pricing | |
      2. 3.2.2 Allergen-Related Reformulation Costs | |
      3. 3.2.3 Counterfeit and Adulterated Ingredient Risk | |
      4. 3.2.4 Supply-Chain Concentration in Key Intermediates | |
      5. 3.2.5 Consumer Backlash Against Synthetic Labeling |
    3. 3.3 Market Opportunity Analysis | |
      1. 3.3.1 Precision Fermentation for Nature-Identical Molecules | |
      2. 3.3.2 Digital Scent Design and AI-Assisted Formulation | |
      3. 3.3.3 Emerging-Market Premiumization in Southeast Asia and Africa | |
      4. 3.3.4 Circular Chemistry and Waste-Stream Valorization | |
      5. 3.3.5 Subscription and Direct-to-Consumer Fragrance Models |
    4. 3.4 Industry Value Chain Analysis |
    5. 3.5 Porter's Five Forces Analysis
  4. 4 Global Aromatic Market Size & Forecast (2021–2035) |
    1. 4.1 Historical Market Size (2021–2025) |
    2. 4.2 Current & Forecast Market Size (2026–2035) |
    3. 4.3 Market Size by Revenue (USD Billion) |
    4. 4.4 Year-over-Year Growth Analysis
  5. 5 Segmentation Analysis |
    1. 5.1 By Type | |
      1. 5.1.1 Terpenes | |
      2. 5.1.2 Benzenoids | |
      3. 5.1.3 Musk Chemicals | |
      4. 5.1.4 Other Types |
    2. 5.2 By Application | |
      1. 5.2.1 Soaps and Detergents | |
      2. 5.2.2 Cosmetics and Toiletries | |
      3. 5.2.3 Fine Fragrances | |
      4. 5.2.4 Household Products | |
      5. 5.2.5 Food and Beverage | |
      6. 5.2.6 Other Applications
  6. 6 Regional Analysis |
    1. 6.1 North America | |
      1. 6.1.1 United States | |
      2. 6.1.2 Canada | |
      3. 6.1.3 Mexico |
    2. 6.2 Europe | |
      1. 6.2.1 Germany | |
      2. 6.2.2 United Kingdom | |
      3. 6.2.3 France | |
      4. 6.2.4 Italy | |
      5. 6.2.5 Spain | |
      6. 6.2.6 Nordic Countries | |
      7. 6.2.7 Russia | |
      8. 6.2.8 Rest of Europe |
    3. 6.3 Asia-Pacific | |
      1. 6.3.1 China | |
      2. 6.3.2 India | |
      3. 6.3.3 Japan | |
      4. 6.3.4 South Korea | |
      5. 6.3.5 ASEAN | |
      6. 6.3.6 Rest of Asia-Pacific |
    4. 6.4 South America | |
      1. 6.4.1 Brazil | |
      2. 6.4.2 Argentina | |
      3. 6.4.3 Rest of South America |
    5. 6.5 Middle East & Africa | |
      1. 6.5.1 Saudi Arabia | |
      2. 6.5.2 UAE | |
      3. 6.5.3 South Africa | |
      4. 6.5.4 Egypt | |
      5. 6.5.5 Rest of MEA
  7. 7 Competitive Landscape |
    1. 7.1 Market Share Analysis (2025) |
    2. 7.2 Competitive Benchmarking Matrix |
    3. 7.3 Company Profiles | |
      1. 7.3.1 Givaudan | |
      2. 7.3.2 dsm-firmenich | |
      3. 7.3.3 Symrise AG | |
      4. 7.3.4 IFF | |
      5. 7.3.5 BASF SE | |
      6. 7.3.6 Kao Corporation | |
      7. 7.3.7 Takasago International | |
      8. 7.3.8 Mane SA | |
      9. 7.3.9 Robertet Group | |
      10. 7.3.10 Privi Speciality Chemicals
  8. 8 Future Outlook & Strategic Recommendations (2026–2035) |
    1. 8.1 Biotechnology-Driven Supply-Chain Transformation |
    2. 8.2 AI and Digital Tools Reshaping Product Development |
    3. 8.3 ESG Reporting and Scope 3 Emissions Pressure |
    4. 8.4 Regulatory Convergence Across Major Markets
  9. 9 Recent Developments & News
  10. 10 Frequently Asked Questions (FAQs)
  11. 11 Report Scope & Methodology |
    1. 11.1 Study Period & Base Year |
    2. 11.2 Data Sources & Citations |
    3. 11.3 Abbreviations
  12. 12 LIST OF TABLES |
  13. TABLE 1 Global Aromatic Market Size & Forecast, by Revenue (USD Billion), 2021–2035 |
  14. TABLE 2 Global Aromatic Market – Year-over-Year Growth Analysis, 2021–2035 |
  15. TABLE 3 Global Aromatic Market – Driver Impact Analysis |
  16. TABLE 4 Global Aromatic Market – Restraint Impact Analysis |
  17. TABLE 5 Global Aromatic Market Size, by Type, 2021–2035 (USD Billion) |
  18. TABLE 6 Global Aromatic Market Size, by Application, 2021–2035 (USD Billion) |
  19. TABLE 7 Global Aromatic Market Size, by Region, 2021–2035 (USD Billion) |
  20. TABLE 8 North America Aromatic Market Size, by Country, 2021–2035 (USD Billion) |
  21. TABLE 9 Europe Aromatic Market Size, by Country, 2021–2035 (USD Billion) |
  22. TABLE 10 Asia-Pacific Aromatic Market Size, by Country, 2021–2035 (USD Billion) |
  23. TABLE 11 South America Aromatic Market Size, by Country, 2021–2035 (USD Billion) |
  24. TABLE 12 Middle East & Africa Aromatic Market Size, by Country, 2021–2035 (USD Billion) |
  25. TABLE 13 Competitive Benchmarking Matrix – Global Aromatic Market, 2025 |
  26. TABLE 14 Company Profiles – Key Players, Global Aromatic Market |
  27. TABLE 15 Recent Developments & Strategic Announcements, 2023–2025 |
  28. TABLE 16 Report Scope & Methodology Summary |
  29. TABLE 17 Detailed Sources and Citations |
  30. TABLE 18 North America Aromatic Market Size, by Type, 2021–2035 (USD Billion) |
  31. TABLE 19 North America Aromatic Market Size, by Application, 2021–2035 (USD Billion) |
  32. TABLE 20 Europe Aromatic Market Size, by Type, 2021–2035 (USD Billion) |
  33. TABLE 21 Europe Aromatic Market Size, by Application, 2021–2035 (USD Billion) |
  34. TABLE 22 Asia-Pacific Aromatic Market Size, by Type, 2021–2035 (USD Billion) |
  35. TABLE 23 Asia-Pacific Aromatic Market Size, by Application, 2021–2035 (USD Billion) |
  36. TABLE 24 South America Aromatic Market Size, by Type, 2021–2035 (USD Billion) |
  37. TABLE 25 South America Aromatic Market Size, by Application, 2021–2035 (USD Billion) |
  38. TABLE 26 Middle East & Africa Aromatic Market Size, by Type, 2021–2035 (USD Billion) |
  39. TABLE 27 Middle East & Africa Aromatic Market Size, by Application, 2021–2035 (USD Billion)
  40. 13 LIST OF FIGURES |
  41. FIGURE 1 Global Aromatic Market Dynamics (Drivers, Restraints, Opportunities) |
  42. FIGURE 2 Industry Value Chain Analysis – Global Aromatic Market |
  43. FIGURE 3 Porter's Five Forces Analysis – Global Aromatic Market |
  44. FIGURE 4 Global Aromatic Market Size Trend & Forecast (USD Billion), 2021–2035 |
  45. FIGURE 5 Global Aromatic Market Share, by Type (%), 2025 |
  46. FIGURE 6 Global Aromatic Market Share, by Application (%), 2025 |
  47. FIGURE 7 Global Aromatic Market Share, by Region (%), 2025 |
  48. FIGURE 8 North America Aromatic Market Size & Forecast (USD Billion), 2021–2035 |
  49. FIGURE 9 Europe Aromatic Market Size & Forecast (USD Billion), 2021–2035 |
  50. FIGURE 10 Asia-Pacific Aromatic Market Size & Forecast (USD Billion), 2021–2035 |
  51. FIGURE 11 South America Aromatic Market Size & Forecast (USD Billion), 2021–2035 |
  52. FIGURE 12 Middle East & Africa Aromatic Market Size & Forecast (USD Billion), 2021–2035 |
  53. FIGURE 13 Competitive Landscape – Market Share Analysis, 2025

Segmentation Quick Reference

DimensionSub-SegmentsDominant SegmentFastest Growing Segment
By TypeTerpenes, Benzenoids, Musk Chemicals, Other TypesTerpenes (41.2% share, 2025)Musk Chemicals (5.35% CAGR)
By ApplicationSoaps and Detergents, Cosmetics and Toiletries, Fine Fragrances, Household Products, Food and Beverage, Other ApplicationsCosmetics and Toiletries (36.6% share, 2025)Fine Fragrances (5.52% CAGR)
By GeographyAsia-Pacific, North America, Europe, South America, the Middle East & AfricaAsia-Pacific (41.5% share, 2025)Asia-Pacific (6.10% CAGR)


Market Segmentation Overview

By Type

Sub-SegmentKey Trend
TerpenesFermentation-derived production reduces feedstock volatility
BenzenoidsTSCA and REACH are driving substitution toward safer intermediates
Musk ChemicalsMacrocyclic and alicyclic variants replacing legacy nitro-musks
Other TypesSpecialty aldehydes and lactones are gaining traction in niche perfumery.


Terpenes maintain their leading position through versatile downstream applications and expanding bio-based manufacturing routes. Musk chemicals are growing fastest as regulatory pressure eliminates older musk chemistries and perfumers adopt biodegradable fourth-generation alternatives.

By Application

Sub-SegmentKey Trend
Soaps and DetergentsScent-differentiation strategies in premium laundry care
Cosmetics and ToiletriesFragrance integration into skincare and haircare formulations
Fine FragrancesIndie-brand proliferation and artisanal perfumery expansion
Household ProductsAir-care and malodor-counteractant innovation
Food and BeverageNatural-identical flavoring mandates in processed foods
Other ApplicationsIndustrial masking agents and aromatherapy wellness products


Cosmetics and toiletries anchor demand through premiumization across all price tiers. Fine fragrances lead growth as niche and DTC brands create demand for distinctive, higher-specification ingredients.

By Geography

Sub-SegmentKey Trend
Asia-PacificChina's prestige fragrance boom; India PLI-scheme capacity expansion
North AmericaClean-label and TSCA-driven reformulation cycles
EuropeREACH allergen restrictions; Grasse perfumery ecosystem
South AmericaCitrus-byproduct valorization; domestic personal-care growth
Middle East & AfricaLuxury perfumery culture; Vision 2030 chemical-sector investment


Asia-Pacific leads both in market share and growth rate, propelled by rising consumer spending on personal care and government-backed manufacturing incentives. Europe and North America remain critical value markets, driven by regulatory complexity and high-specification ingredient demand.


Download PDF ×

We do not share your information with anyone. However, we may send you emails based on your report interest from time to time. You may contact us at any time to opt-out.