Aromatics Market (2026 - 2035)

Aromatic Market Research Report Information By Type (P-Xylene, O-Xylene, Toluene, Benzene, and Others), By Application (Additive and Solvent), By Industry (Paint & Coatings, Adhesives, Pharmaceuticals, Chemicals, and Others), and By Region (North America, Europe, Asia-Pacific, and Rest Of The World) – Market Forecast Till 2035
ID: MRFR/CnM/0425-HCR
135 Pages
Chitranshi Jaiswal
Last Updated: July 08, 2026
Aromatics Market
Market Size
Forecast Period2026-2035
CAGR (2026-2035)4.90%
2025 Market SizeUSD 5.22 Billion
2035 Market SizeUSD 8.39 Billion
Key Players
Givaudan
dsm-firmenich
Symrise AG
IFF
BASF SE
Kao Corporation
Opportunities
  • Precision Fermentation for Nature-Identical Molecules
  • Digital Scent Design and AI-Assisted Formulation
  • Emerging-Market Premiumization in Southeast Asia and Africa

Key Report Takeaways

The global Aromatic Market was valued at USD 5.22 Billion in 2025 and is projected to grow from USD 5.46 Billion in 2026 to USD 8.39 Billion by 2035, registering a CAGR of 4.90% during the forecast period (2026–2035). Tightening chemical safety regulations across the EU and North America — particularly REACH amendments targeting sensitizer disclosure — and the rapid commercialization of bio-based production routes are reshaping cost structures and product development timelines across the Aromatic Market. Corporate sustainability pledges from consumer-goods multinationals have channeled an estimated USD 2.8 billion in cumulative R&D spending toward green chemistry platforms since 2022 [1].

Fermentation and enzymatic conversion approaches are replacing, to a growing extent, the legacy petrochemical synthesis routes. Microbial platforms are currently generating pilot to commercial quantities of limonene, linalool and santalene, a transition hastened by the USDA BioPreferred Program and the European Commission’s Chemicals Strategy for Sustainability [2]. Some companies have realized 15-20% unit-cost savings as they move terpene lines to yeast-based fermentation, an indication of a more fundamental shift away from crude-oil-linked feedstocks.

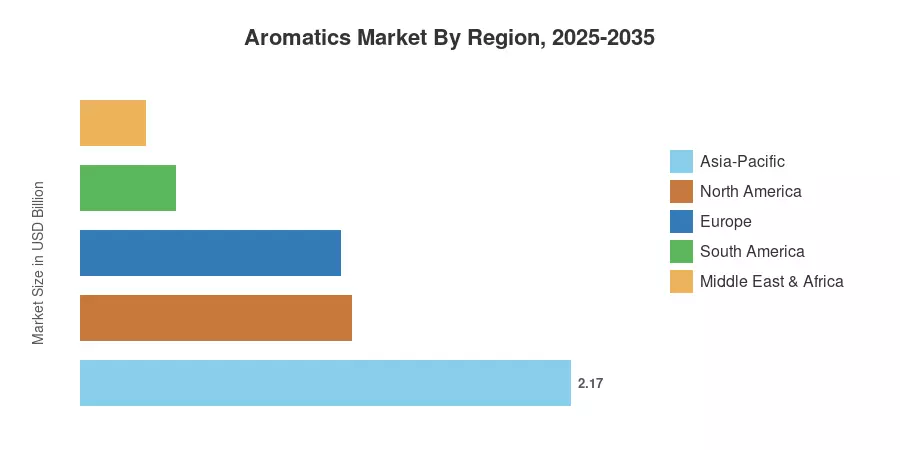
Asia-Pacific holds the greatest share of the Aromatic Market, with 41.5% of 2025 revenue, driven by a double-digit increase in prestige fragrance consumption in China and a developing specialty-chemicals production base in India. The region also has the fastest CAGR at 6.10% until 2035. Europe is the second largest market at 22.0%, supported by the fragrance tradition of France and the industrial flavoring cluster in Germany. The Aromatic Market is expected to continue its quality-driven growth over the next decade with premiumization trends and regulatory harmonization remaining on a convergent path.


• By Type

  • Terpenes accounted for 41.2% of the Aromatic Market in 2025, bolstered by scalable microbial manufacturing platforms.
  • Musk chemicals are forecast to expand at a 5.35% CAGR through 2035, driven by demand for biodegradable macrocyclic and alicyclic fixatives.

• By Application

  • Cosmetics and toiletries held 36.6% revenue share in the Aromatic Market in 2025, reflecting global personal-care premiumization.
  • Fine fragrances are projected to register a 5.52% CAGR through 2035, propelled by niche-brand proliferation and artisanal perfumery.

• By Region

  • Asia-Pacific captured 41.5% of the Aromatic Market in 2025 and leads all regions with a 6.10% CAGR forecast.
  • North America contributed 23.0% of 2025 revenue, underpinned by clean-label reformulation mandates.


Market Size and Forecast (2021–2035)

Market Research Future's sizing model triangulates supply-side production data, trade-flow analysis, and downstream consumption surveys across 25 countries. Historical figures (2021–2024) draw on audited financial disclosures and customs databases; forecast values apply a constant-CAGR trajectory anchored to the 2025 base year.
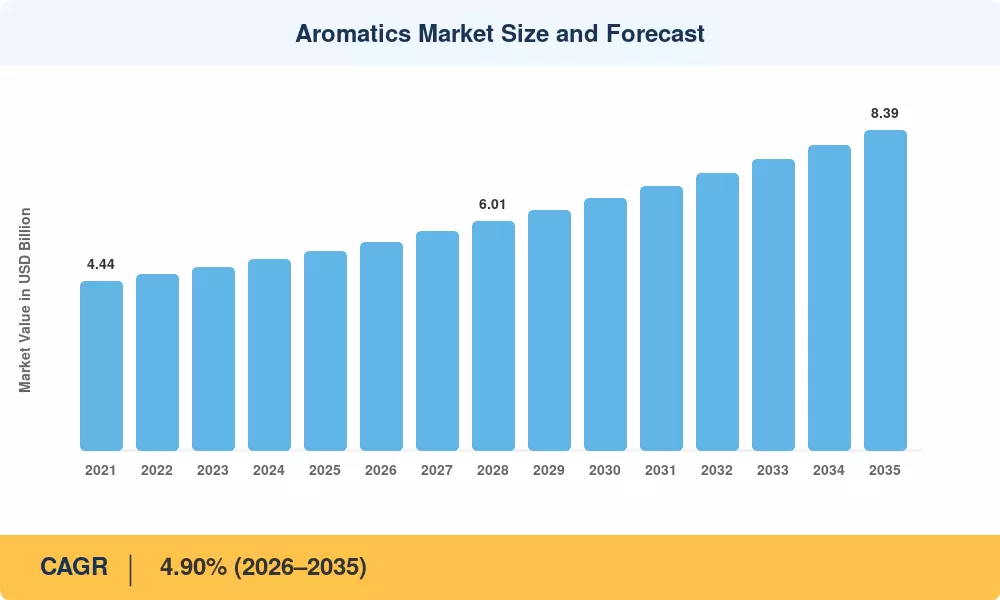
Aromatics Market Size and Forecast
Our Impact
Enabled $4.3B Revenue Impact for Fortune 500 and Leading Multinationals
Partnering with 2000+ Global Organizations Each Year
30K+ Citations by Top-Tier Firms in the Industry

Driver Impact Analysis

Driver ~% Impact on CAGR Geographic Relevance Impact Timeline
Bio-based & fermentation-derived production scale-up +0.9% Global Medium-term (2–4 yr)
Premiumization in fine fragrances +0.7% Europe, North America Long-term (≥4 yr)
REACH & TSCA regulatory tightening +0.6% Europe, North America Short-term (≤2 yr)
Asia-Pacific personal-care consumption growth +0.8% Asia-Pacific Long-term (≥4 yr)
Clean-label & natural-identical ingredient demand +0.5% Global Medium-term (2–4 yr)
Rise of niche and indie fragrance brands +0.4% North America, Europe Medium-term (2–4 yr)
E-commerce expansion for personal-care products +0.3% Global Short-term (≤2 yr)


Bio-Based Production Scale-Up

Fermentation-derived terpenes have transitioned from R&D to commercial-scale viability. The global bio-based chemicals market reached a valuation of USD 120.16 billion in 2026, projected to maintain a compound annual growth rate of 9.6% through 2034. Institutional procurement mandates, such as the USDA BioPreferred Program, provide a stable demand floor for over 130 categories, insulating the aromatic supply chain against conventional petrochemical price volatility.


Premiumization in Fine Fragrances

The global fragrance market reached USD 86.86 billion in 2026, driven by a 10.2% annual growth rate fueled by rising demand for artisanal and premium products. Consumers are increasingly prioritizing high-purity, natural, and sustainable ingredients. This shift compels producers to adopt advanced chromatographic and distillation technologies, as artisanal houses seek superior quality to justify premium pricing strategies for luxury segments.


Regulatory Tightening Under REACH and TSCA

European regulatory frameworks are intensifying, with Commission Regulation (EU) 2023/1545 mandating the disclosure of 56 additional fragrance allergens by 31 July 2026. This brings the total count of declarable substances to over 80. Concurrently, US EPA risk evaluations are driving requirements for closed-system processing, raising compliance costs and favoring large-scale, integrated producers with sophisticated analytical capabilities and robust safety documentation.


Asia-Pacific Personal-Care Consumption Boom

Asia-Pacific remains the primary growth engine, with the cosmetics and personal care market projected to reach USD 173.4 billion in 2026. India is accelerating local manufacturing through its Production-Linked Incentive (PLI) schemes, which have already committed significant investment to critical chemical intermediates. Combined with China’s expanding consumer base, these regional dynamics ensure a sustained surge in long-term volume demand.


Restraints Impact Analysis

Restraint impact percentages are directional estimates of negative pressure on the growth trajectory. They do not mechanically subtract from the headline CAGR.

Restraint ~% Impact on CAGR Geographic Relevance Impact Timeline
Volatile petrochemical feedstock pricing –0.5% Global Short-term (≤2 yr)
Allergen-related reformulation costs –0.4% Europe Medium-term (2–4 yr)
Counterfeit and adulterated ingredient risk –0.3% Asia-Pacific, MEA Long-term (≥4 yr)
Supply-chain concentration in key intermediates –0.3% Global Medium-term (2–4 yr)
Consumer backlash against synthetic labeling –0.2% North America, Europe Short-term (≤2 yr)


Volatile Petrochemical Feedstock Pricing

The aromatic industry remains heavily reliant on petroleum-based feedstocks, with the global petroleum liquid feedstock market valued at USD 359.28 billion in 2026. Producers lacking vertical integration face significant margin pressure due to inherent price volatility in crude oil markets. As demand for these foundational petrochemicals continues to grow, smaller participants face persistent risks regarding supply costs and procurement instability.


Allergen-Related Reformulation Costs

New European Union regulatory requirements, effective 31 July 2026, mandate the disclosure of 56 additional fragrance allergens, expanding the regulated list to 82 substances. Brands must update technical documentation and product labeling for every affected SKU. This compliance burden disproportionately impacts mid-tier manufacturers, who face substantial operational costs to ensure ingredient transparency and safety documentation under these tightening regional standards.


Counterfeit and Adulterated Ingredients

The global counterfeit fragrance market reached an estimated valuation of over USD 3 billion in 2026. Illicit trade now accounts for nearly 28% of global fragrance sales, severely undermining the pricing power and brand equity of legitimate producers. These unregulated products often contain hazardous concentrations of restricted chemicals, presenting both a persistent public health risk and a significant economic drain on the industry.


Aromatics Market Opportunities

Precision Fermentation for Nature-Identical Molecules

Advances in synthetic biology enable cost-competitive production of high-value molecules at commercial scale. The global precision fermentation market is valued at USD 8 billion in 2026, with an expected compound annual growth rate of 41% through 2033. This sector provides incumbents with critical opportunities to license platform technologies, effectively eliminating reliance on scarce, weather-dependent, and geographically constrained botanical raw materials.


Digital Scent Design and AI-Assisted Formulation

The artificial intelligence market for beauty and cosmetics is valued at USD 5.3 billion in 2026, growing at an annual rate of 21.1%. AI-driven models now enable rapid screening of candidate molecules, drastically reducing development cycles for novel fragrances. The aromatic market benefits as these digital pipelines generate demand for specific, high-performance intermediates that traditional legacy catalogs do not yet feature.


Emerging-Market Premiumization in Southeast Asia and Africa

Asia-Pacific remains the fastest-growing region for fragrance consumption, with the regional cosmetics and personal care market projected to reach USD 616.9 billion in 2026. Rapid urbanization and rising disposable income across Southeast Asia and Nigeria position these regions as major untapped volume engines, offering aromatic producers significant long-term growth potential as per-capita fragrance spending steadily aligns with global averages.


Circular Chemistry and Waste-Stream Valorization

The global citrus industry generates approximately 15 million tonnes of processing waste, including peel and pulp, annually. Upcycling these by-products into high-purity terpene fractions transforms a significant environmental liability into a sustainable feedstock. The aromatic market can capitalize on this circularity to meet mounting brand-owner requirements for ESG reporting and verifiable sustainable sourcing, while improving overall production cost structures.


Subscription and Direct-to-Consumer Fragrance Models

DTC fragrance brands raised over USD 600 Million in venture funding between 2022 and 2024 . Their rapid product-iteration cycles and small-batch launches create demand for agile, responsive Aromatic Market suppliers capable of delivering custom blends at lower minimum order quantities. This business-model shift offers margin expansion opportunities for mid-tier specialty producers.


Aromatics Market Future Outlook

Biotechnology-Driven Supply-Chain Transformation

By 2030, fermentation-derived and enzymatically synthesized molecules are expected to account for over 25% of global terpene production, up from approximately 8% in 2024 [2]. This shift will compress cost structures across the Aromatic Market while enabling the production of novel molecules that cannot be economically extracted from botanical sources. Companies that invest early in microbial-platform IP will capture disproportionate value as brand owners prioritize nature-identical sourcing.

AI and Digital Tools Reshaping Product Development

Artificial intelligence is collapsing fragrance development timelines from 18–24 months to under six months in leading houses [17]. Predictive models that map molecular structure to olfactory perception are generating candidate aroma compounds at a pace that traditional trial-and-error approaches cannot match. The Aromatic Market will see increased demand for rapid small-batch production, flexible toll manufacturing, and digitally integrated supply chains capable of supporting accelerated innovation cycles.

ESG Reporting and Scope 3 Emissions Pressure

The EU Corporate Sustainability Reporting Directive (CSRD), effective from 2024, requires Scope 3 emissions disclosure from over 50,000 companies [19]. Downstream brand owners are cascading these requirements to upstream Aromatic Market suppliers, demanding carbon-footprint data at the ingredient level. Producers with verified lifecycle-assessment data and low-carbon production pathways will gain preferential supplier status, while laggards risk deselection from procurement shortlists.

Regulatory Convergence Across Major Markets

ECHA, US EPA, and China's MEE are moving toward greater alignment on chemical-safety evaluation methodologies, reducing the fragmentation that has historically complicated global Aromatic Market trade [7]. The OECD's Mutual Acceptance of Data framework is expanding to cover additional endpoints relevant to fragrance allergens, potentially halving registration costs for producers operating across multiple jurisdictions by 2030.


Aromatics Market Segmentation

By Type

Segment Key Metric (2025) Primary Demand Driver
Terpenes 41.2% market share Bio-based production scale, citrus-byproduct supply
Benzenoids USD 1.49 Billion Industrial solvent and intermediate applications
Musk Chemicals 5.35% CAGR (2026–2035) Biodegradable macrocyclic fixative demand
Other Types USD 0.70 Billion Specialty aldehydes, phenolics, lactones


Terpenes retain their dominant position in the Aromatic Market owing to their versatility across fragrance, flavor, and cleaning product formulations. D-limonene alone accounts for the largest single-molecule volume in the segment, benefiting from abundant citrus-peel feedstock and established fermentation pathways. Microbial production of santalene and farnesene is adding high-value molecules to the terpene portfolio, supporting margin expansion.

Musk chemicals represent the fastest-growing type segment in the Aromatic Market. Fourth-generation alicyclic and macrocyclic musks address the biodegradability concerns that led to restrictions on nitro-musks and polycyclic musks in prior regulatory cycles. Perfumers increasingly specify these next-generation fixatives for fine-fragrance and premium personal-care applications, driving double-digit growth in specialty grades.

By Application

Segment Key Metric (2025) Primary Demand Driver
Cosmetics and Toiletries 36.6% market share Global premiumization, skincare-fragrance hybrids
Soaps and Detergents USD 1.17 Billion Scented laundry and home-care innovation
Fine Fragrances 5.52% CAGR (2026–2035) Niche-brand proliferation, artisanal perfumery
Household Products USD 0.53 Billion Air-care and malodor-counteractant demand
Food and Beverage 4.55% CAGR (2026–2035) Natural-identical flavoring regulations
Other Applications USD 0.24 Billion Industrial masking agents, aromatherapy


Cosmetics and toiletries consume the largest share of the Aromatic Market, driven by the integration of fragrance into skincare, haircare, and color-cosmetics formulations. Premiumization across all price tiers — from mass-market body washes to prestige serums — sustains demand for differentiated scent profiles and high-purity ingredients.

Fine fragrances post the fastest application-segment growth in the Aromatic Market. The explosion of indie and niche perfumery brands has expanded shelf space and consumer choice, with over 2,000 new fragrance launches recorded globally in 2024 alone . These brands favor distinctive, sometimes unconventional aroma compounds that command higher per-kilogram pricing than commodity grades.


Regional Market Share Analysis

Region Key Metric (2025) Primary Investment Themes
Asia-Pacific 41.5% market share Capacity expansion, PLI incentives, prestige fragrance adoption
North America 23.0% market share Clean-label reformulation, bio-based procurement mandates
Europe 22.0% market share REACH compliance, artisanal perfumery and sustainability standards
South America USD 0.42 Billion Citrus-waste valorization, domestic F&F capacity building
Middle East & Africa 5.52% CAGR (2026–2035) Premium fragrance demand, halal-certified ingredients
Total USD 5.22 Billion

The Aromatic Market exhibits a concentrated geographic footprint, with three regions — Asia-Pacific, North America, and Europe — collectively representing over 86% of 2025 revenue. Regional dynamics reflect local regulatory environments, consumer purchasing power, and manufacturing infrastructure maturity.


North America

Country Key Metric Key Driver
US 68% of regional share TSCA modernization, DTC fragrance brands
Canada 4.65% CAGR Clean-beauty regulation alignment with the EU
Mexico USD 0.11 Billion Contract manufacturing for personal care


North America's (holding 68%) Aromatic Market benefits from a mature consumer-products ecosystem and proactive regulatory modernization. The US EPA's ongoing TSCA risk evaluations are prompting reformulation away from legacy benzenoids, while California's Proposition 65 updates maintain pressure on ingredient transparency. Canada’s (CAGR of 4.65%) alignment with EU allergen-disclosure standards creates a harmonized regulatory corridor that simplifies cross-border trade for compliant producers.

Europe

Country Key Metric Key Driver
Germany 4.80% CAGR Industrial flavoring and specialty-chemicals cluster
UK USD 0.17 Billion Post-Brexit UK REACH divergence
France 26% of regional share Grasse perfumery ecosystem, luxury brands
Italy USD 0.11 Billion Cosmetics and personal-care manufacturing
Spain 3.95% CAGR Citrus-derived terpene exports
Nordic Countries USD 0.06 Billion Sustainability-first consumer preferences
Russia 3.60% CAGR Import substitution in fragrance compounds
Rest of Europe USD 0.12 Billion Contract manufacturing hubs in Poland, Czechia


Europe's position in the Aromatic Market is anchored by France's Grasse region — the historical heart of global perfumery — and Germany's (CAGR of 4.8%) integrated chemical-manufacturing infrastructure. The European Green Deal's Chemicals Strategy for Sustainability is accelerating the adoption of bio-based alternatives. At the same time, ECHA's expanded allergen-restriction proposals create both compliance costs and competitive moats for technologically advanced producers [7].

Asia-Pacific

Country Key Metric Key Driver
China 38% of regional share Prestige fragrance boom, domestic production scale
India 6.85% CAGR PLI scheme for specialty chemicals
Japan USD 0.24 Billion Advanced synthetic-musk R&D
South Korea 5.90% CAGR K-beauty ingredient innovation
ASEAN USD 0.19 Billion Emerging personal-care consumption
Rest of Asia-Pacific 4.70% CAGR Australia, Taiwan, ingredient processing


Asia-Pacific dominates the Aromatic Market with the largest share and the fastest growth trajectory. China holds 38% of the APAC market share. However, its per-capita fragrance spending has roughly tripled since 2018, yet it remains well below Western levels, indicating continued expansion potential. India's PLI-backed specialty-chemicals investments are creating new manufacturing capacity for terpene and musk intermediates, reducing the region's historical dependence on European imports [8].

South America

Country Key Metric Key Driver
Brazil 62% of regional share Citrus-byproduct supply, large personal-care market
Argentina USD 0.07 Billion Essential oil distillation for export
Rest of South America 4.25% CAGR Growing domestic cosmetics demand


Brazil's position as the world's largest orange-juice producer, holding 62 % of the market share, gives it a structural advantage in citrus-derived terpene production. The country's personal-care sector — the fourth largest globally — provides a robust domestic demand base for the Aromatic Market, while Argentinian lemon-oil exports serve European and North American customers.

Middle East & Africa

Country Key Metric Key Driver
Saudi Arabia 5.80% CAGR Vision 2030 diversification, oud-based perfumery
UAE 34% of the regional share Luxury fragrance hub, re-export trade
South Africa USD 0.03 Billion Regional manufacturing gateway
Egypt 4.90% CAGR Essential oil distillation (jasmine, geranium)
Rest of MEA USD 0.04 Billion Nascent personal-care demand


The Middle East's deep cultural affinity for perfumery drives premium-tier consumption that outpaces most global markets on a per-capita basis. Saudi Arabia's Vision 2030 economic diversification program includes explicit support for downstream chemical manufacturing, creating new Aromatic Market capacity in the region. Africa's contribution remains modest but is growing as urbanization expands access to branded personal-care products.


Aromatics Market By Region, 2025-2035

Competitive Benchmarking

The Aromatic Market exhibits medium concentration, with the top five players holding an estimated 35–42% of global revenue. The Herfindahl-Hirschman Index (HHI) falls in the moderate range (~800–1,200), reflecting a mix of integrated multinationals and specialized regional producers. Competition centers on molecule breadth, regulatory compliance capability, sustainability credentials, and R&D pipeline depth.

Company Est. Revenue Share Range Key Offerings for the Aromatic Market Strategic Positioning
Givaudan ~8–11% Terpenes, musks, proprietary captive molecules Vertically integrated, AI-enabled scent design
dsm-firmenich ~7–10% Nature-identical ingredients, biotechnology platforms Merger-driven scale, sustainability leadership
Symrise AG ~6–9% Menthol, vanillin, specialty musks Code of conduct-driven responsible sourcing
IFF ~5–8% Benzenoids, citral derivatives and encapsulation Broad portfolio post-DuPont N&B acquisition
BASF SE ~4–7% Citral chain, geraniol, linalool Backward-integrated petrochemical platform
Kao Corporation ~3–5% Aroma compounds for personal care, surfactants Asia-Pacific distribution strength
Takasago International ~3–5% L-menthol, musks, green-chemistry R&D Japan-headquartered with global reach
Mane SA ~2–4% Natural extracts, captive molecules Family-owned, Grasse heritage
Robertet Group ~2–4% Natural raw materials, essential oils Vertically integrated botanical supply chain
Privi Speciality Chemicals ~2–3% Macrocyclic musks, aroma chemicals, intermediates Cost-competitive Indian manufacturing base


Recent News & Developments


  • BASF (June, 2026)—Launched Micadelva™, a non-allergenic, renewable citrus fragrance ingredient, alongside a new "Safe-by-Design" innovation framework for future-proof fragrance development.
  • Givaudan (July, 2026)—Announced a strategic collaboration and equity investment in Microcaps AG to scale precision microencapsulation technology for high-performance, non-alcoholic fine fragrances.
  • dsm-firmenich (January 2026)—Named "Frosted Star Anise" as its 2026 Flavor of the Year, leveraging its proprietary Freezestorm™ technology to deliver multidimensional cooling and aromatic sensations.


Aromatics Market Report Scope

Parameter Details
Market Scope Global Aromatic Market covering production, trade, and consumption of aroma chemicals.
Study Period 2021–2035
CAGR 4.90% (2026–2035)
Market Size (2025) USD 5.22 Billion
Market Size (2035) USD 8.39 Billion
Fastest Growing Segment Musk Chemicals (by type); Fine Fragrances (by application); Asia-Pacific (by region)
Companies Profiled Givaudan, dsm-firmenich, Symrise AG, IFF, BASF SE, Kao Corporation, Takasago International, Mane SA, Robertet Group, Privi Speciality Chemicals
Valuation Currency USD Billion


FAQs

How do allergen regulations affect ingredient-selection strategies for fragrance buyers?
ECHA's expanding allergen restrictions force buyers to pre-screen formulations against evolving restricted-substance lists before procurement. Sourcing from producers with built-in regulatory intelligence platforms reduces reformulation risk and speeds compliance [7].
What are the key due diligence factors when evaluating an aroma-chemical supplier?
Prioritize GMP certification, IFRA compliance, traceability from raw material to finished grade, and documented Scope 3 carbon data. Suppliers offering in-house analytical verification of purity typically deliver fewer batch rejections [15].
How does fermentation-based production change pricing dynamics for terpenes?
Fermentation decouples terpene pricing from crude-oil and citrus crop volatility, offering more stable long-term contracts. Buyers can negotiate fixed-price agreements that were impractical under petrochemical supply models [2].
What role does AI play in accelerating fragrance-development timelines?
AI-driven platforms screen thousands of candidate molecules against olfactory-receptor models in hours, cutting development cycles by up to 40%. Early adopters gain first-mover access to novel scent profiles before competitors [17].
How should buyers assess the biodegradability credentials of musk chemicals?
Request OECD 301/302 test data and verify that the supplier's musk variants are macrocyclic or alicyclic, not legacy nitro-musk or polycyclic structures. Third-party eco-toxicity certifications add procurement confidence [15].
What supply-chain risks should procurement teams monitor in the Aromatic Market?
Single-source dependency on Chinese menthol and Indian terpene intermediates poses concentration risk. Dual-sourcing strategies and safety-stock buffers of 8–12 weeks mitigate disruption exposure [16].
Are there emerging applications beyond traditional fragrance and flavor end uses?
Terpene-based solvents are gaining traction in industrial cleaning and agricultural adjuvant formulations as low-VOC alternatives. These adjacent applications could represent 5–7% of total Aromatic Market demand by 2030 [18].    
Author
Author
Author Profile
Chitranshi Jaiswal LinkedIn
Team Lead - Research
Chitranshi is a Team Leader in the Chemicals & Materials (CnM) and Energy & Power (EnP) domains, with 6+ years of experience in market research. She leads and mentors teams to deliver cross-domain projects that equip clients with actionable insights and growth strategies. She is skilled in market estimation, forecasting, competitive benchmarking, and both primary & secondary research, enabling her to turn complex data into decision-ready insights. An engineer and MBA professional, she combines technical expertise with strategic acumen to solve dynamic market challenges. Chitranshi has successfully managed projects that support market entry, investment planning, and competitive positioning, while building strong client relationships. Certified in Advanced Excel & Power BI she leverages data-driven approaches to ensure accuracy, clarity, and impactful outcomes.

Research Approach


Secondary Research

The secondary research process involved comprehensive analysis of regulatory databases, peer-reviewed chemical engineering journals, industry publications, and authoritative chemical industry organizations. Key sources included the US Environmental Protection Agency (EPA), European Chemicals Agency (ECHA), International Fragrance Association (IFRA), Research Institute for Fragrance Materials (RIFM), International Council of Chemical Associations (ICCA), American Chemistry Council (ACC), European Chemical Industry Council (Cefic), China Petroleum and Chemical Industry Federation (CPCIF), International Energy Agency (IEA), US Energy Information Administration (EIA), Organization of the Petroleum Exporting Countries (OPEC), International Monetary Fund (IMF) Commodity Price Database, World Bank Commodity Markets, UN Comtrade Database, US Census Bureau Chemical Industry Data, Eurostat Chemicals Production Statistics, and national chemical ministry reports from key markets including China, India, Japan, South Korea, Germany, and the United States. These sources were used to collect production capacity data, regulatory compliance frameworks, safety and toxicity studies, feedstock price trends, trade flow analysis, and market landscape assessment for benzene, toluene, p-xylene, o-xylene, and other aromatic compounds across additive and solvent applications.


Primary Research

Primary research validated market segmentation, confirmed capacity expansion timelines, and gathered insights on feedstock sourcing strategies, pricing dynamics, sustainability transition pathways, and substitution trends by interviewing supply-side and demand-side stakeholders. Supply-side sources included CEOs, VPs of Manufacturing & Operations, regulatory affairs heads, and commercial directors from aromatic compound manufacturers, petrochemical refiners, and fragrance & flavor houses. CEOs, VPs of Manufacturing & Operations, heads of regulatory affairs, and commercial directors from producers of aromatic compounds, petrochemical refiners, and fragrance and flavor houses were examples of supply-side sources. Procurement heads from paint and coatings formulators, adhesive producers, pharmaceutical R&D directors, chemical process engineers, and sourcing managers from specialty chemical distributors and industrial end users were examples of demand-side sources. Market segmentation, capacity growth schedules, feedstock sourcing tactics, pricing dynamics, sustainability transition paths, and substitute patterns were all confirmed by primary research.

Primary Respondent Breakdown:

By Designation: C-level Primaries (32%), Director Level (30%), Others (38%)

By Region: North America (32%), Europe (30%), Asia-Pacific (28%), Rest of World (10%)


Market Size Estimation

Global market valuation was derived through production volume analysis and revenue mapping. The methodology included:

Identification of 50+ key manufacturers across North America, Europe, Asia-Pacific, Middle East, and Latin America

Product mapping across benzene, toluene, p-xylene, o-xylene, and other aromatic compound categories

Analysis of reported and modeled annual revenues specific to aromatic compound portfolios

Coverage of manufacturers representing 70–75% of global market share in 2024

Extrapolation using bottom-up (production volume × ASP by country/region) and top-down (manufacturer revenue validation) approaches to derive segment-specific valuations for additive and solvent applications across paint & coatings, adhesives, pharmaceuticals, chemicals, and other end-use industries

Download Free Sample

Kindly complete the form below to receive a free sample of this Report

Download PDF ×

We do not share your information with anyone. However, we may send you emails based on your report interest from time to time. You may contact us at any time to opt-out.

















