Asia Pacific Logistics Market (2025 - 2035)

Asia Pacific Logistics Market Research Report Information By Logistics Function (Freight Transport, Courier, Express, and Parcel (CEP), Freight Forwarding, Warehousing and Storage, and Other Services), By End-User Industry (Manufacturing, Wholesale and Retail Trade, Agriculture, Fishing, and Forestry, Construction, and Other Industries), By Freight Transport Mode (Road Freight Transport, Sea and Inland Waterway, Rail Freight, Air Freight, and Pipeline), and By Freight Forwarding Mode (Sea and Inland Waterway Freight Forwarding, Air Freight Forwarding, and Land Freight Forwarding) – Forecast Till 2035
ID: MRFR/PCM/19916-HCR
128 Pages
Snehal Singh
Last Updated: July 28, 2026
Asia Pacific Logistics Market
Market Size
Forecast Period2025-2035
CAGR (2025-2035)6.8%
2025 Market SizeUSD 2,889.16 Billion
2035 Market SizeUSD 5,581.00 Billion
Key Players
DHL Supply Chain & Global Forwarding
Kuehne+Nagel
Nippon Express Holdings
SF Express
Sinotrans Limited
Kerry Logistics Network
Opportunities
  • Cold-Chain Expansion in Emerging Economies
  • Digital Freight Matching and Data Monetization
  • Green Logistics and Carbon Accounting Services

Asia Pacific Logistics Market Summary

The Asia Pacific Logistics Market reached an estimated USD 2,889.16 billion in 2025 and is projected to climb from USD 3,085.62 billion in 2026 to USD 5,581.00 billion by 2035, registering a CAGR of 6.8% across the forecast window. Two structural forces anchor this trajectory: the ongoing re-routing of global manufacturing into Southeast Asian corridors — a shift that has intensified since 2022 — and a wave of public-sector infrastructure megaprojects, from India's Bharatmala highway program to China's western rail expansions, that are unlocking latent capacity across road, port, and intermodal networks [1][2].

Asia Pacific Logistics Market is witnessing a technology shift in the way commodities flow. AI-powered demand forecasting, real-time shipment visibility platforms and robotic sortation systems are replacing legacy paper-based customs clearing and human warehousing procedures. The Asian Development Bank [3] projects that reforms in digital trade facilitation alone could cut transaction costs across ASEAN nations by 12–15% by 2030. Meanwhile, autonomous trucking trials in China and Japan are reducing line-haul cycle times by up to 18% in high-density corridors [4].

China accounts for over 42% of the Asia Pacific Logistics Market and has the world’s largest expressway network and port system handling more than 300 million TEUs a year. India is the fastest-growing economy, growing at an 8.2% CAGR through 2035, with the National Logistics Policy reducing logistics costs from 14% to a targeted 9% of GDP [5]. Japan is the second largest, providing about 18% of sales in the area. The Asia Pacific Logistics Market is set for a decade of consistent tech-enabled growth, driven by tightening decarbonization standards and increasing e-commerce penetration.


Key Report Takeaways

• By Logistics Function

  • Freight Transport held a 55.9% share of the Asia Pacific Logistics Market in 2025, reflecting dominant road and maritime volumes across the region.
  • Courier, Express, and Parcel (CEP) services are advancing at a 7.3% CAGR between 2026 and 2035, driven by cross-border e-commerce acceleration.

• By End User Industry

  • Manufacturing captured 33.6% of the Asia Pacific Logistics Market value in 2025, propelled by China's and Vietnam's export-oriented factory base.
  • Wholesale and Retail Trade is set to record the fastest growth at a 7.1% CAGR through 2035 as omnichannel fulfillment strategies expand.

• By Region

  • China accounted for approximately 42% of regional revenue in 2025, anchored by integrated express networks and port throughput leadership.
  • India is the quickest-expanding country in the Asia Pacific Logistics Market, posting an 8.2% CAGR as infrastructure modernization scales.
  • Japan contributed roughly 18% of revenue in 2025, supported by high-density urban distribution networks and cold-chain sophistication.


Asia Pacific Logistics Market Size and Forecast (2021–2035)

Market Research Future's sizing model triangulates bottom-up revenue data from national statistical offices, company filings, trade association surveys, and proprietary primary interviews with logistics operators across 12 Asia-Pacific economies. Historical figures (2021–2025) are reconciled against customs trade data and reported earnings; forecast figures (2026–2035) apply segment-level growth assumptions validated through Delphi panels and econometric correlation with GDP, industrial output, and e-commerce GMV indices[7].
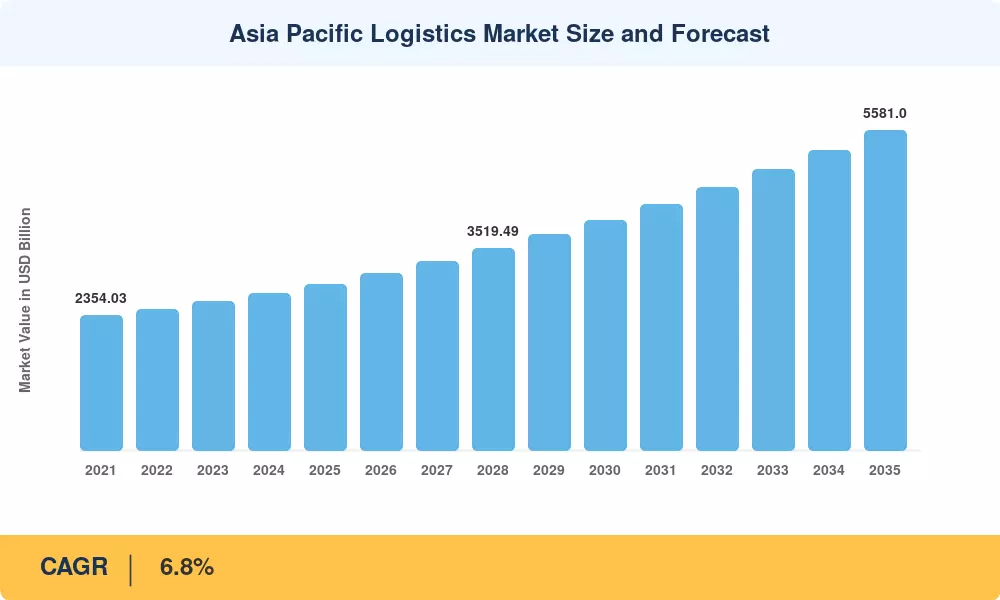
Asia Pacific Logistics Market Size and Forecast
Our Impact
Enabled $4.3B Revenue Impact for Fortune 500 and Leading Multinationals
Partnering with 2000+ Global Organizations Each Year
30K+ Citations by Top-Tier Firms in the Industry

Driver Impact Analysis

Driver ~% Impact on CAGR Geographic Relevance Impact Timeline
E-commerce and D2C fulfillment expansion ~1.8% Region-wide Short-term (≤2 yr)
Infrastructure megaprojects (ports, expressways, rail) ~1.5% China, India, Indonesia Long-term (≥4 yr)
RCEP and bilateral trade liberalization ~0.9% ASEAN, China, Japan, South Korea Medium-term (2–4 yr)
Manufacturing relocation into Southeast Asia ~0.8% Vietnam, Thailand, Indonesia Medium-term (2–4 yr)
Digital freight platforms and visibility tech ~0.7% Japan, China, Australia Medium-term (2–4 yr)
Cold-chain and pharma logistics demand ~0.6% India, ASEAN Long-term (≥4 yr)
Urbanization and last-mile complexity ~0.5% India, Philippines, Indonesia Long-term (≥4 yr)


E-Commerce and Direct-to-Consumer Fulfillment

Cross-border e-commerce GMV in Asia-Pacific surpassed USD 820 billion in 2024, with platforms such as Shopee, Lazada, and Temu accelerating parcel volumes at double-digit rates [10]. This surge has compressed delivery expectations — 68% of surveyed consumers in China and 54% in India now expect same- or next-day delivery — forcing operators in the Asia Pacific Logistics Market to densify micro-fulfillment centers within 30 km of urban cores. The ripple effects extend to sortation automation, where investment in robotic parcel-handling systems rose 27% year-over-year across the region in 2024 [15].

Infrastructure Megaprojects

India's Bharatmala Pariyojana program has sanctioned over 34,000 km of highway construction at an outlay exceeding USD 65 billion, while Indonesia's Nusantara capital relocation is catalyzing port and logistics park development across East Kalimantan [1][2]. China's "New Western Land-Sea Corridor" integrates Chongqing's inland production zones with Beibu Gulf ports, trimming transit times to ASEAN by three days. Each project expands addressable freight lanes and draws private-sector co-investment into adjacent warehousing and intermodal nodes, supporting long-term volume growth in the Asia Pacific Logistics Market.

RCEP Trade Liberalization

The Regional Comprehensive Economic Partnership binds 15 economies accounting for roughly 30% of global GDP under a unified rules-of-origin framework [9]. Cumulative tariff reductions — covering over 90% of traded goods by 2030 — are restructuring sourcing patterns and boosting intra-Asian merchandise trade. For the Asia Pacific Logistics Market, the practical outcome is denser route networks, increased LCL and groupage demand, and stronger utilization of bonded warehousing facilities near free-trade zones.


Restraints Impact Analysis

The restraint percentages below are directional estimates of headwind magnitude and are not directly subtracted from the headline CAGR. They reflect expert-panel assessments of factors that could dampen growth relative to an unconstrained scenario.

Restraint ~% Drag on CAGR Geographic Relevance Impact Timeline
Fragmented regulatory and customs regimes ~−0.6% ASEAN, South Asia Long-term (≥4 yr)
Driver and warehouse labor shortages ~−0.5% Japan, South Korea, Australia Short-term (≤2 yr)
Fuel price and energy cost volatility ~−0.4% Region-wide Short-term (≤2 yr)
Geopolitical tensions and trade policy uncertainty ~−0.4% China, Taiwan Strait corridor Medium-term (2–4 yr)
Climate-related disruption to infrastructure ~−0.3% South/Southeast Asia Long-term (≥4 yr)


Fragmented Regulatory and Customs Regimes

Despite RCEP's harmonizing ambition, significant customs documentation variances persist among ASEAN member states — transit times at the Thai-Myanmar border still average 38 hours compared to 4 hours at Singapore-Malaysia crossings [16]. Inconsistent cabotage rules restrict foreign carriers in Indonesia and the Philippines, limiting competitive pricing and network optimization. These frictions raise compliance costs and discourage smaller operators from expanding cross-border service offerings within the Asia Pacific Logistics Market.

Labor Shortages in Mature Economies

Japan faces a projected shortfall of 240,000 truck drivers by 2030 under its "2024 Problem" reforms capping overtime hours [17]. South Korea and Australia confront parallel pressures, with warehouse vacancy rates for trained material handlers exceeding 12% in key metropolitan clusters. While automation partially offsets these gaps, the upfront capital intensity of robotic systems creates adoption barriers for the mid-tier operators that collectively handle a large share of the Asia Pacific Logistics Market's domestic volumes.

Fuel Price Volatility

Diesel and bunker fuel constitute 25–35% of operating costs for road and ocean carriers across the region [18]. Crude-price swings — exacerbated by OPEC+ production decisions and geopolitical supply risks — compress operator margins and inject uncertainty into contract rate negotiations, slowing capacity commitment cycles in the Asia Pacific Logistics Market.


Asia Pacific Logistics Market Opportunities

Cold-Chain Expansion in Emerging Economies

India's cold-storage capacity covers less than 4% of perishable output, and Southeast Asian nations face similar gaps [12]. Government incentive programs — including India's Pradhan Mantri Kisan Sampada Yojana — are channeling subsidized capital into refrigerated warehousing and reefer fleet expansion. Operators that establish early cold-chain networks in tier-2 and tier-3 cities stand to capture premium pricing and long-term contract tenures within the Asia Pacific Logistics Market.

Digital Freight Matching and Data Monetization

Empty-truck ratios still exceed 35% on key corridors in India and Indonesia [13]. Digital freight exchanges — connecting shippers and carriers via algorithm-driven load matching — reduce deadhead miles and generate rich data on lane pricing, demand seasonality, and carrier performance. Platforms that aggregate these data sets can monetize predictive analytics as a SaaS offering, creating a recurring-revenue overlay to traditional brokerage within the Asia Pacific Logistics Market.

Green Logistics and Carbon Accounting Services

The IMO's 2027 carbon-intensity indicator targets and China's national emissions trading scheme are compelling shippers to quantify and reduce Scope 3 emissions [11]. Operators offering certified carbon-footprint reporting, multimodal shift optimization, and electric-vehicle last-mile delivery can command 8–12% rate premiums over conventional alternatives, opening a differentiated service tier in the Asia Pacific Logistics Market.

Cross-Border E-Commerce Fulfillment Hubs

Bonded warehouse zones in Malaysia (Digital Free Trade Zone), Thailand (EEC), and South Korea (Incheon FTZ) enable duty-deferred inventory positioning for e-commerce sellers [10]. Operators that integrate customs brokerage, returns processing, and same-day dispatch from these hubs can capture high-margin, high-velocity parcel flows across the Asia Pacific Logistics Market.

Autonomous and Semi-Autonomous Fleet Deployment

China has licensed autonomous truck testing on over 3,200 km of expressway, and Japan's SIP-adus program targets Level 4 platooning on the Shin-Tomei Expressway by 2027 [4]. Early movers investing in perception-stack integration and mixed-fleet orchestration software will lower per-km operating costs by an estimated 22% on trunk routes, reshaping competitive economics in the Asia Pacific Logistics Market.


Asia Pacific Logistics Market Future Outlook

AI-Driven Orchestration and Predictive Logistics

By 2030, generative AI and large language models will move beyond demand forecasting into real-time shipment re-routing, dynamic pricing, and autonomous exception management. estimates that AI-enabled planning can reduce logistics costs by 15–20% for early adopters [21]. In the Asia Pacific Logistics Market, Chinese and Japanese integrators are already piloting AI dispatch engines that reallocate thousands of parcels per minute based on weather, traffic, and labor availability signals.

Electrification and Alternative Fuels

China deployed over 250,000 electric light-commercial vehicles in 2024, and India's FAME III subsidy framework targets 50,000 electric trucks by 2030 [11]. LNG bunkering infrastructure is expanding across Singapore, Busan, and Shanghai to serve IMO-compliant ocean carriers. Operators in the Asia Pacific Logistics Market that lock in early fleet-transition roadmaps will capture green-premium contracts and hedge against tightening emission-penalty regimes across the forecast horizon.

Platform Economics and Ecosystem Consolidation

Digital freight brokerages, warehouse-as-a-service platforms, and integrated visibility solutions are collapsing traditionally fragmented value chains. The top five digital freight platforms in China processed over USD 90 billion in transaction value in 2024, up 34% year-over-year [13]. Expect further M&A-driven consolidation in the Asia Pacific Logistics Market as venture-backed platforms seek scale, and incumbent integrators acquire tech capabilities to defend margin.

ESG Reporting and Sustainable Supply-Chain Mandates

The EU's Carbon Border Adjustment Mechanism — effective from 2026 — will require Asia-Pacific exporters to document embedded emissions, cascading Scope 3 reporting obligations upstream through the Asia Pacific Logistics Market. Japan's GX Green Transformation program and South Korea's K-ESG guidelines reinforce this direction domestically [11]. Logistics providers offering verified carbon accounting, multimodal optimization, and renewable-energy-powered warehouses will differentiate in contract tenders.


Asia Pacific Logistics Market Segmentation

By Logistics Function

Segment Key Metric Primary Demand Driver
Freight Transport 55.9% share (2025) Road and maritime volume dominance
Courier, Express, and Parcel (CEP) 7.3% CAGR (2026–2035) E-commerce parcel acceleration
Freight Forwarding USD 412 Billion (2025) Intra-Asian trade complexity
Warehousing and Storage 6.5% CAGR (2026–2035) Inventory buffer and cold-chain needs
Other Services USD 89 Billion (2025) Value-added logistics and customs brokerage


Freight Transport remains the backbone of the Asia Pacific Logistics Market, with road freight alone representing roughly 59% of modal volume in 2025. High truck dependency across India, Indonesia, and China — where rail modal share lags European benchmarks — ensures that road carriers continue to capture the largest revenue pool, even as modal-shift policies gradually redirect bulk commodities toward rail and coastal shipping.

CEP is the standout growth segment, propelled by cross-border parcel volumes that are doubling every four years in Southeast Asia. Domestic CEP held approximately 60.3% of segment revenue in 2025. However, international CEP is expanding more rapidly at a 7.5% CAGR as cross-border e-commerce marketplaces build out fulfillment hubs in bonded zones. The Asia Pacific Logistics Market will increasingly see CEP operators investing in sortation automation and drone-delivery pilots to handle parcel-density surges.

By End User Industry

Segment Key Metric Primary Demand Driver
Manufacturing 33.6% share (2025) Export-oriented factory output
Wholesale and Retail Trade 7.1% CAGR (2026–2035) Omnichannel fulfillment
Agriculture, Fishing, and Forestry USD 237 Billion (2025) Perishable and bulk commodity flows
Construction 5.8% CAGR (2026–2035) Infrastructure megaproject procurement
Other Industries USD 198 Billion (2025) Oil & gas, mining, pharma


Manufacturing's commanding share reflects the region's role as the world's factory floor. China, Vietnam, and India collectively exported over USD 4.5 trillion in manufactured goods in 2024, generating massive outbound container demand [2]. Within the Asia Pacific Logistics Market, automotive, electronics, and textile supply chains drive the highest logistics-intensity ratios, requiring just-in-time inbound flows and bonded re-export handling.

Wholesale and Retail Trade is outpacing manufacturing growth as direct-to-consumer and quick-commerce models compress order-to-delivery windows. Grocery delivery platforms in India and Indonesia are building dark-store networks that demand 10-minute replenishment cycles, a fulfillment paradigm reshaping last-mile network design across the Asia Pacific Logistics Market.

By Freight Transport Mode

Mode Key Metric Primary Demand Driver
Road Freight Transport 59.0% share (2025) Capillary reach, first/last-mile dominance
Sea and Inland Waterway USD 578 Billion (2025) Bulk and container trade
Rail Freight 6.8% CAGR (2026–2035) Dedicated freight corridor investments
Air Freight 7.4% CAGR (2026–2035) High-value and time-sensitive cargo
Pipeline USD 42 Billion (2025) Petrochemical and gas transport


Road freight's dominance across the Asia Pacific Logistics Market reflects the geographic and economic realities of the region: archipelagic nations such as Indonesia depend on trucking for inter-island feeder connectivity. At the same time, India's rail modal share for non-bulk cargo remains below 5%. Air freight is the fastest-expanding mode, growing at a 7.4% CAGR as semiconductor, pharmaceutical, and perishable shipments prioritize speed and reliability over cost.

By Freight Forwarding Mode

Mode Key Metric Primary Demand Driver
Sea and Inland Waterway Freight Forwarding 60.4% share (2025) Containerized trade volumes
Air Freight Forwarding 7.0% CAGR (2026–2035) E-commerce and pharma time-sensitivity
Land Freight Forwarding USD 126 Billion (2025) Cross-border trucking and rail


Sea and inland waterway forwarding commands the largest share of the Asia Pacific Logistics Market forwarding segment, a function of the region's 18,000+ km of navigable inland waterways and its dominance in global container throughput. Air freight forwarding, while smaller in absolute terms, is growing rapidly as cross-border e-commerce parcels — particularly from China to Southeast Asia and the Middle East — increasingly move through dedicated freighter capacity rather than bellyhold.


Regional Market Share Analysis

Country / Sub-Region Key Metric Primary Investment Themes
China ~42% share (2025) Express network density, port automation, autonomous trucking
Japan ~18% share (2025) Labor-saving automation, cold-chain sophistication, modal shift
India 8.2% CAGR (2026–2035) Highway buildout, multimodal corridors, digital freight exchange
ASEAN USD 463 Billion (2025) FDI-driven manufacturing logistics, cross-border e-commerce hubs
Rest of Asia-Pacific 5.9% CAGR (2026–2035) Port modernization, LNG bunkering, EV last-mile fleets
**Total** **USD 2,889.16 Billion (2025)**

The Asia Pacific Logistics Market spans a wide spectrum of economic maturity, infrastructure density, and regulatory frameworks. China and Japan together account for roughly 60% of regional revenue. Yet, the fastest growth pockets sit in South and Southeast Asia where industrialization, urbanization, and digital adoption are accelerating freight intensity.


China

Province / Metric Key Metric Key Driver
Eastern seaboard clusters ~58% of China's logistics GDP Manufacturing export density [1]
Western inland corridors 9.1% CAGR (2026–2035) Belt & Road feeder development [2]
Cross-border e-commerce zones USD 48 Billion (2025) Duty-deferred fulfillment models [10]


China's dominance in the Asia Pacific Logistics Market rests on unparalleled physical infrastructure — 177,000 km of expressway, the world's seven busiest container ports, and a high-speed rail network exceeding 45,000 km. The State Council's 14th Five-Year Modern Logistics Plan targets a 2 percentage-point reduction in logistics costs as a share of GDP by 2027, incentivizing consolidation among mid-tier carriers and investment in smart-warehouse automation [1].

India

State / Metric Key Metric Key Driver
Maharashtra–Gujarat industrial belt ~22% of India's freight volume Western Dedicated Freight Corridor [5]
National Logistics Policy impact 8.2% CAGR Cost-to-GDP ratio reduction target [5]
Cold-chain segment USD 18.7 Billion (2025) Pharma and agri-perishable demand [12]


India represents the single largest growth opportunity in the Asia Pacific Logistics Market. The Dedicated Freight Corridor — a 2,843 km dual-track rail spine — began commercial operations on its western segment in 2024, cutting Delhi-Mumbai rail transit from 60 hours to 14 hours and shifting an estimated 30 million tonnes of freight from road to rail annually [5]. PM GatiShakti's integrated planning portal coordinates 16 ministries around shared geospatial logistics data, reducing project duplication.

Japan

Segment / Metric Key Metric Key Driver
Domestic parcel volume 5.02 Billion units (2024) E-commerce and convenience-store pickup [17]
Temperature-controlled logistics ~24% of Japan's logistics revenue Aging population and meal-kit delivery [12]
Modal shift (truck-to-rail/coastal) 6.1% CAGR "2024 Problem" overtime regulations [17]


Japan's position in the Asia Pacific Logistics Market reflects high per-capita logistics spend and exceptional service-level expectations. The government's "Logistics Revolution" package, enacted in April 2024, mandates relay-transport models and incentivizes pallet standardization to mitigate the truck-driver shortage. Combined with aggressive robotic warehouse investment — Japan deployed over 18,000 logistics AMRs in 2024 — these measures sustain productivity growth despite demographic headwinds [17].

ASEAN

Country Key Metric Key Driver
Indonesia 7.6% CAGR (2026–2035) Nusantara capital relocation, archipelagic connectivity [2]
Vietnam USD 62 Billion (2025) FDI-driven electronics manufacturing [2]
Thailand ~28% of ASEAN logistics revenue Eastern Economic Corridor, automotive exports [9]
Malaysia 6.9% CAGR Digital Free Trade Zone, halal cold-chain [10]
Philippines USD 31 Billion (2025) BPO-linked express volumes, island logistics [14]


ASEAN's collective weight in the Asia Pacific Logistics Market continues to climb as manufacturing diversification accelerates. Vietnam's registered FDI crossed USD 36 billion in 2024, with Samsung, LG, and Apple supply chains localizing production. Thailand's Laem Chabang Phase 3 port expansion adds 3.5 million TEU capacity, while Indonesia's Trans-Java toll network is trimming Surabaya-Jakarta transit from 20 hours to 11 hours [2][14].

Rest of Asia-Pacific

Country Key Metric Key Driver
South Korea ~8% of regional revenue (2025) Semiconductor and EV battery exports [19]
Australia 5.4% CAGR (2026–2035) Mining logistics, east-coast intermodal rail [20]
New Zealand USD 12 Billion (2025) Agri-export cold-chain modernization [12]


South Korea's logistics ecosystem — tightly linked to semiconductor and battery supply chains — ensures steady high-value freight flows through Busan and Incheon. Australia's Inland Rail project, connecting Melbourne to Brisbane via a 1,700 km freight spine, is the largest land-transport infrastructure investment in the country's history and will reshape bulk and intermodal flows within the Asia Pacific Logistics Market upon completion in 2027 [20].


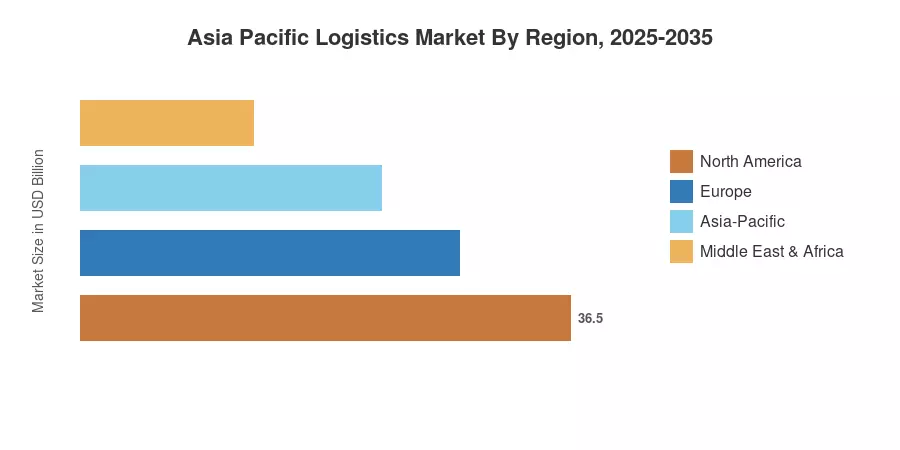
Asia Pacific Logistics Market By Region, 2025-2035

Competitive Benchmarking

The Asia Pacific Logistics Market exhibits low concentration, with an estimated Herfindahl-Hirschman Index below 350. The top five players collectively hold an estimated 18–22% revenue share, reflecting a deeply fragmented ecosystem where national champions, global integrators, and thousands of SME operators coexist. Competitive differentiation increasingly hinges on digital platform capabilities, last-mile density, and end-to-end visibility rather than pure asset scale.

Company Est. Revenue Share Range Key Offerings for Asia Pacific Logistics Market Strategic Positioning
DHL Supply Chain & Global Forwarding ~4–6% Contract logistics, ocean/air forwarding, e-commerce fulfillment Pan-regional integrator with strong ASEAN footprint
Kuehne+Nagel ~3–5% Sea freight, air logistics, overland/contract logistics Digital-first forwarding with KN FreightNet platform
Nippon Express Holdings ~3–4% Domestic/international freight, warehousing, heavy haulage Japan-anchored with expanding ASEAN network
SF Express (SF Holding) ~3–5% Express delivery, cold-chain, intra-Asia freight China's largest express carrier, Southeast Asia expansion
Sinotrans Limited ~2–4% Freight forwarding, shipping agency, e-commerce logistics State-backed scale across Chinese trade lanes
Kerry Logistics Network ~2–3% Integrated logistics, freight forwarding, e-commerce Asia-native with deep Greater China/ASEAN presence
CJ Logistics ~1–3% Contract logistics, express, global forwarding South Korea base with India and SEA growth corridors
Yamato Holdings ~2–3% TA-Q-BIN parcel delivery, corporate logistics, BIZ-Logistics Last-mile density leader in Japan
DB Schenker ~2–4% Land transport, air/ocean freight, contract logistics European integrator with pan-Asia network
Delhivery ~1–2% Express parcel, part truckload, cross-border India's largest independent logistics platform


Recent News & Developments


  • Goodfellow- (June, 2026 )--Goodman Group agreed to acquire Brickworks' industrial partnership interests in a transaction valued at A$2.65 billion to expand its Australian logistics footprint.
  • M&G Real Estate (July, 2026 )--M&G Real Estate and Stockland struck a $315 million logistics deal to acquire and manage prime industrial warehouse assets in Australia jointly.
  • ESR Group (April, 2026 )--ESR agreed to sell a portfolio of mature Chinese logistics assets to a newly formed investment vehicle to optimize capital allocation.


Asia Pacific Logistics Market Report Scope

Parameter Details
Market Scope Asia Pacific Logistics Market — freight transport, CEP, freight forwarding, warehousing, and allied services across Asia-Pacific economies
Study Period 2021–2035
Historical Period 2021–2024
Base Year 2025
Forecast Period 2026–2035
CAGR (2026–2035) 6.8%
Market Size (2025) USD 2,889.16 Billion
Market Size (2035) USD 5,581.00 Billion
Fastest Growing Segments CEP by function (7.3% CAGR); Air Freight by mode (7.4% CAGR); India by country (8.2% CAGR)
Companies Profiled DHL, Kuehne+Nagel, Nippon Express, SF Express, Sinotrans, Kerry Logistics, CJ Logistics, Yamato Holdings, DB Schenker, Delhivery
Valuation Currency USD Billion


FAQs

How does RCEP affect contract negotiation leverage for shippers operating across multiple Asia-Pacific countries?
RCEP's cumulative rules of origin let shippers consolidate sourcing across member states without losing tariff preferences, strengthening their leverage to negotiate volume-based rate discounts with carriers [9]. This shifts bargaining power toward large multi-origin shippers.
What role do free-trade zone warehouses play in reducing landed costs for cross-border e-commerce sellers?
Bonded warehouse hubs in Malaysia, South Korea, and Thailand allow sellers to pre-position inventory duty-free and dispatch after the order clears customs [10]. This cuts landed costs by 8–14% compared with origin-country shipping.
How are insurance and liability frameworks evolving for autonomous truck operations in the Asia Pacific Logistics Market?
China and Japan are piloting tiered liability models where the technology provider assumes fault during autonomous mode and the operator during manual override [4]. Insurers are developing usage-based policies priced on sensor-verified driving hours.
What integration challenges do mid-tier logistics firms face when adopting AI-based demand forecasting tools?
Legacy TMS and WMS platforms often lack API-ready architectures, requiring costly middleware. Data quality issues — incomplete shipment records and inconsistent SKU coding — further degrade model accuracy during the first 12–18 months of deployment [21].
How does India's goods and services tax (GST) regime affect warehouse network design within the Asia Pacific Logistics Market?
GST eliminated inter-state tax arbitrage, enabling firms to consolidate from 25–30 state-level depots into 4–6 regional hubs. This reduced inventory carrying costs by roughly 20% and improved order-to-delivery speed [5].
What procurement criteria should shippers prioritize when selecting temperature-controlled logistics providers in Southeast Asia?
Shippers should verify GDP-compliant cold-chain certifications, real-time temperature monitoring capability, and backup power redundancy across the provider's warehouse and fleet network [12]. Route-level SLA track records matter more than headline fleet size.
How are port-congestion surcharges influencing modal-shift decisions in the Asia Pacific Logistics Market?
Recurring congestion surcharges at hub ports such as Shanghai and Port Klang are pushing time-flexible shippers toward rail-sea intermodal alternatives. The cost premium for congestion-free routing ranges from 5–9% but offers 15–20% better schedule reliability [8].    
Author
Author
Author Profile
Snehal Singh LinkedIn
Manager - Research
High acumen in analyzing complex macro & micro markets with more than 6 years of work experience in the field of market research. By implementing her analytical skills in forecasting and estimation into market research reports, she has expertise in Packaging, Construction, and Equipment domains. She handles a team size of 20-25 resources and ensures smooth running of the projects, associated marketing activities, and client servicing.
Download Free Sample

Kindly complete the form below to receive a free sample of this Report

Download PDF ×

We do not share your information with anyone. However, we may send you emails based on your report interest from time to time. You may contact us at any time to opt-out.
















