• Cat-intel
  • MedIntelliX
  • Resources
  • About Us
  • Hero Background
    English
    Chinese
    French
    Japanese
    Korean
    German
    Spanish

    Asia Pacific Silica Sand Market Analysis

    ID: MRFR/CnM/11161-HCR
    128 Pages
    Anshula Mandaokar
    October 2025

    Asia Pacific Silica Sand Market Research Report Information By Grade (Glass, Foundry, and Chemical), By Process (Wet and Dry), By End-User Industry (Glass Manufacturing, Foundry, Chemical Production, Construction, Paints and Coatings, Ceramics and Refractories, Filtration, Oil and Gas Recovery, and Other End User Industries (Food Processing, Industrial Abrasives and Sports Fields)) – and Asia P...

    Share:
    Download PDF ×

    We do not share your information with anyone. However, we may send you emails based on your report interest from time to time. You may contact us at any time to opt-out.

    Asia Pacific Silica Sand Market Infographic
    $ 4,950.0
    $ 5,950.0
    $ 7,250.0

    Market Analysis

    In-depth Analysis of Asia Pacific Silica Sand Market Industry Landscape

    The Asia Pacific silica sand market is dynamic, driven by supply and demand dynamics. Glass, foundry, and construction industries use silica sand, which fluctuates in the region. Silica sand consumption is intimately tied to the construction industry, which drives Asia Pacific economic growth. As urbanization and infrastructure development increase in China, India, and Southeast Asia, construction activities require silica sand.

    Silica sand extraction and processing affect market dynamics. Australia, Malaysia, and Vietnam, with vast silica sand deposits, generally dominate the market. Environmental and sustainable mining issues are increasingly affecting market dynamics. The supply chain and market are affected by industry companies adopting responsible mining techniques due to regulations and community activities.

    The Asia Pacific silica sand market also depends on trade. Due to silica sand availability differences, the region has a lot of imports and exports. Export-oriented countries like Australia and Malaysia meet nearby silica sand needs. However, import-dependent economies like Japan and South Korea get their silica sand from outside sources. Trade agreements, geopolitics, and global economic conditions affect silica sand cross-border migration, changing market dynamics.

    Technology is transforming the Asia Pacific silica sand market. Silicon sand manufacturing is becoming more efficient due to extraction and processing innovations, affecting the supply chain and market. Automation, data analytics, and sustainable processing are growing due to the industry's focus on environmental effect and operating expenses. These technical advances affect production and modify the competitive landscape by favoring innovative enterprises.

    Silica sand's many industrial uses impact market dynamics. While building is a major consumer, electronics and solar are becoming key silica sand demand drivers. Electronic electronics and solar power technology boost silica sand applications. The diversification of end-use industries makes market dynamics more complicated since enterprises must adjust to shifting sector demands.

    Author
    Anshula Mandaokar
    Team Lead - Research

    Anshula Mandaokar holds an academic degree in Chemical Engineering and has been contributing to the field for more than 5 years. She has expertise in Market Research and Business Consulting and serves as a Team Lead for a reputed Market Research firm under the Chemicals and Materials domain spectrum. She has worked on multiple projects, generating explicit results in a quick turnaround time. Her understanding of data interpretation justifies her role as a leader.

    Leave a Comment

    FAQs

    How much is the silica sand market?

    The Asia Pacific Silica Sand market size was valued at USD 7.04 Billion in 2024.

    What is the growth rate of the silica sand market?

    Silica Sand Market is projected to register a CAGR of 6.13% from 2025-2035

    Who are the key players in the silica sand market?

    The key players in the market are Chongqing Changjiang River Moulding Material Group Co. Ltd (CCRMM), Hebei Shenghuo New Material Technology Co., Ltd., JFE Mineral & Alloy Company Ltd, Mangal Minerals, Mitsubishi Corporation, PUM Group, Petrazehra Berhad, Sibelco, TOCHU CORPORATION, Toyoura Keiseki Kogyo Co., Ltd, and VRX Silica Ltd.

    Which grade led the silica sand market?

    The glass category dominated the market in 2024.

    Which end-user industry had the largest market share in the silica sand market?

    The construction category had the largest share in the market.

    Market Summary

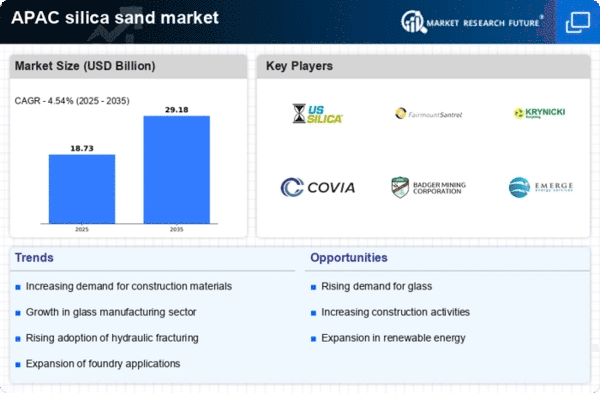
    As per MRFR analysis, the Asia Pacific Silica Sand Market Size was estimated at 7.041 USD Billion in 2024. The silica sand industry is projected to grow from 7.57 in 2025 to 15.6 by 2035, exhibiting a compound annual growth rate (CAGR) of 7.5 during the forecast period 2025 - 2035.

    Key Market Trends & Highlights

    The Asia Pacific Silica Sand Market is poised for robust growth driven by increasing demand across various sectors.

    • The construction sector is experiencing a surge in demand for silica sand, particularly in Asia-Pacific, which is the fastest-growing region.
    • Technological advancements in extraction methods are enhancing efficiency and sustainability in silica sand production.
    • The glass segment remains the largest consumer of silica sand, while the foundry segment is witnessing the fastest growth due to industrial expansion.
    • Key market drivers include rising urbanization and the growing demand for frac sand, which are significantly influencing market dynamics.

    Market Size & Forecast

    2024 Market Size 7.041 (USD Billion)
    2035 Market Size 15.6 (USD Billion)
    CAGR (2025 - 2035) 7.5%
    Largest Regional Market Share in 2024 Asia Pacific

    Major Players

    <p>Sibelco (SG), U.S. Silica Holdings (US), Toyota Tsusho Corporation (JP), CDE Global (GB), Mineral Technologies (AU), VRX Silica (AU), Bennett Mineral Company (AU), Mitsubishi Corporation (JP), Sands & Gravel (NZ)</p>

    Market Trends

    The Asia Pacific Silica Sand Market is currently experiencing a dynamic phase characterized by evolving demand and supply dynamics. The increasing utilization of silica sand in various industries, such as construction, glass manufacturing, and hydraulic fracturing, appears to be driving growth. Additionally, the region's expanding infrastructure projects and urbanization trends are likely to further bolster the market. As countries within Asia Pacific continue to develop, the need for high-quality silica sand is becoming more pronounced, suggesting a robust outlook for the industry. Furthermore, environmental regulations and sustainability concerns may influence production practices, potentially leading to innovations in extraction and processing methods. In the present landscape, the Asia Pacific Silica Sand Market seems to be navigating challenges related to resource availability and competition among suppliers. The ongoing emphasis on sustainable practices may prompt companies to adopt more eco-friendly approaches, which could reshape market dynamics. Moreover, the rise of alternative materials in certain applications might pose a threat to traditional silica sand usage. Nevertheless, the overall sentiment remains optimistic, as the market is poised to adapt to changing conditions and capitalize on emerging opportunities. Stakeholders are likely to focus on strategic partnerships and technological advancements to enhance their competitive edge in this evolving environment.

    Growing Demand in Construction Sector

    The construction industry is increasingly relying on silica sand for various applications, including concrete production and asphalt mixtures. This trend indicates a strong correlation between infrastructure development and silica sand consumption, suggesting that as urban areas expand, the demand for this material will continue to rise.

    Technological Advancements in Extraction

    Innovations in extraction and processing technologies are likely to enhance the efficiency and sustainability of silica sand production. These advancements may lead to reduced environmental impact and improved product quality, positioning companies favorably in a competitive market.

    Shift Towards Sustainable Practices

    There is a noticeable shift towards environmentally friendly practices within the Asia Pacific Silica Sand Market. Companies are increasingly adopting sustainable methods to meet regulatory requirements and consumer preferences, which may influence production strategies and market dynamics.

    Asia Pacific Silica Sand Market Market Drivers

    Increasing Urbanization

    The rapid urbanization across Asia Pacific is a pivotal driver for the Asia Pacific Silica Sand Market. As cities expand, the demand for construction materials, including silica sand, surges. Urban centers are witnessing a boom in infrastructure projects, which require substantial quantities of silica sand for concrete and glass manufacturing. For instance, countries like India and China are investing heavily in urban infrastructure, leading to an estimated growth rate of 6% in the construction sector. This trend indicates a robust demand for silica sand, as it is a fundamental component in various construction applications. The Asia Pacific Silica Sand Market is thus poised to benefit from this urban expansion, as the need for high-quality silica sand continues to rise.

    Rising Glass Manufacturing

    The glass manufacturing sector is experiencing significant growth, which is a crucial driver for the Asia Pacific Silica Sand Market. Silica sand is a primary raw material in glass production, and with the increasing demand for glass products in construction, automotive, and consumer goods, the market is expected to expand. In 2025, the glass industry in Asia Pacific is projected to grow at a CAGR of approximately 5%, further fueling the need for silica sand. This growth is particularly evident in countries like Japan and South Korea, where advanced glass technologies are being developed. Consequently, the Asia Pacific Silica Sand Market stands to gain from the rising glass manufacturing activities, as manufacturers seek high-purity silica sand to meet stringent quality standards.

    Growing Demand for Frac Sand

    The demand for frac sand in the oil and gas industry is significantly influencing the Asia Pacific Silica Sand Market. Frac sand is utilized in hydraulic fracturing processes to extract oil and natural gas, and with the increasing energy needs in the region, this market is poised for growth. Countries like Australia and Indonesia are investing in shale gas exploration, which is expected to drive the demand for high-quality silica sand. The Asia Pacific Silica Sand Market may see a surge in production and supply to meet the needs of the expanding energy sector. This trend indicates a promising future for silica sand producers as they cater to the evolving requirements of the energy industry.

    Expansion of Foundry Industry

    The foundry industry in Asia Pacific is undergoing substantial expansion, which serves as a significant driver for the Asia Pacific Silica Sand Market. Silica sand is essential in the production of molds and cores for metal casting, and the increasing demand for cast metal products is propelling this market. Countries such as China and India are leading in foundry production, with the industry projected to grow at a rate of 4% annually. This growth is attributed to the rising automotive and machinery sectors, which require high-quality castings. As a result, the Asia Pacific Silica Sand Market is likely to experience increased demand for silica sand, as foundries seek reliable sources of this critical material.

    Technological Innovations in Sand Processing

    Technological advancements in sand processing techniques are emerging as a vital driver for the Asia Pacific Silica Sand Market. Innovations such as advanced washing and sorting technologies enhance the quality and efficiency of silica sand production. These improvements not only increase yield but also reduce environmental impact, aligning with the growing emphasis on sustainable practices. The introduction of automated systems and AI-driven processes in sand extraction and processing is expected to boost productivity. As a result, the Asia Pacific Silica Sand Market may witness a shift towards more efficient production methods, catering to the rising demand for high-quality silica sand across various applications.

    Market Segment Insights

    By Grade: Glass (Largest) vs. Foundry (Fastest-Growing)

    <p>In the Asia Pacific Silica Sand Market, the 'Grade' segment demonstrates significant diversity, with glass-grade silica sand commanding the largest share due to its extensive utilization in construction and manufacturing industries. This category benefits from the rising demand for glass products, especially in the burgeoning construction and automotive sectors. In contrast, foundry-grade silica sand is experiencing rapid growth rates, fueled by the increasing demand from the foundry industry as it adapts to advanced manufacturing techniques and higher production requirements.</p>

    <p>Glass (Dominant) vs. Foundry (Emerging)</p>

    <p>Glass-grade silica sand remains the dominant player in the market, driven primarily by its high clarity and strength properties that are essential in various applications, including flat glass, container glass, and specialty glass products such as fiberglass. Conversely, foundry-grade silica sand is positioned as an emerging segment, especially in regions with a robust industrial base. Its unique characteristics that optimize molding and casting processes make it attractive to manufacturers who are focusing on quality and efficiency. Both segments showcase a strong alignment with industrial growth, catering to the expanding needs of end-user industries across Asia Pacific.</p>

    By Process: Wet (Largest) vs. Dry (Fastest-Growing)

    <p>In the Asia Pacific Silica Sand Market, the 'Wet' process segment leads in market share, driven primarily by increasing demand for high-purity silica in various industrial applications. As the largest segment, it benefits from its established position in industries such as glass manufacturing and electronics, ensuring a steady consumption pattern. Conversely, the 'Dry' process segment, while currently smaller, is experiencing rapid growth due to escalating demand for environmentally friendly production methods and advancements in processing technologies. This growing awareness is slowly shifting preferences towards dryer and cleaner processes that meet sustainability standards.</p>

    <p>Process: Wet (Dominant) vs. Dry (Emerging)</p>

    <p>The 'Wet' process segment is characterized by its efficiency in producing high-quality silica with superior purity levels, essential for industries like glass, ceramics, and chemical applications. Its dominance is supported by established production techniques and continuous investment in technology upgrades. On the other hand, the 'Dry' process is emerging as a competitive alternative, fueled by demand for lower energy consumption and reduced environmental impact. This segment focuses on producing silica sand with lower moisture content, making it ideal for application in construction and hydraulic fracturing. As industries evolve, innovations in the dry processing techniques are anticipated to enhance its market position.</p>

    By End-User Industry: Glass Manufacturing (Largest) vs. Foundry (Fastest-Growing)

    <p>In the Asia Pacific Silica Sand Market, the end-user industry segment reflects diverse applications that significantly contribute to market dynamics. Glass Manufacturing leads the segment with a substantial share, driven by increasing demand for both flat and container glass in various sectors, particularly construction and automotive. Foundry comes as the fastest-growing segment, owing to rising demand in advanced metal casting processes, further propelling the need for high-quality silica sand.</p>

    <p>Glass Manufacturing (Dominant) vs. Foundry (Emerging)</p>

    <p>Glass Manufacturing remains the dominant end-user in the Asia Pacific Silica Sand Market, largely due to heightened construction activities and rising consumer demand for glass products. This segment utilizes high-purity silica sand to ensure clarity and durability in glass production. On the other hand, Foundry is an emerging segment characterized by rapid growth driven by expanding industrialization and automotive manufacturing. Foundries are increasingly adopting silica sand for casting processes, ensuring excellent surface finish and dimensional accuracy, thus stimulating the silica sand market within this industry.</p>

    Get more detailed insights about Asia Pacific Silica Sand Market Research Report—Forecast till 2034

    Regional Insights

    North America : Established Market Leaders

    The North American silica sand market is driven by robust demand from the construction and glass manufacturing sectors. The U.S. holds the largest market share at approximately 60%, followed by Canada at around 25%. Regulatory support for infrastructure projects and increased construction activities are key growth catalysts. The region benefits from advanced mining technologies and a well-established supply chain, ensuring consistent product quality and availability. Leading players in this market include U.S. Silica Holdings and other established companies that dominate the landscape. The competitive environment is characterized by strategic partnerships and acquisitions aimed at enhancing production capabilities. The presence of significant reserves and advanced processing facilities further strengthens the market position of these key players, ensuring they meet the growing demand effectively.

    Europe : Emerging Regulatory Framework

    The European silica sand market is witnessing growth driven by increasing demand for eco-friendly construction materials and stringent regulations promoting sustainability. Germany and France are the largest markets, holding approximately 35% and 20% market shares, respectively. The EU's commitment to reducing carbon emissions and promoting sustainable practices is a significant regulatory catalyst for the industry, encouraging innovation and investment in cleaner technologies. Key players such as CDE Global and Mineral Technologies are actively involved in developing sustainable solutions. The competitive landscape is marked by a focus on innovation, with companies investing in research and development to enhance product quality and reduce environmental impact. The presence of a diverse range of suppliers and manufacturers contributes to a dynamic market environment, fostering healthy competition and collaboration among industry stakeholders.

    Asia-Pacific : Rapid Growth and Demand

    The Asia-Pacific silica sand market is experiencing rapid growth, driven by increasing industrialization and urbanization. Australia and Japan are the largest markets, accounting for approximately 40% and 25% of the market share, respectively. The region's demand is fueled by the construction, glass, and foundry industries, with regulatory support for infrastructure development acting as a catalyst for growth. The rising need for high-quality silica sand in various applications is further propelling market expansion. Countries like Australia and Japan are home to key players such as VRX Silica and Toyota Tsusho Corporation, which are actively enhancing their production capabilities. The competitive landscape is characterized by a mix of local and international companies, fostering innovation and efficiency. The presence of significant reserves and advanced processing technologies positions these countries as leaders in the silica sand market, ensuring they meet the growing demand effectively.

    Middle East and Africa : Resource-Rich Opportunities

    The Middle East and Africa silica sand market is poised for growth, driven by increasing demand from the construction and manufacturing sectors. South Africa and the UAE are the largest markets, holding approximately 30% and 20% market shares, respectively. The region's growth is supported by ongoing infrastructure projects and a rising population, which drives demand for construction materials. Regulatory frameworks promoting local production and sustainability are also contributing to market expansion. Key players in this region include Sands & Gravel and other local companies that are capitalizing on the abundant natural resources. The competitive landscape is evolving, with new entrants and established firms vying for market share. The presence of significant silica sand reserves and a growing focus on sustainable practices are shaping the future of the market, ensuring it meets the increasing demand effectively.

    Key Players and Competitive Insights

    The Asia Pacific Silica Sand Market is currently characterized by a dynamic competitive landscape, driven by increasing demand across various sectors such as construction, glass manufacturing, and hydraulic fracturing. Key players in this market, including Sibelco (SG), U.S. Silica Holdings (US), and Toyota Tsusho Corporation (JP), are strategically positioning themselves through innovation and regional expansion. Sibelco (SG) focuses on enhancing its product portfolio with high-quality silica sand tailored for specific applications, while U.S. Silica Holdings (US) emphasizes operational efficiency and cost leadership to maintain its competitive edge. Toyota Tsusho Corporation (JP) is leveraging its extensive distribution network to penetrate emerging markets, thereby shaping the competitive environment through strategic partnerships and localized offerings.

    The business tactics employed by these companies reflect a concerted effort to optimize supply chains and localize manufacturing processes. The market structure appears moderately fragmented, with several players vying for market share. However, the collective influence of major companies like Sibelco (SG) and U.S. Silica Holdings (US) suggests a trend towards consolidation, as these firms seek to enhance their operational capabilities and market reach.

    In August 2025, Sibelco (SG) announced a strategic partnership with a leading construction firm to supply specialized silica sand for sustainable building materials. This collaboration not only underscores Sibelco's commitment to sustainability but also positions the company as a key player in the green construction sector, potentially enhancing its market share in a rapidly evolving industry.

    In September 2025, U.S. Silica Holdings (US) unveiled a new state-of-the-art processing facility aimed at increasing production efficiency and reducing environmental impact. This investment reflects the company's focus on technological advancement and operational excellence, which may provide a competitive advantage in a market that increasingly values sustainability and efficiency.

    In July 2025, Toyota Tsusho Corporation (JP) expanded its operations in Southeast Asia by acquiring a local silica sand producer. This strategic move not only enhances Toyota Tsusho's supply chain resilience but also allows the company to better serve regional customers, indicating a proactive approach to market penetration and customer engagement.

    As of October 2025, the competitive trends in the Asia Pacific Silica Sand Market are increasingly defined by digitalization, sustainability, and the integration of advanced technologies such as AI. Strategic alliances are becoming more prevalent, as companies recognize the need to collaborate to enhance their competitive positioning. Looking ahead, it is likely that competitive differentiation will evolve from traditional price-based competition to a focus on innovation, technological integration, and supply chain reliability, reflecting the changing demands of the market.

    Key Companies in the Asia Pacific Silica Sand Market market include

    Industry Developments

    Future Outlook

    Asia Pacific Silica Sand Market Future Outlook

    <p>The Asia Pacific Silica Sand Market is projected to grow at a 7.5% CAGR from 2024 to 2035, driven by increasing demand in construction, glass manufacturing, and hydraulic fracturing.</p>

    New opportunities lie in:

    • <p>Expansion into eco-friendly silica sand production methods.</p>
    • <p>Development of specialized silica sand for high-tech applications.</p>
    • <p>Strategic partnerships with construction firms for bulk supply contracts.</p>

    <p>By 2035, the market is expected to solidify its position as a key player in the global silica sand industry.</p>

    Market Segmentation

    Asia Pacific Silica Sand Market Grade Outlook

    • Glass
    • Foundry
    • Chemical

    Asia Pacific Silica Sand Market Process Outlook

    • Wet
    • Dry

    Asia Pacific Silica Sand Market End-User Industry Outlook

    • Glass Manufacturing
    • Foundry
    • Chemical Production
    • Construction
    • Paints and Coatings
    • Ceramics and Refractories
    • Filtration
    • Oil and Gas Recovery
    • Other End User Industries (Food Processing, Industrial Abrasives and Sports Fields)

    Report Scope

    MARKET SIZE 20247.041(USD Billion)
    MARKET SIZE 20257.57(USD Billion)
    MARKET SIZE 203515.6(USD Billion)
    COMPOUND ANNUAL GROWTH RATE (CAGR)7.5% (2024 - 2035)
    REPORT COVERAGERevenue Forecast, Competitive Landscape, Growth Factors, and Trends
    BASE YEAR2024
    Market Forecast Period2025 - 2035
    Historical Data2019 - 2024
    Market Forecast UnitsUSD Billion
    Key Companies ProfiledMarket analysis in progress
    Segments CoveredMarket segmentation analysis in progress
    Key Market OpportunitiesGrowing demand for high-purity silica sand in electronics and renewable energy sectors presents significant opportunities.
    Key Market DynamicsRising demand for silica sand in construction and glass manufacturing drives competitive dynamics in the Asia Pacific market.
    Countries CoveredNorth America, Europe, APAC, South America, MEA

    Market Highlights

    Author

    Anshula Mandaokar
    Team Lead - Research

    She holds an experience of about 6+ years in market research and business consulting, working under the spectrum of information communication technology, telecommunications and semiconductor domains. aarti conceptualizes and implements a scalable business strategy and provides strategic leadership to the clients. her expertise lies in market estimation, competitive intelligence, pipeline analysis, customer assessment, etc.

    Leave a Comment

    Latest Comments

    John Doe
    john@example.com

    This is a great article! Really helped me understand the topic better.

    Posted on July 23, 2025, 10:15 AM
    Jane Smith
    jane@domain.com

    Thanks for sharing this. I’ve bookmarked it for later reference.

    Posted on July 22, 2025, 7:45 PM

    FAQs

    How much is the silica sand market?

    The Asia Pacific Silica Sand market size was valued at USD 7.04 Billion in 2024.

    What is the growth rate of the silica sand market?

    Silica Sand Market is projected to register a CAGR of 6.13% from 2025-2035

    Who are the key players in the silica sand market?

    The key players in the market are Chongqing Changjiang River Moulding Material Group Co. Ltd (CCRMM), Hebei Shenghuo New Material Technology Co., Ltd., JFE Mineral &amp; Alloy Company Ltd, Mangal Minerals, Mitsubishi Corporation, PUM Group, Petrazehra Berhad, Sibelco, TOCHU CORPORATION, Toyoura Keiseki Kogyo Co., Ltd, and VRX Silica Ltd.

    Which grade led the silica sand market?

    The glass category dominated the market in 2024.

    Which end-user industry had the largest market share in the silica sand market?

    The construction category had the largest share in the market.

    1. EXECUTIVE SUMMARY
    2. MARKET INTRODUCTION
      1. Definition
      2. Scope of the Study
        1. Research Objective
        2. Assumptions
        3. Limitations
    3. RESEARCH METHODOLOGY
      1. Overview
      2. Data Mining
      3. Secondary Research
      4. Primary Research
        1. Primary Interviews
        2. Breakdown of Primary Respondents
      5. and Information Gathering Process
      6. Forecasting Modality
      7. Market Size Estimation
        1. Bottom-Up Approach
        2. Top-Down Approach
      8. Data Triangulation
      9. Validation
    4. MARKET DYNAMICS
      1. Overview
      2. Drivers
      3. Restraints
      4. Opportunities
    5. MARKET FACTOR ANALYSIS
      1. Value Chain Analysis
      2. Porter’s Five Forces Analysis
        1. Bargaining Power
        2. Threat of New Entrants
        3. Threat of Substitutes
        4. Intensity of Rivalry
      3. of Suppliers
      4. 5.2.2.
      5. Bargaining Power of Buyers
      6. COVID-19 Impact Analysis
        1. Market Impact Analysis
        2. Regional Impact
        3. Opportunity and
      7. Threat Analysis
      8. 6.
    6. ASIA PACIFIC SILICA SAND MARKET, BY GRADE
      1. Overview
      2. Glass
      3. Foundry
      4. Chemical
    7. ASIA PACIFIC SILICA SAND MARKET, BY PROCESS
      1. Overview
      2. Wet
      3. Dry
    8. ASIA PACIFIC SILICA SAND MARKET, BY END-USER INDUSTRY
      1. Overview
      2. Glass Manufacturing
      3. Foundry
      4. Chemical Production
      5. Construction
      6. Paints and Coatings
      7. Ceramics and Refractories
      8. Filtration
      9. Oil and Gas Recovery
      10. Other End User
      11. Industries (Food Processing, Industrial Abrasives and Sports Fields)
    9. ASIA PACIFIC SILICA SAND MARKET,
      1. BY REGION
      2. 9.1.
      3. Overview
      4. 9.2.
      5. Asia-Pacific
      6. -
      7. China
      8. - Japan
      9. - India
      10. - Australia
      11. - South Korea
      12. - Indonesia
      13. - Thailand
      14. - Vietnam
      15. - Malaysia
      16. - Singapore
      17. - Rest of Asia-Pacific
    10. COMPETITIVE LANDSCAPE
      1. Overview
      2. Competitive Analysis
      3. Market Share Analysis
      4. Major Growth Strategy
      5. in the Asia Pacific SILICA SAND Market,
      6. Competitive Benchmarking
      7. Leading Players in Terms of Number of Developments
      8. in the Asia Pacific SILICA SAND Market,
      9. Key developments and Growth Strategies
        1. New Product Launch/Service
        2. Joint Ventures
      10. Deployment
      11. 10.7.2.
      12. Merger & Acquisitions
      13. Major Players Financial Matrix
        1. Sales & Operating
      14. Income, 2022
      15. 10.8.2.
      16. Major Players R&D Expenditure. 2022
    11. COMPANY PROFILES
      1. Chongqing Changjiang River Moulding Material
        1. Company Overview
        2. Financial Overview
        3. Products Offered
        4. Key Developments
        5. SWOT Analysis
        6. Key Strategies
      2. Group Co. Ltd (CCRMM)
      3. 11.1.1.
      4. Company Overview
      5. 11.1.2.
      6. Financial Overview
      7. 11.1.3.
      8. Products Offered
      9. 11.1.4.
      10. Key Developments
      11. 11.1.5.
      12. SWOT Analysis
      13. 11.1.6.
      14. Key Strategies
      15. 11.2.
      16. HEBEI SHENGHUO NEW MATERIAL TECHNOLOGY CO., LTD.
      17. JFE MINERAL & ALLOY COMPANY LTD
        1. Company Overview
        2. Financial Overview
        3. Products Offered
        4. Key Developments
        5. SWOT Analysis
        6. Key Strategies
      18. MANGAL MINERALS
        1. Company Overview
        2. Financial Overview
        3. Products Offered
        4. Key Developments
        5. SWOT Analysis
        6. Key Strategies
      19. MITSUBISHI CORPORATION
        1. Company Overview
        2. Financial Overview
        3. Products Offered
        4. Key Developments
        5. SWOT Analysis
        6. Key Strategies
      20. PUM GROUP
        1. Company Overview
        2. Financial Overview
        3. Products Offered
        4. Key Developments
        5. SWOT Analysis
        6. Key Strategies
      21. Petrazehra Berhad
        1. Company Overview
        2. Financial Overview
        3. Products Offered
        4. Key Developments
        5. SWOT Analysis
        6. Key Strategies
      22. SIBELCO
        1. Company Overview
        2. Financial Overview
        3. Products Offered
        4. Key Developments
        5. SWOT Analysis
        6. Key Strategies
      23. TOCHU CORPORATION
        1. Company Overview
        2. Financial Overview
        3. Products Offered
        4. Key Developments
        5. SWOT Analysis
        6. Key Strategies
      24. TOYOURA KEISEKI
      25. KOGYO CO., LTD
      26. 11.10.1.
      27. Company Overview
      28. 11.10.2.
      29. Financial Overview
      30. 11.10.3.
      31. Products Offered
      32. 11.10.4.
      33. Key Developments
      34. 11.10.5.
      35. SWOT Analysis
      36. 11.10.6.
      37. Key Strategies
      38. 11.11.
      39. VRX Silica Ltd
      40. 11.11.1.
      41. Company Overview
      42. 11.11.2.
      43. Financial Overview
      44. 11.11.3.
      45. Products Offered
      46. 11.11.4.
      47. Key Developments
      48. 11.11.5.
      49. SWOT Analysis
      50. 11.11.6.
      51. Key Strategies
      52. 12.
      53. APPENDIX
      54. 12.1.
      55. References
      56. 12.2.
      57. Related Reports
    12. LIST OF TABLES
    13. ASIA PACIFIC
      1. SILICA SAND MARKET, SYNOPSIS, 2025 - 2034
    14. ASIA PACIFIC SILICA SAND MARKET, ESTIMATES
      1. & FORECAST, 2025 - 2034 (USD BILLION)
    15. ASIA PACIFIC SILICA SAND MARKET, BY GRADE,
    16. ASIA PACIFIC SILICA SAND MARKET, BY PROCESS , 2025 - 2034 (USD
      1. BILLION)
      2. TABLE
    17. ASIA PACIFIC SILICA SAND MARKET, BY END-USER INDUSTRY , 2025 - 2034 (USD BILLION)
    18. CHINA SILICA
    19. SAND MARKET, BY GRADE, 2025 - 2034 (USD BILLION)
    20. CHINA SILICA SAND MARKET, BY PROCESS , 2025
      1. - 2034 (USD BILLION)
      2. TABLE
    21. CHINA SILICA SAND MARKET, BY END-USER INDUSTRY , 2025 - 2034 (USD BILLION)
    22. JAPAN SILICA
    23. SAND MARKET, BY GRADE, 2025 - 2034 (USD BILLION)
    24. JAPAN SILICA SAND MARKET, BY PROCESS , 2025
      1. - 2034 (USD BILLION)
      2. TABLE
    25. JAPAN SILICA SAND MARKET, BY END-USER INDUSTRY , 2025 - 2034 (USD BILLION)
    26. INDIA SILICA
    27. SAND MARKET, BY GRADE, 2025 - 2034 (USD BILLION)
    28. INDIA SILICA SAND MARKET, BY PROCESS , 2025
      1. - 2034 (USD BILLION)
      2. TABLE
    29. INDIA SILICA SAND MARKET, BY END-USER INDUSTRY , 2025 - 2034 (USD BILLION)
    30. AUSTRALIA SILICA
    31. SAND MARKET, BY GRADE, 2025 - 2034 (USD BILLION)
    32. AUSTRALIA SILICA SAND MARKET, BY PROCESS
      1. , 2025 - 2034 (USD BILLION)
    33. AUSTRALIA SILICA SAND MARKET, BY END-USER INDUSTRY , 2025
      1. - 2034 (USD BILLION)
      2. TABLE
    34. SOUTH KOREA SILICA SAND MARKET, BY GRADE, 2025 - 2034 (USD BILLION)
    35. SOUTH KOREA
    36. SILICA SAND MARKET, BY PROCESS , 2025 - 2034 (USD BILLION)
    37. SOUTH KOREA SILICA SAND MARKET, BY END-USER
      1. INDUSTRY , 2025 - 2034 (USD BILLION)
    38. INDONESIA SILICA SAND MARKET, BY GRADE, 2025 -
      1. TABLE
    39. INDONESIA SILICA SAND MARKET, BY PROCESS , 2025 - 2034 (USD BILLION)
    40. INDONESIA SILICA
    41. SAND MARKET, BY END-USER INDUSTRY , 2025 - 2034 (USD BILLION)
    42. THAILAND SILICA SAND
    43. MARKET, BY GRADE, 2025 - 2034 (USD BILLION)
    44. THAILAND SILICA SAND MARKET, BY PROCESS
      1. , 2025 - 2034 (USD BILLION)
    45. THAILAND SILICA SAND MARKET, BY END-USER INDUSTRY , 2025 -
      1. TABLE
    46. VIETNAM SILICA SAND MARKET, BY GRADE, 2025 - 2034 (USD BILLION)
    47. VIETNAM SILICA SAND
    48. MARKET, BY PROCESS , 2025 - 2034 (USD BILLION)
    49. VIETNAM SILICA SAND MARKET, BY END-USER
      1. INDUSTRY , 2025 - 2034 (USD BILLION)
    50. MALAYSIA SILICA SAND MARKET, BY GRADE, 2025 - 2034
      1. (USD BILLION)
      2. TABLE
    51. MALAYSIA SILICA SAND MARKET, BY PROCESS , 2025 - 2034 (USD BILLION)
    52. MALAYSIA SILICA
    53. SAND MARKET, BY END-USER INDUSTRY , 2025 - 2034 (USD BILLION)
    54. SINGAPORE SILICA SAND
    55. MARKET, BY GRADE, 2025 - 2034 (USD BILLION)
    56. SINGAPORE SILICA SAND MARKET, BY PROCESS
      1. , 2025 - 2034 (USD BILLION)
    57. SINGAPORE SILICA SAND MARKET, BY END-USER INDUSTRY , 2025
      1. - 2034 (USD BILLION)
      2. TABLE
    58. REST OF ASIA PACIFIC SILICA SAND MARKET, BY GRADE, 2025 - 2034 (USD BILLION)
    59. REST OF ASIA
    60. PACIFIC SILICA SAND MARKET, BY PROCESS , 2025 - 2034 (USD BILLION)
    61. REST OF ASIA PACIFIC
    62. SILICA SAND MARKET, BY END-USER INDUSTRY , 2025 - 2034 (USD BILLION)
    63. LIST OF FIGURES
    64. RESEARCH PROCESS
    65. MARKET STRUCTURE
    66. FOR THE ASIA PACIFIC SILICA SAND MARKET
    67. MARKET DYNAMICS FOR THE ASIA PACIFIC SILICA SAND
      1. MARKET
      2. FIGURE
    68. ASIA PACIFIC SILICA SAND MARKET, SHARE (%), BY GRADE, 2022
    69. ASIA PACIFIC SILICA SAND MARKET, SHARE (%),
      1. BY PROCESS , 2022
      2. FIGURE
    70. ASIA PACIFIC SILICA SAND MARKET, SHARE (%), BY END-USER INDUSTRY , 2022
    71. ASIA PACIFIC
    72. SILICA SAND MARKET, SHARE (%), BY REGION, 2022
    73. ASIA PACIFIC SILICA SAND MARKET: COMPANY
      1. SHARE ANALYSIS, 2022 (%)
    74. CHONGQING CHANGJIANG RIVER MOULDING MATERIAL GROUP CO. LTD
      1. (CCRMM): FINANCIAL OVERVIEW SNAPSHOT
    75. CHONGQING CHANGJIANG RIVER MOULDING MATERIAL GROUP
      1. CO. LTD (CCRMM): SWOT ANALYSIS
    76. HEBEI SHENGHUO NEW MATERIAL TECHNOLOGY CO., LTD.: FINANCIAL
      1. OVERVIEW SNAPSHOT
      2. FIGURE
    77. HEBEI SHENGHUO NEW MATERIAL TECHNOLOGY CO., LTD.: SWOT ANALYSIS
    78. JFE MINERAL & ALLOY
      1. COMPANY LTD: FINANCIAL OVERVIEW SNAPSHOT
    79. JFE MINERAL & ALLOY COMPANY LTD: SWOT ANALYSIS
    80. MANGAL MINERALS:
      1. FINANCIAL OVERVIEW SNAPSHOT
    81. MANGAL MINERALS: SWOT ANALYSIS
    82. MITSUBISHI CORPORATION: FINANCIAL OVERVIEW
      1. SNAPSHOT
      2. FIGURE
    83. MITSUBISHI CORPORATION: SWOT ANALYSIS
    84. PUM GROUP: FINANCIAL OVERVIEW SNAPSHOT
    85. PUM GROUP:
    86. SWOT ANALYSIS
      1. FIGURE
    87. PETRAZEHRA BERHAD: FINANCIAL OVERVIEW SNAPSHOT
    88. PETRAZEHRA BERHAD: SWOT ANALYSIS
    89. SIBELCO: FINANCIAL
      1. OVERVIEW SNAPSHOT
      2. FIGURE
    90. SIBELCO: SWOT ANALYSIS
    91. TOCHU CORPORATION: FINANCIAL OVERVIEW SNAPSHOT
    92. TOCHU CORPORATION:
    93. SWOT ANALYSIS
      1. FIGURE
    94. TOYOURA KEISEKI KOGYO CO., LTD: FINANCIAL OVERVIEW SNAPSHOT
    95. TOYOURA KEISEKI KOGYO
      1. CO., LTD: SWOT ANALYSIS
    96. VRX SILICA LTD: FINANCIAL OVERVIEW SNAPSHOT
    97. VRX SILICA LTD: SWOT
      1. ANALYSIS

    Asia Pacific Silica Sand Market Segmentation

    Market Segmentation Overview

    • Detailed segmentation data will be available in the full report
    • Comprehensive analysis by multiple parameters
    • Regional and country-level breakdowns
    • Market size forecasts by segment
    Infographic

    Free Sample Request

    Kindly complete the form below to receive a free sample of this Report

    Get Free Sample

    Customer Strories

    “I am very pleased with how market segments have been defined in a relevant way for my purposes (such as "Portable Freezers & refrigerators" and "last-mile"). In general the report is well structured. Thanks very much for your efforts.”

    Victoria Milne

    Founder
    Case Study
    Chemicals and Materials