×
Hero Background
English
Chinese
French
Japanese
Korean
German
Spanish

Asia Pacific Silica Sand Market Trends

ID: MRFR/CnM/11161-HCR
128 Pages
Anshula Mandaokar
October 2025

Asia Pacific Silica Sand Market Research Report Information By Grade (Glass, Foundry, and Chemical), By Process (Wet and Dry), By End-User Industry (Glass Manufacturing, Foundry, Chemical Production, Construction, Paints and Coatings, Ceramics and Refractories, Filtration, Oil and Gas Recovery, and Other End User Industries (Food Processing, Industrial Abrasives and Sports Fields)) – and Asia Pacific Market Forecast Till 2035

Share:
Download PDF ×

We do not share your information with anyone. However, we may send you emails based on your report interest from time to time. You may contact us at any time to opt-out.

Asia Pacific Silica Sand Market Infographic
Purchase Options

Market Trends

Key Emerging Trends in the Asia Pacific Silica Sand Market

Recent trends in the Asia Pacific silica sand market have changed the industry. This industry is driven by strong building and infrastructure growth. Asia Pacific countries are investing substantially in urbanization projects, driving up silica sand consumption to meet the construction industry's insatiable appetite.

In Asia Pacific, the electronics industry is driving silica sand demand. Silica sand is essential to making semiconductor and electronics silicon wafers. With more people using electronics, silica sand consumption has increased. China, Japan, and South Korea, famed for their electronics industry, have driven this trend, affecting Asia Pacific market dynamics.

Environmental concerns and sustainable practices also influence Asia Pacific silica sand market trends. To ensure responsible silica sand mining and extraction, governments and regulatory organizations are enacting stricter environmental rules. This has led market participants to embrace eco-friendly mining practices and invest in silica sand extraction technologies that reduce environmental effect. Both producers and consumers in the Asia Pacific silica sand market prioritize sustainability.

Technology in silica sand mining and processing has also shaped market trends. Mining innovations like hydraulic fracturing have made silica sand extraction more efficient, meeting industry demand. Advances in benefaction technologies have allowed producers to supply high quality silica sand that meets end user needs. These technical advances have improved the supply chain and made the Asia Pacific market more competitive.

Globalization and trade have also affected Asia Pacific silica sand market trends. Due to cost competitiveness, quality standards, and regional demand-supply imbalances, silica sand imports and exports have increased. Surplus silica sand countries are major suppliers to those facing shortages or seeking specific grades for specialized applications. This worldwide commercial interaction has created a complicated yet integrated Asia Pacific market.

Author
Anshula Mandaokar
Team Lead - Research

Anshula Mandaokar holds an academic degree in Chemical Engineering and has been contributing to the field for more than 5 years. She has expertise in Market Research and Business Consulting and serves as a Team Lead for a reputed Market Research firm under the Chemicals and Materials domain spectrum. She has worked on multiple projects, generating explicit results in a quick turnaround time. Her understanding of data interpretation justifies her role as a leader.

Leave a Comment

FAQs

What is the projected market valuation of the Asia Pacific Silica Sand Market by 2035?

The projected market valuation for the Asia Pacific Silica Sand Market is 15.6 USD Billion by 2035.

What was the market valuation of the Asia Pacific Silica Sand Market in 2024?

The overall market valuation of the Asia Pacific Silica Sand Market was 7.041 USD Billion in 2024.

What is the expected CAGR for the Asia Pacific Silica Sand Market during the forecast period 2025 - 2035?

The expected CAGR for the Asia Pacific Silica Sand Market during the forecast period 2025 - 2035 is 7.5%.

Which companies are considered key players in the Asia Pacific Silica Sand Market?

Key players in the Asia Pacific Silica Sand Market include Sibelco, U.S. Silica Holdings, Toyota Tsusho Corporation, and CDE Global.

What are the projected valuations for the Glass segment in the Asia Pacific Silica Sand Market?

The projected valuations for the Glass segment are expected to range from 2.5 to 5.5 USD Billion.

Market Summary

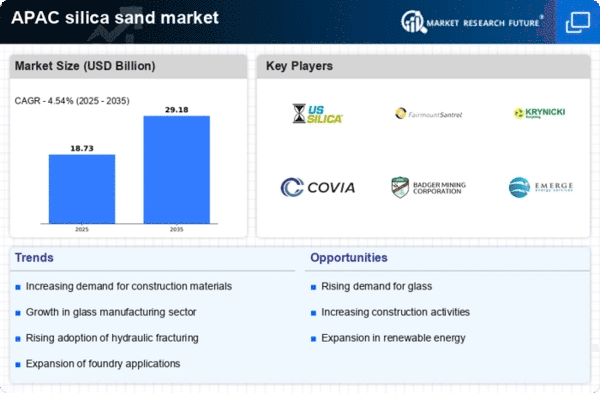
As per MRFR analysis, the APAC silica sand market Size was estimated at 17.91 USD Billion in 2024. The APAC silica sand market is projected to grow from 18.73 USD Billion in 2025 to 29.18 USD Billion by 2035, exhibiting a compound annual growth rate (CAGR) of 4.54% during the forecast period 2025 - 2035.

Key Market Trends & Highlights

The APAC silica sand market is experiencing robust growth driven by construction and technological advancements.

  • The demand for silica sand is surging, particularly in the construction sector across China and India.
  • Technological advancements in extraction methods are enhancing efficiency and reducing costs in the silica sand market.
  • There is an increasing regulatory focus on sustainability, influencing production practices in the region.
  • Key market drivers include the expansion of glass manufacturing and rising demand for frac sand, fueled by infrastructure investments.

Market Size & Forecast

2024 Market Size 17.91 (USD Billion)
2035 Market Size 29.18 (USD Billion)
CAGR (2025 - 2035) 4.54%

Major Players

<p>U.S. Silica Holdings Inc (US), Fairmount Santrol (US), Sibelco (BE), Covia Holdings Corporation (US), Badger Mining Corporation (US), Emerge Energy Services LP (US), Quarzwerke GmbH (DE), Mitsubishi Corporation RtM Japan Ltd (JP)</p>

Market Trends

The silica sand market is currently experiencing notable developments, particularly within the Asia-Pacific region. This market is characterized by a growing demand driven by various industries, including construction, glass manufacturing, and hydraulic fracturing. The increasing urbanization and infrastructure projects across several APAC countries are contributing to the heightened consumption of silica sand. Furthermore, the region's abundant natural resources and favorable geological conditions facilitate the extraction and processing of high-quality silica sand, which is essential for various applications. As a result, stakeholders are likely to invest in advanced technologies to enhance production efficiency and meet the rising demand. In addition to the demand surge, environmental regulations are becoming increasingly stringent, prompting companies to adopt sustainable practices. This shift may lead to innovations in extraction methods and processing techniques, ensuring minimal ecological impact. The silica sand market is also witnessing a trend towards consolidation, as smaller players seek partnerships or mergers to enhance their competitive edge. Overall, the landscape appears dynamic, with opportunities for growth and challenges that require strategic navigation by industry participants.

Rising Demand from Construction Sector

The construction sector is a primary driver of growth in the silica sand market. As urbanization accelerates in APAC, the need for building materials increases, leading to higher consumption of silica sand for concrete and mortar production. This trend suggests a robust outlook for the market as infrastructure projects expand.

Technological Advancements in Extraction

Innovations in extraction technologies are transforming the silica sand market. Companies are increasingly adopting advanced methods to improve efficiency and reduce environmental impact. This trend indicates a shift towards more sustainable practices, which may enhance the market's long-term viability.

Increased Regulatory Focus on Sustainability

Regulatory frameworks in APAC are becoming more stringent regarding environmental protection. This focus on sustainability is prompting companies in the silica sand market to implement eco-friendly practices. Such developments may reshape operational strategies and influence market dynamics.

Asia Pacific Silica Sand Market Market Drivers

Rising Demand for Frac Sand

The rising demand for frac sand in the APAC region is emerging as a significant driver for the silica sand market. Frac sand is essential in hydraulic fracturing processes used in oil and gas extraction, particularly in unconventional resources. As energy companies in APAC increasingly explore shale gas and tight oil reserves, the need for high-quality frac sand is likely to surge. The APAC region's oil and gas sector is projected to grow at a CAGR of around 5% through 2025, which may lead to a corresponding increase in silica sand consumption. This trend suggests that silica sand market players could capitalize on the growing demand for frac sand, positioning themselves strategically within the energy sector.

Growth in Foundry Applications

The growth in foundry applications within the APAC region is another critical driver for the silica sand market. Foundries utilize silica sand as a primary material for molding and casting processes, which are essential in producing metal components for various industries, including automotive and aerospace. The foundry industry in APAC is anticipated to expand, driven by increasing manufacturing activities and the rising demand for metal products. In 2025, the foundry market in APAC is expected to reach a valuation of over $50 billion, indicating a robust demand for silica sand. This growth presents opportunities for silica sand suppliers to cater to the specific needs of foundries, thereby enhancing their market presence and profitability.

Expansion of Glass Manufacturing

The expansion of the glass manufacturing sector in APAC is a pivotal driver for the silica sand market. As the region witnesses a surge in construction and automotive industries, the demand for glass products, including windows, containers, and automotive glass, is on the rise. In 2025, the glass manufacturing sector in APAC is projected to grow at a CAGR of approximately 6.5%, significantly boosting the need for high-quality silica sand. This growth is further fueled by the increasing urbanization and infrastructure development across countries like India and China, where the demand for glass is expected to escalate. Consequently, the silica sand market is likely to benefit from this trend, as manufacturers seek to source silica sand that meets stringent quality standards for glass production.

Emergence of Green Building Practices

The emergence of green building practices in APAC is influencing the silica sand market positively. As sustainability becomes a priority for construction and architecture, the demand for eco-friendly materials is increasing. Silica sand, being a natural resource, is often favored in green building projects due to its low environmental impact. The green building market in APAC is expected to grow at a CAGR of approximately 10% by 2025, indicating a shift towards sustainable construction practices. This trend may encourage silica sand market players to innovate and offer products that align with green building standards, thereby enhancing their competitive edge in a rapidly evolving market.

Increased Investment in Infrastructure Projects

Increased investment in infrastructure projects across APAC is a vital driver for the silica sand market. Governments in the region are prioritizing infrastructure development to support economic growth and urbanization. Major initiatives, such as road construction, bridge building, and public transportation systems, are underway, leading to heightened demand for construction materials, including silica sand. In 2025, infrastructure spending in APAC is projected to exceed $1 trillion, creating substantial opportunities for silica sand suppliers. This influx of investment is likely to stimulate the silica sand market, as construction companies seek reliable sources of high-quality silica sand to meet project specifications and timelines.

Market Segment Insights

By Mesh Size: 70-120 mesh (Largest) vs. >200 mesh (Fastest-Growing)

<p>In the APAC silica sand market, the mesh size segment exhibits a varied distribution of market share among its categories. The largest portion is held by the 70-120 mesh category, which is primarily utilized for industrial applications such as glass manufacturing and foundry casting. Following this, the < 70 mesh and 120-200 mesh categories represent significant shares, catering to specialized applications in construction and ceramics. The >200 mesh segment, while smaller, is gaining traction due to increasing demand in high-precision applications. The growth trends within the mesh size segment are driven by rising industrial activities, particularly in the manufacturing sector. The 70-120 mesh size is experiencing robust growth due to its extensive use in various applications, while the >200 mesh size is emerging as the fastest-growing due to its attractiveness for high-tech industries. The drive towards sustainable practices and increased investments in infrastructure development are further propelling the demand for different mesh sizes in this market.</p>

<p>70-120 mesh (Dominant) vs. >200 mesh (Emerging)</p>

<p>The 70-120 mesh category stands out as the dominant player in the silica sand market, characterized by its versatility and extensive applications across multiple industries. This mesh size is favored for its ideal granule size, which offers optimal performance in glass production and foundry applications. In contrast, the >200 mesh size is emerging, appealing to high-value industries that require finer specifications such as electronics and precision tool manufacturing. As industries evolve towards more advanced applications, the demand for finer mesh sizes, including the >200 mesh, is expected to rise, driven by technological advancements and the need for higher purity standards.</p>

By Grade: Glass (Largest) vs. Foundry (Fastest-Growing)

<p>In the Grade segment of the silica sand market, glass production holds the largest market share, benefiting from increasing demand in the construction and automotive industries. Foundry sand follows, showing considerable potential for growth, particularly due to the upswing in manufacturing activities across the region. Chemical-grade sand, although smaller in market share, is essential for various industrial applications including the production of silicon metal and glass, contributing to the overall landscape of the segment. The growth in the glass segment is driven by rising urbanization and infrastructure development across APAC, while the foundry segment is witnessing rapid expansion due to the recovery of key manufacturing sectors. Significant investments are being made into high-quality silica sand for casting purposes, aiming to meet the quality standards demanded by the automotive and aerospace industries. This combination of industrial activity and construction projects creates a strong momentum for both glass and foundry sand, with chemical-grade sand key to supporting emerging technologies.</p>

<p>Glass (Dominant) vs. Foundry (Emerging)</p>

<p>The glass segment is characterized by its extensive application in the production of containers, tableware, and flat glass for buildings and vehicles. Its market dominance is attributed to strong demand from the booming construction and automotive sectors, making it a critical component of industrial supply chains in the region. Conversely, the foundry segment is emerging, driven by increased casting requirements from industrial sectors and enhanced material performance standards. Foundry sand is particularly valued for its ability to withstand high temperatures and provide excellent surface finishes in castings, positioning it well for growth as industries focus on quality and efficiency.</p>

By Process: Wet Silica Sand (Largest) vs. Dry Silica Sand (Fastest-Growing)

<p>In the APAC silica sand market, wet silica sand commands a significant market share, driven by its prevalent use in applications requiring high moisture content such as concrete and glass manufacturing. This segment showcases robust demand, particularly in construction and industrial operations, making it a cornerstone of the market. In contrast, dry silica sand, while currently smaller in market share, exhibits rapid growth due to its increasing application in the oil and gas sector, as well as in foundry and filtration processes. The growth trends for these segments are influenced by several factors, including technological advancements and enhanced product quality. Wet silica sand's established position is being challenged by dry silica sand's emergence, especially with growing activities in hydraulic fracturing and other industrial operations. As environmental regulations favor cleaner technologies, dry silica sand's adoption in various sectors is anticipated to accelerate, propelling its market trajectory upward.</p>

<p>Wet Silica Sand: Dominant vs. Dry Silica Sand: Emerging</p>

<p>Wet silica sand is characterized by its high moisture content, making it ideal for applications where such properties are essential, including concrete mixing, ceramics, and glass production. The dominance of wet silica sand in the APAC market is attributed to long-standing usage in traditional industries, providing dependable performance. In contrast, dry silica sand is increasingly recognized as an emerging player, benefiting from its versatility in different applications such as oil recovery, hydraulic fracturing, and construction. With its favorable physical properties and advantages in resource extraction, dry silica sand is gaining traction due to rising demands for efficient and sustainable industrial solutions.</p>

By Application: Glass (Largest) vs. Hydraulic Fracturing (Fastest-Growing)

<p>In the APAC silica sand market, the application segment is diverse, with glass manufacturing capturing the largest market share. This segment benefits from the increasing demand for glass in construction, automotive, and consumer goods. Hydraulic fracturing, while smaller in share, is the fastest-growing application due to the rising need for energy resources and enhanced oil recovery techniques. Other noteworthy applications include foundry, construction, and chemicals, each contributing to the market's overall landscape. The growth trends within the application segment are driven by several factors. The construction sector is experiencing robust growth, which propels the demand for glass and sand in building materials. Similarly, the expansion of the hydraulic fracturing industry reflects a shift towards unconventional oil and gas extraction methods. Trends in sustainable materials and the rise of green technologies also catalyze growth in the ceramics and paints & coatings applications, indicating a progressive shift in consumer preferences and industrial practices.</p>

<p>Glass (Dominant) vs. Hydraulic Fracturing (Emerging)</p>

<p>Glass stands out as the dominant application in the APAC silica sand market, characterized by its extensive use in various industries, including construction and automotive. This application relies on the high purity and specific grain sizes of silica sand to produce high-quality glass products. On the other hand, hydraulic fracturing is emerging rapidly, driven by advancements in oil extraction technologies. This application necessitates specially processed silica sand that enhances fracturing fluid performance, illustrating the segment's unique requirements. As energy demands increase, the hydraulic fracturing market is expected to expand, challenging the dominance of glass. These dynamics highlight a competitive landscape where innovation and sustainability will play crucial roles in shaping future market trends.</p>

Get more detailed insights about Asia Pacific Silica Sand Market Research Report—Forecast till 2035

Regional Insights

China : Unmatched Growth and Demand Trends

China holds a commanding 7.5% market share in the APAC silica sand market, driven by rapid industrialization and urbanization. Key growth drivers include the booming construction sector, which fuels demand for high-quality silica sand in concrete and glass manufacturing. Government initiatives aimed at infrastructure development, such as the Belt and Road Initiative, further bolster market growth. Regulatory policies promoting sustainable mining practices are also shaping consumption patterns favorably.

India : Strong Demand from Construction Sector

India's silica sand market accounts for 3.5% of the APAC total, with a value driven by increasing demand in construction and glass industries. The government's push for 'Housing for All' and infrastructure projects under the National Infrastructure Pipeline are key growth drivers. Consumption patterns are shifting towards high-purity silica sand, influenced by regulatory policies aimed at quality standards and environmental sustainability.

Japan : Innovation in Silica Sand Applications

Japan's market share stands at 2.8%, characterized by a focus on high-tech applications in electronics and automotive industries. The demand for silica sand is driven by advancements in technology and a shift towards eco-friendly materials. Government regulations promoting innovation and sustainability are pivotal in shaping market dynamics, encouraging the use of silica sand in various sectors, including construction and manufacturing.

South Korea : Strategic Investments in Infrastructure

South Korea holds a 1.8% market share, with significant growth driven by investments in infrastructure and industrial applications. The demand for silica sand is increasing in sectors like construction, glass, and ceramics. Government initiatives aimed at enhancing industrial capabilities and regulatory frameworks supporting sustainable practices are crucial for market expansion. The focus on high-quality silica sand is evident in consumption trends.

Malaysia : Focus on Sustainable Mining Practices

Malaysia's silica sand market, with a share of 0.9%, is characterized by niche applications in the glass and foundry industries. The growth is supported by government policies promoting sustainable mining and environmental protection. Demand trends indicate a shift towards high-purity silica sand, driven by local industries' needs. Infrastructure development in states like Selangor and Penang is also contributing to market growth.

Thailand : Emerging Hub for Regional Exports

Thailand's market share is 0.7%, with growth driven by its strategic location for silica sand exports to neighboring countries. The demand is primarily from the construction and glass industries. Government initiatives to enhance trade and regulatory policies supporting mining operations are pivotal. Key markets include Bangkok and Chonburi, where industrial activities are concentrated, fostering a competitive landscape.

Indonesia : Rising Demand in Construction Sector

Indonesia's silica sand market accounts for 0.6% of the APAC total, with growth driven by the booming construction sector. The government's infrastructure development initiatives, such as the National Medium-Term Development Plan, are key growth drivers. Consumption patterns are shifting towards high-quality silica sand, influenced by regulatory policies aimed at improving industry standards. Local demand is concentrated in Jakarta and Surabaya.

Rest of APAC : Varied Applications Across Sub-regions

The Rest of APAC holds a minimal market share of 0.11%, characterized by diverse applications of silica sand across various industries. Demand is influenced by local market conditions and regulatory frameworks that vary significantly by country. The competitive landscape is fragmented, with numerous small players catering to niche markets. Key applications include construction, glass manufacturing, and foundry industries, reflecting the region's varied industrial needs.

Key Players and Competitive Insights

The silica sand market is currently characterized by a competitive landscape that is both dynamic and multifaceted. Key growth drivers include the increasing demand for silica sand in various applications such as glass manufacturing, hydraulic fracturing, and construction. Major players like U.S. Silica Holdings Inc (US), Sibelco (BE), and Mitsubishi Corporation RtM Japan Ltd (JP) are strategically positioning themselves through innovation and regional expansion. U.S. Silica Holdings Inc (US) has focused on enhancing its operational efficiency and product offerings, while Sibelco (BE) emphasizes sustainable practices and technological advancements. These strategies collectively shape a competitive environment that is increasingly focused on sustainability and operational excellence.

In terms of business tactics, companies are localizing manufacturing and optimizing supply chains to enhance responsiveness to market demands. The market structure appears moderately fragmented, with several key players exerting influence over pricing and supply dynamics. This fragmentation allows for niche players to thrive, while larger companies leverage economies of scale to maintain competitive pricing. The collective influence of these key players fosters a competitive atmosphere where innovation and efficiency are paramount.

In October 2025, Sibelco (BE) announced a significant investment in a new production facility in Southeast Asia, aimed at increasing its capacity to meet the growing demand for high-quality silica sand. This strategic move is likely to enhance Sibelco's market presence in the region, allowing it to better serve its customers and respond to local market needs. The investment underscores the company's commitment to expanding its operational footprint and improving supply chain efficiency.

In September 2025, Mitsubishi Corporation RtM Japan Ltd (JP) entered into a strategic partnership with a local mining company in Australia to enhance its silica sand sourcing capabilities. This collaboration is expected to bolster Mitsubishi's supply chain resilience and provide access to high-grade silica sand deposits. Such partnerships are indicative of a broader trend where companies seek to secure reliable sources of raw materials amidst fluctuating market conditions.

In August 2025, U.S. Silica Holdings Inc (US) launched a new line of eco-friendly silica sand products designed for the construction industry. This initiative reflects a growing trend towards sustainability, as the company aims to cater to environmentally conscious consumers. By diversifying its product offerings, U.S. Silica is positioning itself as a leader in sustainable practices within the silica sand market.

As of November 2025, current competitive trends are increasingly defined by digitalization, sustainability, and the integration of advanced technologies such as AI. Strategic alliances are shaping the landscape, enabling companies to enhance their operational capabilities and market reach. The shift from price-based competition to a focus on innovation, technology, and supply chain reliability is evident. Companies that prioritize these aspects are likely to differentiate themselves in an evolving market, ensuring long-term success.

Key Companies in the Asia Pacific Silica Sand Market market include

Industry Developments

Future Outlook

Asia Pacific Silica Sand Market Future Outlook

<p>The silica sand market is projected to grow at a 4.54% CAGR from 2024 to 2035, driven by increasing demand in construction, glass manufacturing, and hydraulic fracturing.</p>

New opportunities lie in:

  • <p>Expansion of eco-friendly silica sand production methods</p>
  • <p>Development of specialized silica sand for high-tech applications</p>
  • <p>Investment in automated logistics for efficient supply chain management</p>

<p>By 2035, the silica sand market is expected to achieve robust growth and enhanced market positioning.</p>

Market Segmentation

Asia Pacific Silica Sand Market Grade Outlook

  • Glass
  • Foundry
  • Chemical

Asia Pacific Silica Sand Market Process Outlook

  • Wet
  • Dry

Asia Pacific Silica Sand Market End-User Industry Outlook

  • Glass Manufacturing
  • Foundry
  • Chemical Production
  • Construction
  • Paints and Coatings
  • Ceramics and Refractories
  • Filtration
  • Oil and Gas Recovery
  • Other End User Industries (Food Processing, Industrial Abrasives and Sports Fields)

Report Scope

MARKET SIZE 202417.91(USD Billion)
MARKET SIZE 202518.73(USD Billion)
MARKET SIZE 203529.18(USD Billion)
COMPOUND ANNUAL GROWTH RATE (CAGR)4.54% (2024 - 2035)
REPORT COVERAGERevenue Forecast, Competitive Landscape, Growth Factors, and Trends
BASE YEAR2024
Market Forecast Period2025 - 2035
Historical Data2019 - 2024
Market Forecast UnitsUSD Billion
Key Companies Profiled["U.S. Silica Holdings Inc (US)", "Fairmount Santrol (US)", "Sibelco (BE)", "Covia Holdings Corporation (US)", "Badger Mining Corporation (US)", "Emerge Energy Services LP (US)", "Quarzwerke GmbH (DE)", "Mitsubishi Corporation RtM Japan Ltd (JP)"]
Segments CoveredMesh Size, Grade, Process, Application
Key Market OpportunitiesGrowing demand for high-purity silica sand in advanced manufacturing and renewable energy sectors.
Key Market DynamicsRising demand for silica sand in construction and glass manufacturing drives competitive dynamics in the APAC region.
Countries CoveredChina, India, Japan, South Korea, Malaysia, Thailand, Indonesia, Rest of APAC

FAQs

What is the projected market valuation of the Asia Pacific Silica Sand Market by 2035?

The projected market valuation for the Asia Pacific Silica Sand Market is 15.6 USD Billion by 2035.

What was the market valuation of the Asia Pacific Silica Sand Market in 2024?

The overall market valuation of the Asia Pacific Silica Sand Market was 7.041 USD Billion in 2024.

What is the expected CAGR for the Asia Pacific Silica Sand Market during the forecast period 2025 - 2035?

The expected CAGR for the Asia Pacific Silica Sand Market during the forecast period 2025 - 2035 is 7.5%.

Which companies are considered key players in the Asia Pacific Silica Sand Market?

Key players in the Asia Pacific Silica Sand Market include Sibelco, U.S. Silica Holdings, Toyota Tsusho Corporation, and CDE Global.

What are the projected valuations for the Glass segment in the Asia Pacific Silica Sand Market?

The projected valuations for the Glass segment are expected to range from 2.5 to 5.5 USD Billion.

  1. SECTION I: EXECUTIVE SUMMARY AND KEY HIGHLIGHTS
    1. EXECUTIVE SUMMARY
      1. Market Overview
      2. Key Findings
      3. Market Segmentation
      4. Competitive Landscape
      5. Challenges and Opportunities
      6. Future Outlook
  2. SECTION II: SCOPING, METHODOLOGY AND MARKET STRUCTURE
    1. MARKET INTRODUCTION
      1. Definition
      2. Scope of the study
    2. RESEARCH METHODOLOGY
      1. Overview
      2. Data Mining
      3. Secondary Research
      4. Primary Research
      5. Forecasting Model
      6. Market Size Estimation
      7. Data Triangulation
      8. Validation
  3. SECTION III: QUALITATIVE ANALYSIS
    1. MARKET DYNAMICS
      1. Overview
      2. Drivers
      3. Restraints
      4. Opportunities
    2. MARKET FACTOR ANALYSIS
      1. Value chain Analysis
      2. Porter's Five Forces Analysis
      3. COVID-19 Impact Analysis
  4. SECTION IV: QUANTITATIVE ANALYSIS
    1. Food, Beverages & Nutrition, BY Mesh Size (USD Billion)
      1. 200 mesh
    2. Food, Beverages & Nutrition, BY Grade (USD Billion)
      1. glass
      2. foundry
      3. chemical
    3. Food, Beverages & Nutrition, BY Process (USD Billion)
      1. wet silica sand
      2. dry silica sand
    4. Food, Beverages & Nutrition, BY Application (USD Billion)
      1. glass
      2. hydraulic fracturing
      3. foundry
      4. construction
      5. chemicals
      6. water filtration
      7. paints & coatings
      8. ceramics
      9. others
  5. SECTION V: COMPETITIVE ANALYSIS
    1. Competitive Landscape
      1. Overview
      2. Competitive Analysis
      3. Market share Analysis
      4. Major Growth Strategy in the Food, Beverages & Nutrition
      5. Competitive Benchmarking
      6. Leading Players in Terms of Number of Developments in the Food, Beverages & Nutrition
      7. Key developments and growth strategies
      8. Major Players Financial Matrix
    2. Company Profiles
      1. U.S. Silica Holdings Inc (US)
      2. Fairmount Santrol (US)
      3. Sibelco (BE)
      4. Covia Holdings Corporation (US)
      5. Badger Mining Corporation (US)
      6. Emerge Energy Services LP (US)
      7. Quarzwerke GmbH (DE)
      8. Mitsubishi Corporation RtM Japan Ltd (JP)
    3. Appendix
      1. References
      2. Related Reports
  6. LIST OF FIGURES
    1. MARKET SYNOPSIS
    2. APAC MARKET ANALYSIS BY MESH SIZE
    3. APAC MARKET ANALYSIS BY GRADE
    4. APAC MARKET ANALYSIS BY PROCESS
    5. APAC MARKET ANALYSIS BY APPLICATION
    6. KEY BUYING CRITERIA OF FOOD, BEVERAGES & NUTRITION
    7. RESEARCH PROCESS OF MRFR
    8. DRO ANALYSIS OF FOOD, BEVERAGES & NUTRITION
    9. DRIVERS IMPACT ANALYSIS: FOOD, BEVERAGES & NUTRITION
    10. RESTRAINTS IMPACT ANALYSIS: FOOD, BEVERAGES & NUTRITION
    11. SUPPLY / VALUE CHAIN: FOOD, BEVERAGES & NUTRITION
    12. FOOD, BEVERAGES & NUTRITION, BY MESH SIZE, 2024 (% SHARE)
    13. FOOD, BEVERAGES & NUTRITION, BY MESH SIZE, 2024 TO 2035 (USD Billion)
    14. FOOD, BEVERAGES & NUTRITION, BY GRADE, 2024 (% SHARE)
    15. FOOD, BEVERAGES & NUTRITION, BY GRADE, 2024 TO 2035 (USD Billion)
    16. FOOD, BEVERAGES & NUTRITION, BY PROCESS, 2024 (% SHARE)
    17. FOOD, BEVERAGES & NUTRITION, BY PROCESS, 2024 TO 2035 (USD Billion)
    18. FOOD, BEVERAGES & NUTRITION, BY APPLICATION, 2024 (% SHARE)
    19. FOOD, BEVERAGES & NUTRITION, BY APPLICATION, 2024 TO 2035 (USD Billion)
    20. BENCHMARKING OF MAJOR COMPETITORS
  7. LIST OF TABLES
    1. LIST OF ASSUMPTIONS
    2. APAC MARKET SIZE ESTIMATES; FORECAST
      1. BY MESH SIZE, 2025-2035 (USD Billion)
      2. BY GRADE, 2025-2035 (USD Billion)
      3. BY PROCESS, 2025-2035 (USD Billion)
      4. BY APPLICATION, 2025-2035 (USD Billion)
    3. PRODUCT LAUNCH/PRODUCT DEVELOPMENT/APPROVAL
    4. ACQUISITION/PARTNERSHIP

APAC Food, Beverages & Nutrition Market Segmentation

Food, Beverages & Nutrition By Mesh Size (USD Billion, 2025-2035)

  • < 70 mesh
  • 70-120 mesh
  • 120-200 mesh
  • >200 mesh

Food, Beverages & Nutrition By Grade (USD Billion, 2025-2035)

  • glass
  • foundry
  • chemical

Food, Beverages & Nutrition By Process (USD Billion, 2025-2035)

  • wet silica sand
  • dry silica sand

Food, Beverages & Nutrition By Application (USD Billion, 2025-2035)

  • glass
  • hydraulic fracturing
  • foundry
  • construction
  • chemicals
  • water filtration
  • paints & coatings
  • ceramics
  • others
Infographic

Free Sample Request

Kindly complete the form below to receive a free sample of this Report

Get Free Sample

Customer Strories

“I am very pleased with how market segments have been defined in a relevant way for my purposes (such as "Portable Freezers & refrigerators" and "last-mile"). In general the report is well structured. Thanks very much for your efforts.”

Victoria Milne

Founder

Compare Licence

×
Features License Type
Single User Multiuser License Enterprise User
Price $4,950 $5,950 $7,250
Maximum User Access Limit 1 User Upto 10 Users Unrestricted Access Throughout the Organization
Free Customization
Direct Access to Analyst
Deliverable Format
Platform Access
Discount on Next Purchase 10% 15% 15%
Printable Versions