Segmentation Quick Reference
| Dimension | Sub-Segments | Dominant Segment | Fastest Growing Segment |
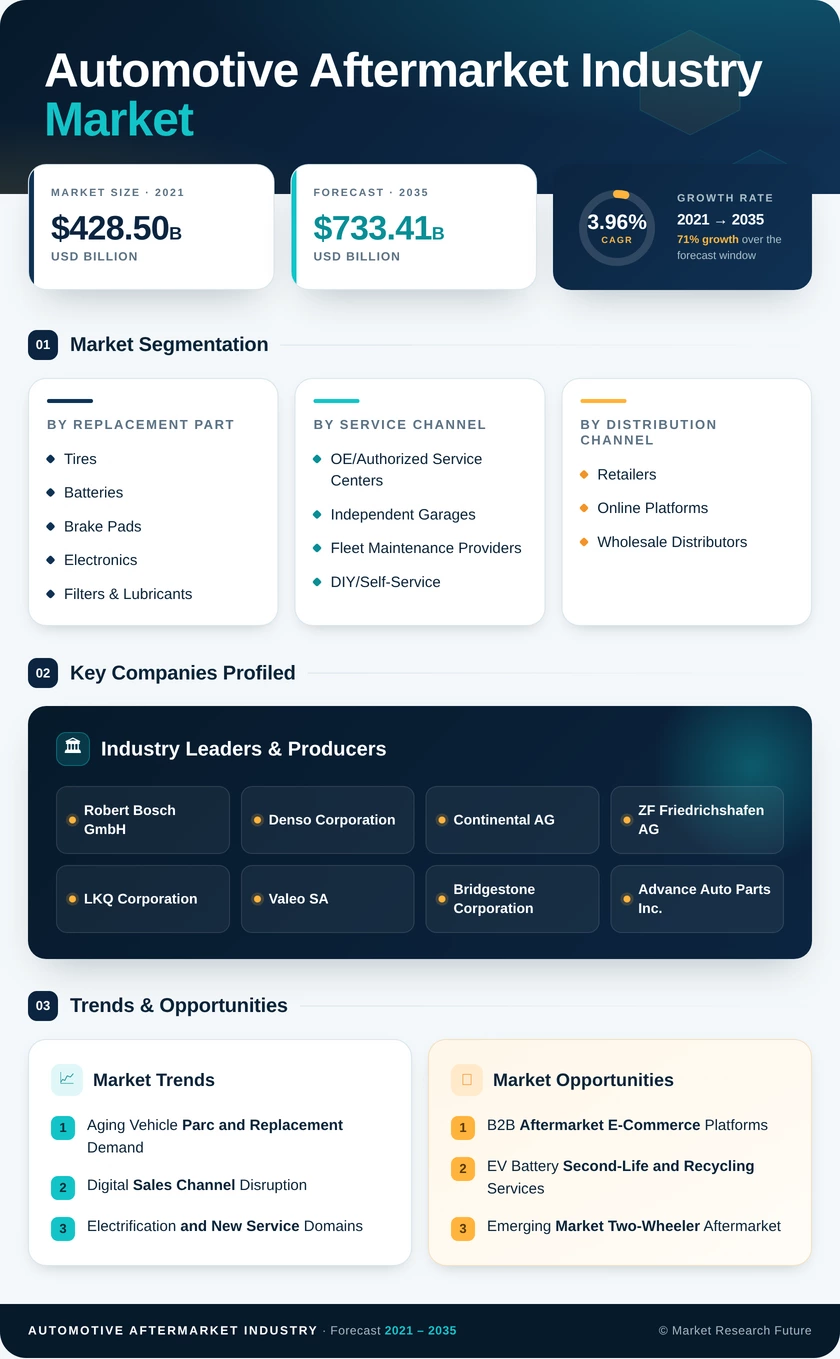
| By Replacement Part | Tires, Automotive Aftermarket Industry, Brake Pads, Electronics, Filters & Lubricants, Other Parts | Tires (23.18% share, 2024) | Electronics (4.01% CAGR) |
| By Service Channel | OE/Authorized Service Centers, Independent Garages, Fleet Maintenance Providers, DIY/Self-Service | Independent Garages (46.48% share, 2024) | Fleet Maintenance Providers (4.10% CAGR) |
| By Distribution Channel | Retailers, Online Platforms, Wholesale Distributors | Retailers (51.35% share, 2024) | Online Platforms (4.04% CAGR) |
| By Vehicle Type | Passenger Cars, Two-Wheelers, Light Commercial Vehicles, Heavy Commercial Vehicles | Passenger Cars (54.84% share, 2024) | Two-Wheelers (4.06% CAGR) |
| By Geography | North America, Europe, Asia-Pacific, South America, Middle East & Africa | Asia-Pacific (40.65% share, 2024) | Asia-Pacific (4.02% CAGR) |
Market Segmentation Overview
By Replacement Part
| Sub-Segment | Key Trend |
| Tires | Seasonal mandates and all-season premium tire adoption driving consistent replacement volumes |
| Automotive Aftermarket Industry | Start-stop technology proliferation and EV auxiliary battery demand expanding addressable base |
| Brake Pads | Safety inspection compliance across regulated markets sustaining stable replacement cycles |
| Electronics | ADAS sensor recalibration and infotainment module upgrades creating high-value service events |
| Filters & Lubricants | Routine maintenance frequency provides recession-resistant demand floor |
| Other Parts | Diverse wear components including belts, hoses, and suspension elements maintain broad-based demand |
Replacement part segmentation reflects the fundamental wear-and-replace dynamics of the global vehicle parc. Tires and filters anchor the volume base, while electronics and batteries represent the growth frontier driven by vehicle electrification and advanced driver assistance system proliferation.
By Service Channel
| Sub-Segment | Key Trend |
| OE/Authorized Service Centers | Retaining EV warranty work and complex ADAS calibration services |
| Independent Garages | Expanding digital capability through cloud-based diagnostic platforms |
| Fleet Maintenance Providers | Deploying telematics-driven predictive scheduling and centralized procurement |
| DIY / Self-Service | Growing through YouTube tutorials, aftermarket e-commerce accessibility, and simpler component designs |
Service channel dynamics reflect the tension between OEM data control and independent shop innovation. Independent garages continue to dominate by unit volume, leveraging cost advantages and local trust relationships built over decades.
By Distribution Channel
| Sub-Segment | Key Trend |
| Retailers (Brick & Mortar) | Investing in omnichannel fulfillment and same-day pickup capabilities |
| Online Platforms | VIN-specific fitment tools and price transparency accelerating B2C and B2B adoption |
| Wholesale Distributors | Consolidating regionally through M&A to achieve logistics scale against digital disruptors |
Distribution channel transformation is the defining structural shift in the aftermarket. Online platforms are compressing traditional multi-tier wholesale models, rewarding operators with integrated inventory and fulfillment systems.
By Vehicle Type
| Sub-Segment | Key Trend |
| Passenger Cars | Aging parc and deferred new-vehicle purchases sustaining high aftermarket spend per unit |
| Two-Wheelers | Rapid motorization in India, ASEAN, and Africa driving fastest volume growth |
| Light Commercial Vehicles | Last-mile delivery fleet expansion generating elevated maintenance frequency |
| Heavy Commercial Vehicles | Highest per-vehicle aftermarket spend due to intensive duty cycles and regulatory compliance |
Vehicle type segmentation highlights the dual growth engine of passenger car parc aging in developed markets and two-wheeler adoption in emerging economies. Commercial vehicle segments deliver disproportionate revenue per unit, making them strategically attractive for aftermarket suppliers and distributors.