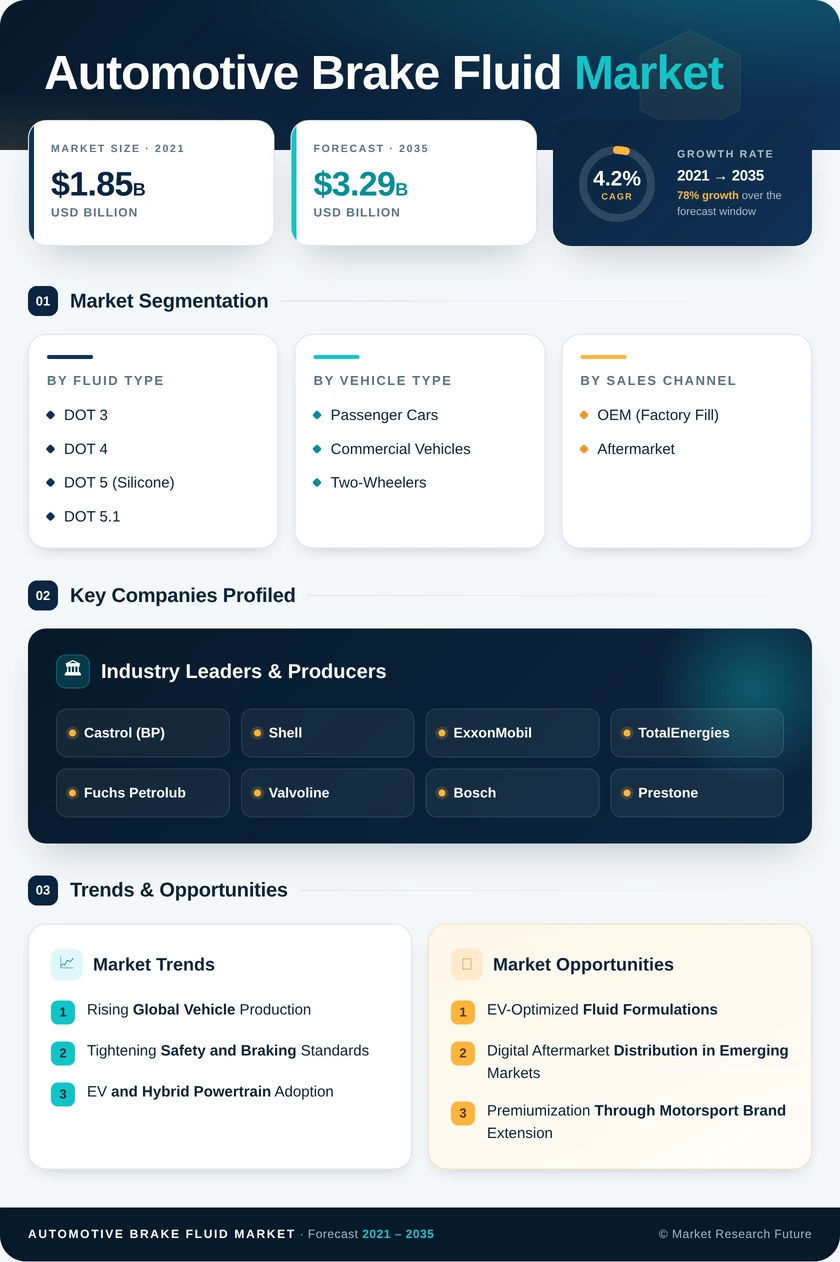
Automotive Brake Fluid Market (2026 - 2035)

ID: MRFR/AT/6105-HCR
100 Pages
Shubham Munde
Last Updated: July 13, 2026
Automotive Brake Fluid Market Research Report Information By Fluid Type (Petroleum and Non Petroleum), By Product Type (Castor Oil Based, Glycol Based, and Silicone Based), By Vehicle Type (Passenger Car, Commercial Vehicle, and Off Road Vehicle), By Sales Channel (OEM and Aftermarket), and By Region (North America, Europe, Asia-Pacific, and Rest Of The World) – Industry Growth & Forecast to 2035
Automotive Brake Fluid Market
Market Size
Forecast Period2026-2035
CAGR (2026-2035)4.2%
2025 Market SizeUSD 2.18 Billion
2035 Market SizeUSD 3.29 Billion
Key Players
Castrol
Shell
ExxonMobil
TotalEnergies
Fuchs Petrolub
Valvoline
Opportunities
  • EV-Optimized Fluid Formulations
  • Digital Aftermarket Distribution in Emerging Markets
  • Premiumization Through Motorsport Brand Extension
  1. 1 Market Overview |
    1. 1.1 Study Assumptions & Market Definition |
    2. 1.2 Scope of the Study |
    3. 1.3 Research Methodology
  2. 2 Market Summary & Key Takeaways
  3. 3 Market Dynamics |
    1. 3.1 Market Drivers Analysis | |
      1. 3.1.1 Rising Global Vehicle Production | |
      2. 3.1.2 Tightening Safety and Braking Standards | |
      3. 3.1.3 EV and Hybrid Powertrain Adoption | |
      4. 3.1.4 Aftermarket Flush and Maintenance Awareness | |
      5. 3.1.5 Commercial-Vehicle Fleet Expansion | |
      6. 3.1.6 Performance and Motorsport Fluid Premiumization | |
      7. 3.1.7 Climate-Driven Thermal Performance Requirements |
    2. 3.2 Market Restraints Analysis | |
      1. 3.2.1 Extended Service Intervals on Modern Vehicles | |
      2. 3.2.2 Reduced Friction-Brake Usage in Electric Vehicles | |
      3. 3.2.3 Counterfeit Fluid Proliferation | |
      4. 3.2.4 Price Sensitivity in Emerging Markets | |
      5. 3.2.5 Raw-Material Cost Volatility for Glycol Ethers |
    3. 3.3 Market Opportunity Analysis | |
      1. 3.3.1 EV-Optimized Fluid Formulations | |
      2. 3.3.2 Digital Aftermarket Distribution in Emerging Markets | |
      3. 3.3.3 Premiumization Through Motorsport Brand Extension | |
      4. 3.3.4 Condition-Monitoring Sensor Integration | |
      5. 3.3.5 Regional Manufacturing in Africa and Southeast Asia |
    4. 3.4 Industry Value Chain Analysis |
    5. 3.5 Porter's Five Forces Analysis
  4. 4 Global Automotive Brake Fluid Market Size & Forecast (2021–2035) |
    1. 4.1 Historical Market Size (2021–2025) |
    2. 4.2 Current & Forecast Market Size (2026–2035) |
    3. 4.3 Market Size by Revenue (USD Billion) |
    4. 4.4 Year-over-Year Growth Analysis
  5. 5 Segmentation Analysis |
    1. 5.1 By Fluid Type | |
      1. 5.1.1 DOT 3 | |
      2. 5.1.2 DOT 4 | |
      3. 5.1.3 DOT 5 (Silicone-Based) | |
      4. 5.1.4 DOT
    2. 5.1 |
    3. 5.2 By Vehicle Type | |
      1. 5.2.1 Passenger Cars | |
      2. 5.2.2 Commercial Vehicles | |
      3. 5.2.3 Two-Wheelers |
    4. 5.3 By Sales Channel | |
      1. 5.3.1 OEM (Factory Fill) | |
      2. 5.3.2 Aftermarket
  6. 6 Regional Analysis |
    1. 6.1 Asia-Pacific | |
      1. 6.1.1 China | |
      2. 6.1.2 India | |
      3. 6.1.3 Japan | |
      4. 6.1.4 South Korea | |
      5. 6.1.5 ASEAN-5 | |
      6. 6.1.6 Rest of Asia-Pacific |
    2. 6.2 Europe | |
      1. 6.2.1 Germany | |
      2. 6.2.2 France | |
      3. 6.2.3 United Kingdom | |
      4. 6.2.4 Italy | |
      5. 6.2.5 Rest of Europe |
    3. 6.3 North America | |
      1. 6.3.1 United States | |
      2. 6.3.2 Canada | |
      3. 6.3.3 Mexico |
    4. 6.4 South America | |
      1. 6.4.1 Brazil | |
      2. 6.4.2 Argentina | |
      3. 6.4.3 Rest of South America |
    5. 6.5 Middle East & Africa | |
      1. 6.5.1 Saudi Arabia | |
      2. 6.5.2 UAE | |
      3. 6.5.3 South Africa | |
      4. 6.5.4 Rest of Middle East & Africa
  7. 7 Competitive Landscape |
    1. 7.1 Market Share Analysis (2025) |
    2. 7.2 Competitive Benchmarking Matrix |
    3. 7.3 Company Profiles | |
      1. 7.3.1 Castrol (BP) | |
      2. 7.3.2 Shell | |
      3. 7.3.3 ExxonMobil | |
      4. 7.3.4 TotalEnergies | |
      5. 7.3.5 Fuchs Petrolub | |
      6. 7.3.6 Valvoline | |
      7. 7.3.7 Bosch | |
      8. 7.3.8 Prestone | |
      9. 7.3.9 Petronas | |
      10. 7.3.10 Repsol
  8. 8 Future Outlook & Strategic Recommendations (2026–2035) |
    1. 8.1 Electrification and Fluid Reformulation |
    2. 8.2 Smart Maintenance and Predictive Analytics |
    3. 8.3 Sustainability and Bio-Based Fluid Development |
    4. 8.4 Consolidation and Vertical Integration
  9. 9 Recent Developments & News
  10. 10 Frequently Asked Questions (FAQs)
  11. 11 Report Scope & Methodology |
    1. 11.1 Study Period & Base Year |
    2. 11.2 Data Sources & Citations |
    3. 11.3 Abbreviations
  12. 12 LIST OF TABLES |
  13. TABLE 1 Global Automotive Brake Fluid Market Size & Forecast, by Revenue (USD Billion), 2021–2035 |
  14. TABLE 2 Global Automotive Brake Fluid Market — Year-over-Year Growth Analysis, 2021–2035 |
  15. TABLE 3 Driver Impact Analysis — Automotive Brake Fluid Market, 2026–2035 |
  16. TABLE 4 Restraint Impact Analysis — Automotive Brake Fluid Market, 2026–2035 |
  17. TABLE 5 Regional Market Share Summary — Automotive Brake Fluid Market, 2025 |
  18. TABLE 6 Asia-Pacific Automotive Brake Fluid Market, by Country, 2021–2035 |
  19. TABLE 7 Europe Automotive Brake Fluid Market, by Country, 2021–2035 |
  20. TABLE 8 North America Automotive Brake Fluid Market, by Country, 2021–2035 |
  21. TABLE 9 South America Automotive Brake Fluid Market, by Country, 2021–2035 |
  22. TABLE 10 Middle East & Africa Automotive Brake Fluid Market, by Country, 2021–2035 |
  23. TABLE 11 Global Automotive Brake Fluid Market Size, by Fluid Type, 2021–2035 (USD Billion) |
  24. TABLE 12 Global Automotive Brake Fluid Market Size, by Vehicle Type, 2021–2035 (USD Billion) |
  25. TABLE 13 Global Automotive Brake Fluid Market Size, by Sales Channel, 2021–2035 (USD Billion) |
  26. TABLE 14 Competitive Benchmarking Matrix — Global Automotive Brake Fluid Market, 2025 |
  27. TABLE 15 Company Profiles — Key Players, Global Automotive Brake Fluid Market |
  28. TABLE 16 Recent Developments & Strategic Announcements, 2023–2025 |
  29. TABLE 17 Report Scope & Methodology — Automotive Brake Fluid Market |
  30. TABLE 18 Detailed Sources and Citations |
  31. TABLE 19 Asia-Pacific Automotive Brake Fluid Market Size, by Fluid Type, 2021–2035 (USD Billion) |
  32. TABLE 20 Asia-Pacific Automotive Brake Fluid Market Size, by Vehicle Type, 2021–2035 (USD Billion) |
  33. TABLE 21 Asia-Pacific Automotive Brake Fluid Market Size, by Sales Channel, 2021–2035 (USD Billion) |
  34. TABLE 22 Europe Automotive Brake Fluid Market Size, by Fluid Type, 2021–2035 (USD Billion) |
  35. TABLE 23 Europe Automotive Brake Fluid Market Size, by Vehicle Type, 2021–2035 (USD Billion) |
  36. TABLE 24 Europe Automotive Brake Fluid Market Size, by Sales Channel, 2021–2035 (USD Billion) |
  37. TABLE 25 North America Automotive Brake Fluid Market Size, by Fluid Type, 2021–2035 (USD Billion) |
  38. TABLE 26 North America Automotive Brake Fluid Market Size, by Vehicle Type, 2021–2035 (USD Billion) |
  39. TABLE 27 North America Automotive Brake Fluid Market Size, by Sales Channel, 2021–2035 (USD Billion) |
  40. TABLE 28 South America Automotive Brake Fluid Market Size, by Fluid Type, 2021–2035 (USD Billion) |
  41. TABLE 29 South America Automotive Brake Fluid Market Size, by Vehicle Type, 2021–2035 (USD Billion) |
  42. TABLE 30 South America Automotive Brake Fluid Market Size, by Sales Channel, 2021–2035 (USD Billion) |
  43. TABLE 31 Middle East & Africa Automotive Brake Fluid Market Size, by Fluid Type, 2021–2035 (USD Billion) |
  44. TABLE 32 Middle East & Africa Automotive Brake Fluid Market Size, by Vehicle Type, 2021–2035 (USD Billion) |
  45. TABLE 33 Middle East & Africa Automotive Brake Fluid Market Size, by Sales Channel, 2021–2035 (USD Billion) |
  46. TABLE 34 China Automotive Brake Fluid Market Size, by Fluid Type, 2021–2035 (USD Billion) |
  47. TABLE 35 China Automotive Brake Fluid Market Size, by Vehicle Type, 2021–2035 (USD Billion) |
  48. TABLE 36 India Automotive Brake Fluid Market Size, by Fluid Type, 2021–2035 (USD Billion) |
  49. TABLE 37 India Automotive Brake Fluid Market Size, by Vehicle Type, 2021–2035 (USD Billion) |
  50. TABLE 38 Japan Automotive Brake Fluid Market Size, by Fluid Type, 2021–2035 (USD Billion) |
  51. TABLE 39 Japan Automotive Brake Fluid Market Size, by Vehicle Type, 2021–2035 (USD Billion) |
  52. TABLE 40 Germany Automotive Brake Fluid Market Size, by Fluid Type, 2021–2035 (USD Billion) |
  53. TABLE 41 Germany Automotive Brake Fluid Market Size, by Vehicle Type, 2021–2035 (USD Billion) |
  54. TABLE 42 United States Automotive Brake Fluid Market Size, by Fluid Type, 2021–2035 (USD Billion) |
  55. TABLE 43 United States Automotive Brake Fluid Market Size, by Vehicle Type, 2021–2035 (USD Billion) |
  56. TABLE 44 Brazil Automotive Brake Fluid Market Size, by Fluid Type, 2021–2035 (USD Billion) |
  57. TABLE 45 Brazil Automotive Brake Fluid Market Size, by Vehicle Type, 2021–2035 (USD Billion) |
  58. TABLE 46 Saudi Arabia Automotive Brake Fluid Market Size, by Fluid Type, 2021–2035 (USD Billion) |
  59. TABLE 47 Saudi Arabia Automotive Brake Fluid Market Size, by Vehicle Type, 2021–2035 (USD Billion)
  60. 13 LIST OF FIGURES |
  61. FIGURE 1 Automotive Brake Fluid Market Dynamics — Drivers, Restraints, Opportunities |
  62. FIGURE 2 Industry Value Chain Analysis — Automotive Brake Fluid Market |
  63. FIGURE 3 Porter's Five Forces Analysis — Automotive Brake Fluid Market |
  64. FIGURE 4 Global Automotive Brake Fluid Market Size Trend (USD Billion), 2021–2035 |
  65. FIGURE 5 Global Automotive Brake Fluid Market Share, by Fluid Type (%), 2025 |
  66. FIGURE 6 Global Automotive Brake Fluid Market Share, by Vehicle Type (%), 2025 |
  67. FIGURE 7 Global Automotive Brake Fluid Market Share, by Sales Channel (%), 2025 |
  68. FIGURE 8 Global Automotive Brake Fluid Market Share, by Region (%), 2025 |
  69. FIGURE 9 Asia-Pacific Automotive Brake Fluid Market Share, by Country (%), 2025 |
  70. FIGURE 10 Europe Automotive Brake Fluid Market Share, by Country (%), 2025 |
  71. FIGURE 11 North America Automotive Brake Fluid Market Share, by Country (%), 2025 |
  72. FIGURE 12 South America Automotive Brake Fluid Market Share, by Country (%), 2025 |
  73. FIGURE 13 Middle East & Africa Automotive Brake Fluid Market Share, by Country (%), 2025 |
  74. FIGURE 14 Competitive Landscape Heat Map — Automotive Brake Fluid Market, 2025

SEGMENTATION QUICK REFERENCE

DimensionSub-SegmentsDominant SegmentFastest Growing Segment
By Fluid TypeDOT 3, DOT 4, DOT 5 (Silicone), DOT 5.1DOT 4 (~48% share)DOT 5.1 (CAGR 5.8%)
By Vehicle TypePassenger Cars, Commercial Vehicles, Two-WheelersPassenger Cars (USD 1.24 B)Commercial Vehicles (CAGR 4.6%)
By Sales ChannelOEM (Factory Fill), AftermarketOEM (~38% share)Aftermarket (CAGR 4.5%)


MARKET SEGMENTATION OVERVIEW

By Fluid Type

Sub-SegmentKey Trend
DOT 3Gradual decline in developed markets; sustained demand in cost-sensitive regions
DOT 4Dominant specification across global OEM platforms; additive-package differentiation
DOT 5 (Silicone)Niche applications in military, classic cars, and corrosion-sensitive environments
DOT 5.1Rapid adoption in performance and EV segments; highest growth trajectory


DOT 4 serves as the industry standard and will maintain its leadership position through 2035, though its share will gradually compress as DOT 5.1 gains ground. The DOT 3 segment's decline is moderated by persistent demand in South Asia and Africa, where price sensitivity remains a primary purchasing criterion.

By Vehicle Type

Sub-SegmentKey Trend
Passenger CarsLargest volume base; aftermarket replacement cycles drive steady demand
Commercial VehiclesHigher per-unit consumption; fleet maintenance schedules ensure predictable demand
Two-WheelersVolume-driven segment concentrated in India and ASEAN markets


Passenger cars represent the largest single demand pool, but commercial vehicles deliver disproportionate value per unit due to larger brake system capacities and more frequent maintenance intervals mandated by fleet operators and regulators.

By Sales Channel

Sub-SegmentKey Trend
OEM (Factory Fill)Tied to vehicle production cycles; specification-driven supplier selection
AftermarketGrowing share driven by expanding global vehicle parc and service awareness


The aftermarket channel is gaining share as the global vehicle parc ages and consumers in emerging markets become more aware of scheduled maintenance requirements. Digital platforms are accelerating aftermarket growth by reducing distribution friction in previously underserved regions.


Download PDF ×

We do not share your information with anyone. However, we may send you emails based on your report interest from time to time. You may contact us at any time to opt-out.