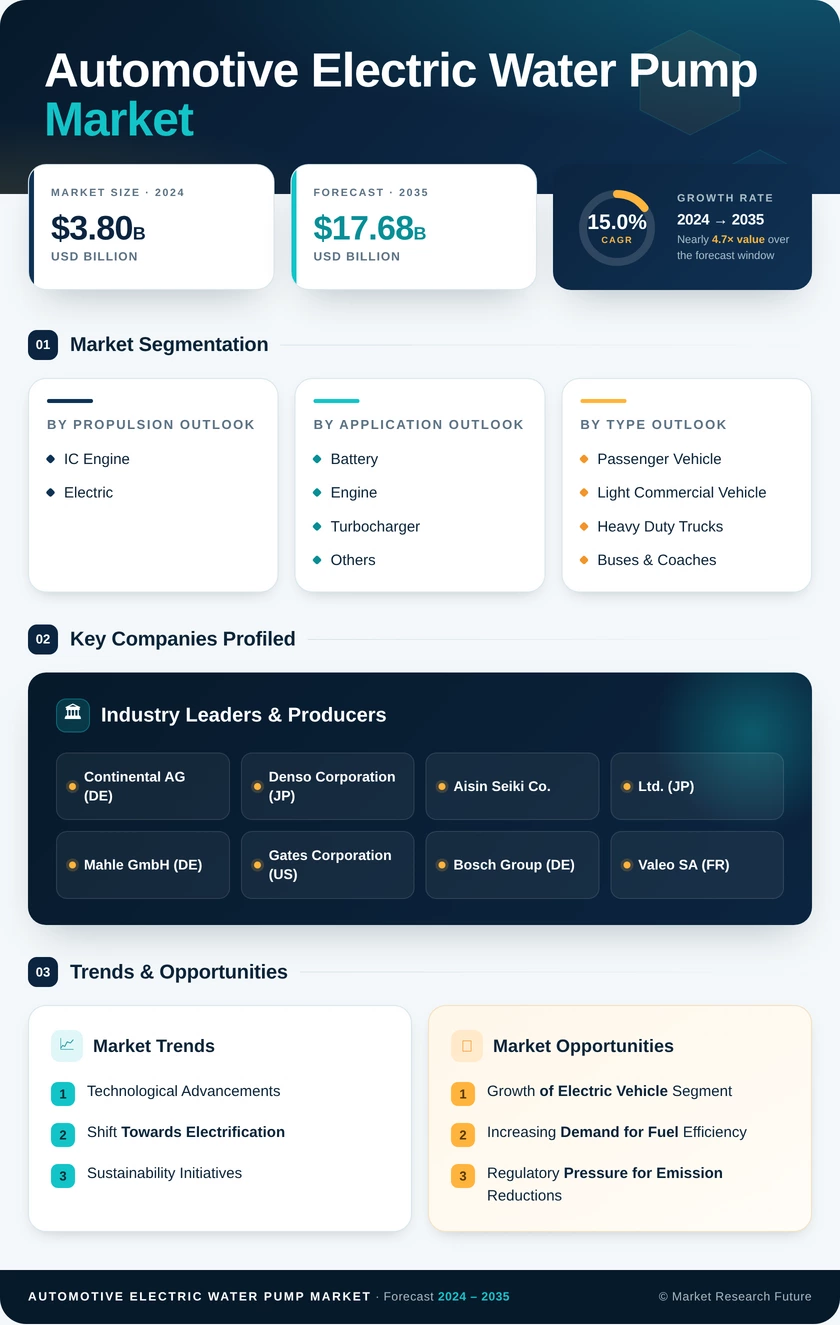
Automotive Electric Water Pump Market (2026 - 2035)

ID: MRFR/AT/20503-HCR
128 Pages
Shubham Munde
Last Updated: August 27, 2026
Automotive Electric Water Pump Market Research Report By Voltage Type (12V and 24V), By Application (Battery, Engine, Turbocharger and Others), By Propulsion (IC Engine (Gasoline, Diesel) and Electric (Battery Electric, Hybrid/Plug-in Hybrid Electric, Fuel-Cell Electric)), By Vehicle Type (Passenger Vehicle, (Hatchback, Sedan, SUVs), Light Commercial Vehicle, Heavy Duty Trucks and Buses & Coaches), By Sales Channel (OEM and Aftermarket) And By Region (North America, Europe, Asia-Pacific, And Rest Of The World) โ€“Market Forecast Till 2035
Automotive Electric Water Pump Market
Market Size
Forecast Period2026-2035
CAGR (2026-2035)12.7%
2025 Market SizeUSD 4.72 Billion
2035 Market SizeUSD 15.61 Billion
Key Players
Aisin Corporation
Robert Bosch GmbH
MAHLE GmbH
Continental AG
Rheinmetall AG
Hanon Systems
Opportunities
  • Integrated Thermal Modules
  • Commercial Vehicle Electrification
  • Emerging Market Localisation
  1. 1 Market Summary |
    1. 1.1 Study Assumptions & Market Definition |
    2. 1.2 Scope of the Study |
    3. 1.3 Research Methodology
  2. 2 Key Report Takeaways |
    1. 2.1 By Technology |
    2. 2.2 By Sector |
    3. 2.3 By Region
  3. 3 Market Size & Forecast (2021โ€“2035) |
    1. 3.1 Historical Market Size (2021โ€“2024) |
    2. 3.2 Base Year Assessment (2025) |
    3. 3.3 Forecast Market Size (2026โ€“2035) |
    4. 3.4 Year-over-Year Growth Analysis
  4. 4 Driver Impact Analysis |
    1. 4.1 Electrified Powertrain Volume |
    2. 4.2 Regulatory Compression on Parasitic Losses |
    3. 4.3 High-Voltage Architecture Migration |
    4. 4.4 Warranty Economics
  5. 5 Restraints Impact Analysis |
    1. 5.1 Magnet Supply Concentration |
    2. 5.2 Reliability and Field Returns
  6. 6 Opportunities |
    1. 6.1 Integrated Thermal Modules |
    2. 6.2 Commercial Vehicle Electrification |
    3. 6.3 Emerging Market Localisation |
    4. 6.4 Predictive Diagnostics as a Service |
    5. 6.5 Aftermarket Replacement Wave
  7. 7 Regional Market Share & Country-Level Analysis |
    1. 7.1 North America | |
      1. 7.1.1 US | |
      2. 7.1.2 Canada | |
      3. 7.1.3 Mexico |
    2. 7.2 Europe | |
      1. 7.2.1 Germany | |
      2. 7.2.2 UK | |
      3. 7.2.3 France | |
      4. 7.2.4 Italy | |
      5. 7.2.5 Spain | |
      6. 7.2.6 Nordic Countries | |
      7. 7.2.7 Russia | |
      8. 7.2.8 Rest of Europe |
    3. 7.3 Asia-Pacific | |
      1. 7.3.1 China | |
      2. 7.3.2 India | |
      3. 7.3.3 Japan | |
      4. 7.3.4 South Korea | |
      5. 7.3.5 ASEAN | |
      6. 7.3.6 Rest of Asia-Pacific |
    4. 7.4 South America | |
      1. 7.4.1 Brazil | |
      2. 7.4.2 Argentina | |
      3. 7.4.3 Rest of South America |
    5. 7.5 Middle East & Africa | |
      1. 7.5.1 Saudi Arabia | |
      2. 7.5.2 UAE | |
      3. 7.5.3 South Africa | |
      4. 7.5.4 Egypt | |
      5. 7.5.5 Rest of Middle East & Africa
  8. 8 Future Outlook (2026โ€“2035) |
    1. 8.1 Software-Defined Thermal Control |
    2. 8.2 Consolidation Around Module Platforms |
    3. 8.3 Electrification Supercycle Mechanics |
    4. 8.4 Circularity and Reporting Obligations
  9. 9 Market Segmentation Analysis |
    1. 9.1 By Application | |
      1. 9.1.1 Engine Cooling | |
      2. 9.1.2 Battery Cooling | |
      3. 9.1.3 Turbo-Charger Cooling | |
      4. 9.1.4 HVAC Systems |
    2. 9.2 By Vehicle Type | |
      1. 9.2.1 Passenger Cars | |
      2. 9.2.2 Light Commercial Vehicles | |
      3. 9.2.3 Medium & Heavy Commercial Vehicles |
    3. 9.3 By Propulsion Type | |
      1. 9.3.1 ICE | |
      2. 9.3.2 BEV | |
      3. 9.3.3 PHEV | |
      4. 9.3.4 HEV | |
      5. 9.3.5 FCEV |
    4. 9.4 By Distribution Channel | |
      1. 9.4.1 Offline | |
      2. 9.4.2 Online
  10. 10 Competitive Landscape |
    1. 10.1 Market Concentration Analysis (2026) |
    2. 10.2 Competitive Benchmarking Matrix |
    3. 10.3 Company Profiles | |
      1. 10.3.1 Aisin Corporation | |
      2. 10.3.2 Robert Bosch GmbH | |
      3. 10.3.3 MAHLE GmbH | |
      4. 10.3.4 Continental AG | |
      5. 10.3.5 Rheinmetall AG (Pierburg) | |
      6. 10.3.6 Hanon Systems | |
      7. 10.3.7 Denso Corporation | |
      8. 10.3.8 Nidec Corporation | |
      9. 10.3.9 Johnson Electric | |
      10. 10.3.10 Concentric AB | |
      11. 10.3.11 Gates Industrial Corporation | |
      12. 10.3.12 Valeo SE
  11. 11 Recent News & Developments
  12. 12 Report Scope & Methodology |
    1. 12.1 Study Period & Base Year |
    2. 12.2 Data Sources & Validation |
    3. 12.3 Abbreviations
  13. 13 Detailed Sources & Citations
  14. 14 Frequently Asked Questions
  15. 15 LIST OF TABLES |
  16. TABLE 1 Global Automotive Electric Water Pump Market Size & Forecast, by Revenue (USD Billion), 2021โ€“2035 |
  17. TABLE 2 Global Market โ€“ Year-over-Year Growth Analysis, 2021โ€“2035 |
  18. TABLE 3 Driver Impact Analysis Matrix, 2026โ€“2035 |
  19. TABLE 4 Restraint Impact Analysis Matrix, 2026โ€“2035 |
  20. TABLE 5 Global Market Size, by Region, 2021โ€“2035 (USD Billion) |
  21. TABLE 6 North America Market Size, by Country, 2021โ€“2035 (USD Billion) |
  22. TABLE 7 Europe Market Size, by Country, 2021โ€“2035 (USD Billion) |
  23. TABLE 8 Asia-Pacific Market Size, by Country, 2021โ€“2035 (USD Billion) |
  24. TABLE 9 South America Market Size, by Country, 2021โ€“2035 (USD Billion) |
  25. TABLE 10 Middle East & Africa Market Size, by Country, 2021โ€“2035 (USD Billion) |
  26. TABLE 11 Global Market Size, by Application, 2021โ€“2035 (USD Billion) |
  27. TABLE 12 Global Market Size, by Vehicle Type, 2021โ€“2035 (USD Billion) |
  28. TABLE 13 Global Market Size, by Propulsion Type, 2021โ€“2035 (USD Billion) |
  29. TABLE 14 Global Market Size, by Distribution Channel, 2021โ€“2035 (USD Billion) |
  30. TABLE 15 North America Market Size, by Application, 2021โ€“2035 (USD Billion) |
  31. TABLE 16 Europe Market Size, by Application, 2021โ€“2035 (USD Billion) |
  32. TABLE 17 Asia-Pacific Market Size, by Application, 2021โ€“2035 (USD Billion) |
  33. TABLE 18 South America Market Size, by Propulsion Type, 2021โ€“2035 (USD Billion) |
  34. TABLE 19 Middle East & Africa Market Size, by Propulsion Type, 2021โ€“2035 (USD Billion) |
  35. TABLE 20 Competitive Benchmarking Matrix, 2026 |
  36. TABLE 21 Company Profiles โ€“ Key Players |
  37. TABLE 22 Recent Developments & Strategic Announcements, 2023โ€“2025 |
  38. TABLE 23 Report Scope & Methodology Summary |
  39. TABLE 24 Detailed Sources & Citations Index
  40. 16 LIST OF FIGURES |
  41. FIGURE 1 Market Dynamics โ€“ Drivers, Restraints & Opportunities Framework |
  42. FIGURE 2 Industry Value Chain Analysis |
  43. FIGURE 3 Porter's Five Forces Analysis |
  44. FIGURE 4 Global Market Size Trend & Forecast, 2021โ€“2035 (USD Billion) |
  45. FIGURE 5 Year-over-Year Growth Trajectory, 2022โ€“2035 (%) |
  46. FIGURE 6 Market Share by Application, 2025 vs 2035 (%) |
  47. FIGURE 7 Market Share by Vehicle Type, 2025 vs 2035 (%) |
  48. FIGURE 8 Market Share by Propulsion Type, 2025 vs 2035 (%) |
  49. FIGURE 9 Market Share by Distribution Channel, 2025 vs 2035 (%) |
  50. FIGURE 10 Regional Market Share Distribution, 2025 (%) |
  51. FIGURE 11 Regional CAGR Comparison, 2026โ€“2035 (%) |
  52. FIGURE 12 Country-Level Growth Heat Map, 2026โ€“2035 |
  53. FIGURE 13 Competitive Landscape โ€“ Revenue Share Positioning, 2026 |
  54. FIGURE 14 Strategic Positioning Matrix โ€“ Capability vs Geographic Reach |
  55. FIGURE 15 Average Selling Price Trend by Application, 2021โ€“2035

Segmentation Quick Reference

DimensionSub-SegmentsDominant SegmentFastest Growing Segment
By ApplicationEngine Cooling, Battery Cooling, Turbo-Charger Cooling, HVAC SystemsEngine CoolingBattery Cooling
By Vehicle TypePassenger Cars, Light Commercial Vehicles, Medium & Heavy Commercial VehiclesPassenger CarsLight Commercial Vehicles
By Propulsion TypeICE, BEV, PHEV, HEV, FCEVICEBEV
By Distribution ChannelOffline, OnlineOfflineOnline
By RegionNorth America, Europe, Asia-Pacific, South America, Middle East & AfricaAsia-PacificAsia-Pacific


Market Segmentation Overview

By Application

Sub-SegmentKey Trend
Engine CoolingDemand-based flow control replaces belt drive to cut parasitic losses under Euro 7 test windows
Battery CoolingHigher charge rates push flow requirements upward; ยฑ2 ยฐC banding becomes a warranty lever
Turbo-Charger CoolingAfter-run circulation protects bearings during heat soak on downsized boosted engines
HVAC SystemsCabin preconditioning while parked extends duty hours, especially in cold climates


Application remains the sharpest lens on this market because duty cycle, not vehicle badge, determines specification. Engine cooling still funds the industry today; battery cooling determines who leads it in 2035.

By Vehicle Type

Sub-SegmentKey Trend
Passenger CarsMulti-circuit architectures lift per-vehicle pump count from one to three or four
Light Commercial VehiclesLast-mile delivery electrification drives high-duty-cycle specifications
Medium & Heavy Commercial VehiclesMegawatt charging standards force redundant dual-pump configurations


Passenger cars supply volume, but commercial platforms deliver margin. Uptime economics let heavy-duty buyers accept redundancy costs that passenger programmes reject outright.

By Propulsion Type

Sub-SegmentKey Trend
ICERetrofit of electric circulation onto existing engine families as a low-cost compliance lever
BEVHighest per-vehicle content and average selling price across all propulsion classes
PHEVDual thermal domains require independent engine and pack circulation loops
HEVSustained Japanese and North American volume keeps hybrid content growing
FCEVStack and humidifier cooling creates niche demand in heavy commercial applications


Propulsion mix drives revenue quality more than revenue volume. A battery electric platform generates roughly double the pump revenue of a comparable conventional vehicle.

By Distribution Channel

Sub-SegmentKey Trend
OfflineOEM direct supply and franchised dealer networks retain first-fit and warranty volume
OnlineIndependent workshop e-procurement accelerates as electrified vehicles age out of warranty


Channel structure will shift more slowly than segment commentary often suggests. First-fit supply stays contractual and offline; the online opening sits almost entirely in replacement demand.




Download PDF ×

We do not share your information with anyone. However, we may send you emails based on your report interest from time to time. You may contact us at any time to opt-out.