Segmentation Quick Reference
| Dimension | Sub-Segments | Dominant Segment | Fastest Growing Segment |
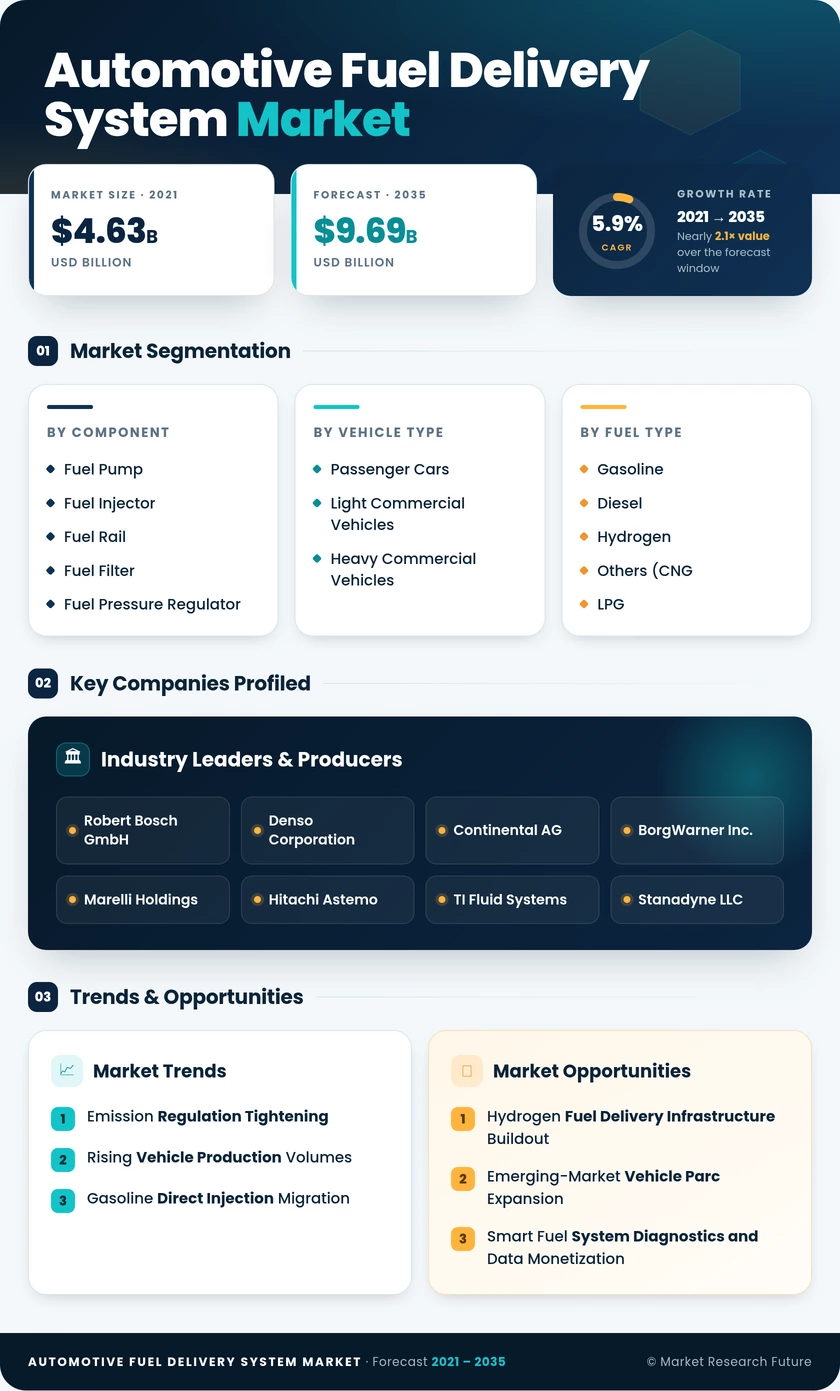
| Component | Fuel Pump, Fuel Injector, Fuel Rail, Fuel Filter, Fuel Pressure Regulator, Others | Fuel Pump | Fuel Injector |
| Vehicle Type | Passenger Cars, Light Commercial Vehicles, Heavy Commercial Vehicles | Passenger Cars | Light Commercial Vehicles |
| Fuel Type | Gasoline, Diesel, Hydrogen, Others (CNG, LPG, Flex-Fuel) | Gasoline | Hydrogen |
| Delivery Method | Gasoline Direct Injection, Port Fuel Injection, Common Rail DI (Diesel), Others | Gasoline Direct Injection | Others (Hydrogen DI, Dual Injection) |
| Distribution Channel | OEM (Factory-Fitted), Aftermarket (Replacement) | OEM (Factory-Fitted) | Aftermarket (Replacement) |
| Geography | North America, Europe, Asia-Pacific, South America, Middle East & Africa | Asia-Pacific | Asia-Pacific |
Market Segmentation Overview
By Component
| Sub-Segment | Key Trend |
| Fuel Pump | Shift to high-pressure electric in-tank variants for GDI and turbo engines |
| Fuel Injector | Piezoelectric injectors are gaining share for multi-event injection strategies |
| Fuel Rail | Lightweight stainless-steel designs replacing aluminum for hydrogen compatibility |
| Fuel Filter | Extended-life media filters reduce replacement frequency to 60,000+ km |
| Fuel Pressure Regulator | Electronic regulators enabling closed-loop fuel pressure management |
| Others (Lines, Tanks, Sensors) | Smart sensors integrating fuel-quality monitoring for flex-fuel readiness |
Fuel pumps and injectors together account for over half of total component-level revenue, reflecting their critical role in determining combustion efficiency and emission performance.
By Vehicle Type
| Sub-Segment | Key Trend |
| Passenger Cars | GDI adoption is exceeding 50% of new models in Europe and North America |
| Light Commercial Vehicles | ICE-dominant last-mile fleets requiring high-durability fuel modules |
| Heavy Commercial Vehicles | Diesel common-rail upgrades and emerging hydrogen dual-fuel configurations |
Passenger cars remain the volume anchor, while light commercial vehicles offer above-average growth as e-commerce logistics demand keeps ICE delivery vans in production pipelines through 2035.
By Fuel Type
| Sub-Segment | Key Trend |
| Gasoline | Turbo-downsizing driving demand for 350-bar injection systems |
| Diesel | Euro 7 compliance is pushing for cleaner common-rail architectures |
| Hydrogen | 700-bar fuel delivery modules entering series production for FC trucks |
| Others (CNG, LPG, Flex-Fuel) | Ethanol-blending mandates in Brazil and India are expanding flex-fuel hardware |
Gasoline systems maintain the largest revenue base, but hydrogen delivery hardware commands the highest average selling price per unit and the fastest CAGR through 2035.
By Delivery Method
| Sub-Segment | Key Trend |
| Gasoline Direct Injection | OEM specification rates are rising with each new vehicle platform generation |
| Port Fuel Injection | Retains dominance in sub-1.5 L naturally aspirated emerging-market engines |
| Common Rail Direct Injection (Diesel) | Incremental precision upgrades for Stage V/Euro 7 diesel compliance |
| Others (Hydrogen DI, Dual Injection) | Dual-injection systems combining PFI and GDI for particulate reduction |
GDI leads by revenue share and is the primary technology enabler for meeting tightening emission mandates across mature automotive markets.
By Distribution Channel
| Sub-Segment | Key Trend |
| OEM (Factory-Fitted) | Platform standardization reduces part numbers while increasing per-unit value |
| Aftermarket (Replacement) | E-commerce distribution and aging vehicle parc are driving double-digit channel growth |
The OEM channel dominates by share, but the aftermarket channel's faster growth rate reflects the global trend of extending vehicle lifecycles well beyond original warranty periods.