Battery Energy Storage System (BESS) Market (2026 - 2035)

Battery Energy Storage System (BESS) Market Size, Share & Growth Analysis Report By Battery Type (Lithium-Ion, Lithium Iron Phosphate (LFP), Others (NMC, NCA, Flow, Sodium-Ion)), By Connection Type (On-Grid, Off-Grid), By Component (Battery Pack & Racks, Power Conversion System, Others (EMS Software, BOS, Thermal Management)), By Energy Capacity Range (Below 100 MWh, 101โ€“500 MWh, Above 500 MWh), By End-User Application (Utility, Residential, Others (C&I, Telecom, EV Charging)) and By Regional (North America, Europe, South America, Asia Pacific, Middle East and Africa) โ€“ Industry Growth & Forecast to 2035
ID: MRFR/EnP/19162-CR
128 Pages
Chitranshi Jaiswal
Last Updated: June 29, 2026
Battery Energy Storage System (BESS) Market
Market Size
Forecast Period2026-2035
CAGR (2026-2035)15.8%
2025 Market SizeUSD 82.80 Billion
2035 Market SizeUSD 363.50 Billion
Key Players
CATL
Tesla Energy
Samsung SDI
LG Energy Solution
Fluence Energy
Sungrow Power Supply
Opportunities
  • Long-Duration Storage Beyond Four Hours
  • Emerging-Market Electrification in Sub-Saharan Africa and Southeast Asia
  • Storage-as-a-Service and Energy-Management Platform Economics

Battery Energy Storage Systems Market Summary

The Battery Energy Storage Systems Market reached an estimated USD 82.80 billion in 2025 and is projected to grow from USD 97.10 billion in 2026 to USD 363.50 billion by 2035, registering a CAGR of 15.8% during the forecast period. Two policy catalysts anchor this trajectory: the Inflation Reduction Act's standalone storage investment tax credit in the United States and the European Union's Net-Zero Industry Act, which together have underwritten multi-gigawatt procurement pipelines across both continents [1][8]. These mandates converted large-scale battery storage from a grid-edge experiment into a bankable infrastructure class practically overnight.

A generational technology shift is underway. Lead-acid and pumped-hydro systems that once dominated stationary storage are yielding to lithium-ion and lithium iron phosphate chemistries that offer faster response, modular scalability, and rapidly falling unit economics. BloombergNEF estimates that lithium-ion pack prices declined by more than 20% year-on-year in 2024, pushing four-hour system costs below USD 150 per kilowatt-hour in several tender markets [11]. Utility procurers now treat the Battery Energy Storage Systems Market as a capacity resource rather than a pilot technology.

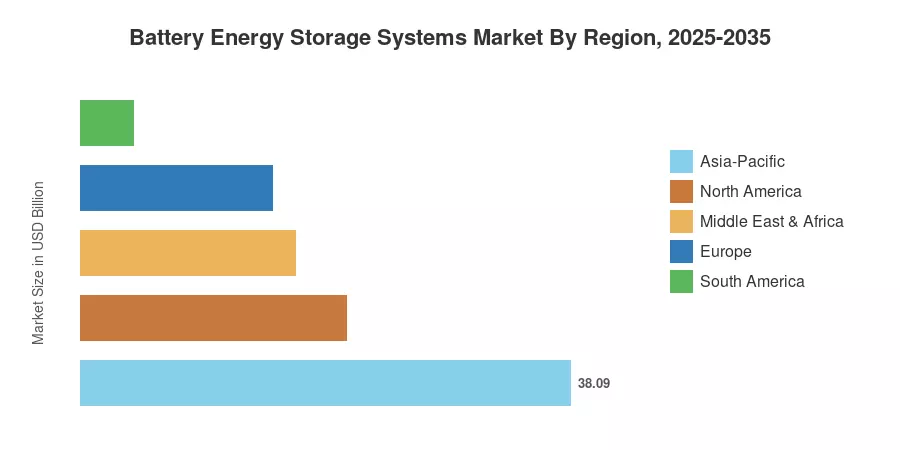
Asia-Pacific commands roughly 46% of the Battery Energy Storage Systems Market, driven by China's dominance in cell manufacturing and aggressive provincial procurement targets [16]. The Middle East & Africa region is the fastest-growing geography at a projected 20.2% CAGR, fueled by Saudi Arabia's Vision 2030 storage mandates and South Africa's loadshedding-driven demand [14]. North America holds the second-largest share at approximately 25%, anchored by interconnection-queue growth and IRA-linked tax incentives [1]. As grid-forming inverter requirements expand revenue streams beyond simple energy arbitrage, the Battery Energy Storage Systems Market is poised to enter a sustained buildout phase through 2035.

ย 

Key Report Takeaways

โ€ข By Technology (Battery Type)

  • Lithium-ion batteries held an 82% share of the Battery Energy Storage Systems Market in 2025, reflecting the chemistry's dominance across utility and commercial applications.
  • Lithium Iron Phosphate (LFP) is the fastest-expanding battery segment, forecast at a 20.0% CAGR through 2035, as developers favor its superior cycle life and lower thermal risk.

โ€ข By End User

  • Utility-scale deployments captured approximately 52% of the Battery Energy Storage Systems Market in 2025.
  • Residential storage is advancing at the fastest pace among end-user segments, with an estimated 17.8% CAGR to 2035.

ย 

โ€ข By Application

  • On-grid installations represented 73% of connection-type revenue in 2025, while off-grid applications are expected to expand at 19.5% CAGR.

โ€ข By Region

  • Asia-Pacific led with a 46% regional share in 2025, while the Middle East & Africa region is forecast to grow at 20.2% CAGR.
  • North America accounted for roughly USD 20.70 billion in 2025 market value.

ย 

Market Size and Forecast (2021โ€“2035)

Market Research Future's sizing methodology combines bottom-up revenue aggregation from tier-one cell manufacturers, EPC contractors, and system integrators with top-down cross-validation against government deployment registries and utility interconnection filings. Historical figures (2021โ€“2024) draw on audited annual reports and customs-trade data; forecast values (2026โ€“2035) apply a scenario-weighted model incorporating policy pipeline analysis, commodity-price trajectories, and disclosed project backlogs [2][6].
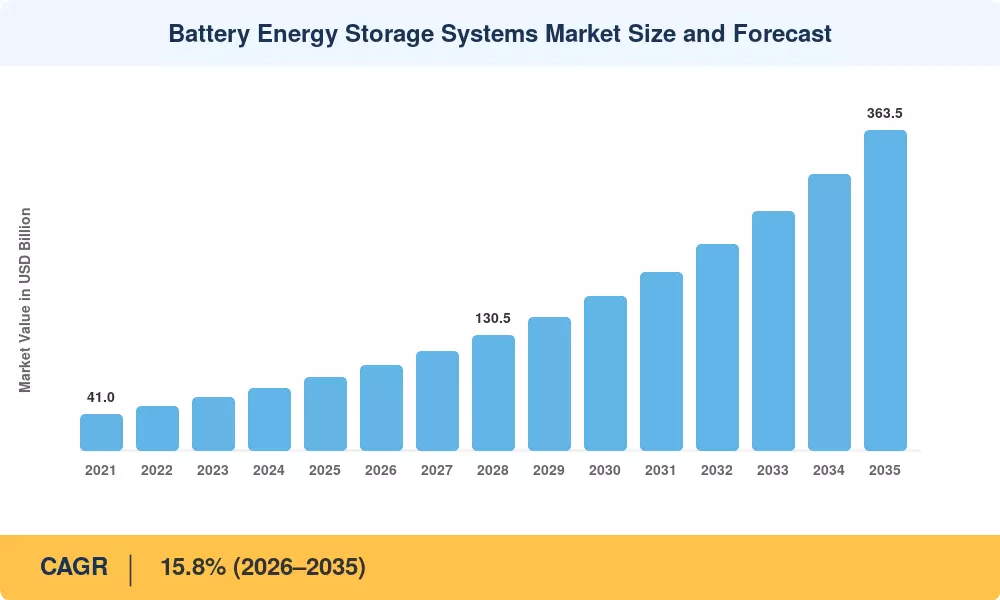
Battery Energy Storage Systems Market Size and Forecast
Our Impact
Enabled $4.3B Revenue Impact for Fortune 500 and Leading Multinationals
Partnering with 2000+ Global Organizations Each Year
30K+ Citations by Top-Tier Firms in the Industry

Driver Impact Analysis

Driver ~% Impact on CAGR Geographic Relevance Impact Timeline
Lithium-ion cell cost declines 22% Global Short-term (โ‰ค2 yr)
Renewable portfolio & storage mandates 20% North America, EU Medium-term (2โ€“4 yr)
Grid-modernization capital programs 16% Asia-Pacific, North America Medium-term (2โ€“4 yr)
Data-center load growth 14% North America, Europe Medium-term (2โ€“4 yr)
Solar-plus-storage PPA parity 12% Australia, Latin America, MEA Short-term (โ‰ค2 yr)
Supply-chain reshoring incentives 9% North America, EU Long-term (โ‰ฅ4 yr)
EV-to-grid and second-life battery programs 7% Global Long-term (โ‰ฅ4 yr)

ย 

Lithium-Ion Cell Cost Declines

According to resources, pack-level prices dropped below USD 140/kWh in Q4 2024, a 22% decrease that collapsed levelized-storage-cost benchmarks more quickly than most utility planning models predicted [11]. At the manufacturing gate, Chinese LFP cell quotations fell below USD 55/kWh, establishing a price floor that makes four-hour systems competitive with peaking gas turbines in the majority of OECD markets. Because it simultaneously increases project IRRs for developers and reduces ratepayer impact for regulated utilities, this pricing trajectory is the single biggest accelerant for the battery energy storage systems market.

ย 

Renewable Portfolio and Storage Mandates

Together, the EU's Net-Zero Industry Act, the IRA's standalone storage ITC, and California's AB 2514 successor obligations ensure over 80 GWh of yearly purchase through 2030 [1][8]. By offering long-term revenue certainty, these products reduce the risk associated with financing. Developers are now able to stack arbitrage, capacity, and ancillary-service profits in wholesale markets thanks to FERC Order 841, a regulatory framework that has become the standard worldwide [5].

ย 

Grid-Modernization Capital Programs

The U.S. Department of Energy allocated USD 3.5 billion under the Grid Resilience and Innovation Partnerships (GRIP) program, with a significant share earmarked for storage-integrated distribution upgrades [3]. In Asia-Pacific, India's Viability Gap Funding scheme provides up to 40% capital subsidy for battery projects that support state-level renewable procurement obligations [13]. These public-capital commitments signal to private lenders that storage is an investable asset class, accelerating financial close timelines across the Battery Energy Storage Systems Market.

Data-Center Load Growth

Hyperscale operators added an estimated 15 GW of contracted load in 2024, much of it requiring 24/7 carbon-free energy commitments that cannot be met with intermittent renewables alone [18]. On-site and campus-adjacent battery systems are emerging as a preferred solution for shaping solar and wind generation into firm supply profiles. This demand vector introduces a high-creditworthiness off-taker class into the Battery Energy Storage Systems Market, which improves bankability and compresses debt spreads.

ย 

Restraints Impact Analysis

The restraint estimates below are directional; they represent headwinds that may moderate growth relative to an unconstrained scenario but do not mechanically subtract from the forecast CAGR [2].

Restraint ~% Negative Impact on CAGR Geographic Relevance Impact Timeline
Supply-chain concentration risk (cathode & anode materials) โ€“18% Global Medium-term (2โ€“4 yr)
Permitting and interconnection delays โ€“16% North America, Europe Short-term (โ‰ค2 yr)
Fire-safety and insurance challenges โ€“14% Global Short-term (โ‰ค2 yr)
Grid-interconnection queue congestion โ€“12% United States, Australia Medium-term (2โ€“4 yr)
Trade-policy and tariff uncertainty โ€“10% North America, EU Long-term (โ‰ฅ4 yr)

ย 

Supply-Chain Concentration Risk

Over 75% of the world's capacity for producing lithium-ion cells is controlled by China, which also controls the upstream processing of graphite, cobalt, and lithium [19]. New gigafactory capacity takes three to five years to attain full utilization, notwithstanding reshoring measures in the EU and the United States. Geopolitical, logistical, or regulatory disruptions could result in spot shortages that postpone project completion and raise the weighted-average system cost of the Battery Energy Storage Systems Market.

ย 

Permitting and Interconnection Delays

In the United States, the average time from interconnection application to commercial operation for a battery project exceeded 42 months in 2024, according to Lawrence Berkeley National Laboratory data [5]. European permitting timelines are similarly protracted despite the EU's accelerated-permitting directive. These procedural bottlenecks effectively cap annual deployment volumes regardless of capital availability and represent the most binding near-term constraint on the Battery Energy Storage Systems Market.

Fire-Safety and Insurance Challenges

Insurer monitoring has increased as a result of high-profile thermal runaway occurrences, such as the 2024 Moss Landing, California disaster. Before providing property coverage, underwriters increasingly demand UL 9540A testing at the cell, module, and system levels [20]. Between 2022 and 2024, premium costs for big BESS assets increased by roughly 30%, increasing the project-level cost of capital by 50โ€“80 basis points and deterring marginal developers.

ย 

ย 

Battery Energy Storage Systems Market Opportunities

Long-Duration Storage Beyond Four Hours

Tender specifications are shifting from four-hour to eight- and twelve-hour durations, creating a premium market segment for iron-air, zinc-bromine, and advanced LFP architectures [4]. Developers that demonstrate bankable performance data for longer-duration systems will capture a pricing premium while addressing the "solar duck curve" that four-hour batteries alone cannot fully solve.

Emerging-Market Electrification in Sub-Saharan Africa and Southeast Asia

Off-grid and mini-grid BESS deployments in sub-Saharan Africa and island ASEAN nations represent a largely untapped volume opportunity [14]. The World Bank's Scaling Solar program and the African Development Bank's Desert-to-Power initiative are channeling concessional capital into solar-plus-storage procurement, offering project developers attractive risk-adjusted returns in markets with unmet demand exceeding 100 GW.

Storage-as-a-Service and Energy-Management Platform Economics

Cloud-based energy-management platforms are enabling asset owners to monetize flexibility servicesโ€”frequency regulation, voltage support, synthetic inertiaโ€”through automated bidding algorithms [7]. This software layer transforms the Battery Energy Storage Systems Market from a hardware-centric business into a recurring-revenue platform play, attracting venture capital and technology-sector entrants.

Second-Life EV Batteries for Stationary Applications

By 2030, an estimated 150 GWh of retired electric-vehicle packs will be available for repurposing into lower-duty stationary storage, according to [19]. Re-certification and module-level testing protocols are maturing, and pilot projects in Germany and Japan have demonstrated 80% retained capacity at half the cost of new cells.

Data-Center and AI-Load Firming

The explosive growth of AI training and inference workloads is driving 24/7 clean-energy procurement mandates from hyperscale operators [18]. Co-locating battery storage with on-site renewable generation allows data-center operators to meet sustainability commitments without relying solely on grid powerโ€”a use case that is rapidly expanding the addressable market for Battery Energy Storage Systems Market.

ย 

Battery Energy Storage Systems Market Future Outlook

AI-Driven Grid Orchestration

Machine-learning algorithms are moving from pilot to production in grid-scale battery dispatch. By 2028, autonomous optimization platforms are expected to manage more than 40% of global BESS capacity, maximizing revenue across arbitrage, ancillary, and capacity markets without human intervention [7]. This shift will compress operating costs and attract software-first business models into the Battery Energy Storage Systems Market.

Electrification Supercycle and Load-Shape Transformation

Rapid electrification of transport, heating, and industrial processes will reshape daily load curves, creating steeper ramps and deeper troughs that only fast-response storage can manage [18]. DNV projects that global electricity demand will increase by 60% between 2025 and 2035, with battery storage absorbing a growing share of incremental flexibility requirements [18]. The Battery Energy Storage Systems Market stands to benefit disproportionately from this structural demand shift.

Circular Economy and Supply-Chain Resilience

EU Battery Regulation requirements for recycled-content minimums (12% cobalt, 4% lithium by 2030) will create a secondary-materials economy that reduces virgin mining dependency [8]. Closed-loop recycling partnerships between cell manufacturers and storage developers will improve lifecycle sustainability metrics, which increasingly influence utility procurement scoring in the Battery Energy Storage Systems Market [19].

ESG Reporting and Green-Taxonomy Alignment

The Battery Energy Storage Systems Market will benefit from expanding ESG disclosure requirements that incentivize corporate and utility buyers to demonstrate quantifiable emissions reductions [18]. EU Taxonomy-aligned investment flows and SEC climate-disclosure rules in the United States will channel institutional capital toward storage assets that meet stringent environmental-performance thresholds. By 2030, green-bond issuance linked to storage projects is expected to exceed USD 25 billion annually, according to DNV projections [18].

ย 

Battery Energy Storage Systems Market Segmentation

By Battery Type

Segment Key Metric Primary Demand Driver
Lithium-Ion 82% share (2025) Cost leadership; proven bankability across utility and C&I
Lithium Iron Phosphate (LFP) 20.0% CAGR Superior cycle life; lower thermal-runaway risk
Others (NMC, NCA, Flow, Sodium-Ion) USD 4.15 Billion (2025) Niche long-duration and high-density applications

ย 

Lithium-ion remains the default chemistry for the Battery Energy Storage Systems Market, commanding procurement across utility, commercial, and residential segments. Chinese manufacturersโ€”led by CATL and BYDโ€”have scaled LFP production to the point where cell-level costs undercut NMC by 15โ€“20%, making LFP the chemistry of choice for stationary four-hour systems [9]. Flow batteries and emerging sodium-ion technologies occupy a smaller but strategically important niche: iron-flow and vanadium-redox systems are winning tenders for eight-to-twelve-hour durations where lithium-ion economics weaken [4].

By Connection Type

Segment Key Metric Primary Demand Driver
On-Grid 73% share (2025) Utility-scale procurement; wholesale-market participation
Off-Grid 19.5% CAGR Island electrification; mining and telecom microgrids

ย 

On-grid installations dominate because wholesale-market revenuesโ€”capacity payments, arbitrage, and frequency responseโ€”provide diversified income streams that improve project bankability. Off-grid storage is gaining momentum in regions with unreliable grid infrastructure, where battery-plus-solar microgrids displace diesel generation at lower lifecycle cost [14].

By Component

Segment Key Metric Primary Demand Driver
Battery Pack & Racks 58% share (2025) Core hardware; volume-driven cost decline
Power Conversion System 16.4% CAGR Grid-forming inverter mandates bidirectional capability
Others (EMS Software, BOS, Thermal Mgmt.) 18.2% CAGR (Software) Automated dispatch optimization; stacked-revenue capture

ย 

Battery packs and racks naturally represent the largest cost component, though their share is declining as system-level integration costs compress faster than cell costs. Energy-management software is the fastest-growing component category because it directly enables the multi-market revenue stacking that underpins modern BESS business cases [7].

By Energy Capacity Range

Segment Key Metric Primary Demand Driver
Below 100 MWh 18% share (2025) Commercial and industrial peak shaving; residential aggregation
101โ€“500 MWh 49% share (2025) Utility procurement sweet spot; standardized EPC packages
Above 500 MWh 19.1% CAGR Gigawatt-scale renewable-integration hubs; transmission deferral

ย 

Projects in the 101โ€“500 MWh range represent the workhorse segment of the Battery Energy Storage Systems Market, benefiting from standardized engineering designs that reduce per-MWh capital costs. The above-500 MWh segment is growing fastest as developers pursue economies of scale and grid operators increasingly tender for large-block dispatchable capacity [2].

By End-User Application

Segment Key Metric Primary Demand Driver
Utility 52% share (2025) Capacity obligations; renewable-integration mandates
Residential 17.8% CAGR Retail-rate arbitrage; backup-power resilience
Others (C&I, Telecom, EV Charging) USD 16.60 Billion (2025) Demand-charge management; fleet-charging load smoothing

ย 

Utility-scale systems represent the largest deployment category, with procurement driven by state-level storage mandates and wholesale-market capacity obligations [5]. Residential storage is the fastest-growing end-user segment in the Battery Energy Storage Systems Market, propelled by rising retail electricity prices and homeowner demand for backup power during extreme-weather events [2].

ย 

Regional Market Share Analysis

Region Key Metric Primary Investment Themes
Asia-Pacific 46% share (2025) Cell manufacturing scale; provincial storage mandates
North America USD 20.70 Billion (2025) IRA tax credits; grid-resilience spending
Europe 18% share (2025) Net-Zero Industry Act; offshore-wind pairing
South America 5.0% share (2025) Solar-plus-storage PPAs; mining-sector microgrids
Middle East & Africa 20.2% CAGR (2026โ€“2035) Vision 2030; loadshedding mitigation; green hydrogen
Total USD 82.80 Billion (2025) โ€”

The Battery Energy Storage Systems Market is geographically concentrated but is diversifying rapidly. Asia-Pacific's manufacturing dominance and North America's policy-driven procurement underpin established markets, while the Middle East & Africa and South America are attracting first-mover investment backed by sovereign development goals.

ย 

North America

Country Key Metric Key Driver
United States 78% of regional share IRA standalone storage ITC; FERC Order 841 [5]
Canada 14.8% CAGR Alberta capacity market reforms; Ontario grid-modernization [6]
Mexico USD 0.95 Billion (2025) CFE grid-stabilization tenders; industrial self-supply

ย 

The United States accounts for the vast majority of North American BESS procurement, with California, Texas, and Arizona leading interconnection-queue volume. FERC Order 841 standardized wholesale-market participation rules for storage, unlocking stacked revenue streams that improve project economics [5]. Canada's Alberta Electric System Operator introduced capacity-market mechanisms that incentivize four-hour battery bids, while Mexico's CFE has tendered grid-scale projects along the Baja California interconnection corridor.

Europe

Country Key Metric Key Driver
Germany 28% of the regional share Energiewende phase-out support; C&I flexibility [8]
United Kingdom 15.6% CAGR Capacity Market T-4 auctions; frequency-response contracts [6]
France USD 1.85 Billion (2025) Nuclear flexibility pairing; RTE grid plan [8]
Italy 14.9% CAGR PNRR-funded island microgrids; Terna grid plan
Spain 12% of regional share Solar oversupply curtailment; ancillary-service reforms [12]
Nordic Countries 15.2% CAGR Hydro-battery hybrid optimization; data-center growth [18]
Russia USD 0.35 Billion (2025) Remote grid stabilization; Arctic off-grid supply [6]
Rest of Europe 10% of the regional share Poland coal-phase-out storage tenders; Balkan grid integration [8]

ย 

Germany's Battery Energy Storage Systems Market benefits from high industrial electricity prices that make behind-the-meter storage economically attractive for manufacturing facilities. The United Kingdom's Capacity Market continues to award multi-year contracts to battery assets, providing revenue visibility that supports project finance [6]. Southern European marketsโ€”Spain, Italy, and Greeceโ€”are adding storage to manage solar-heavy generation portfolios and reduce curtailment [12].

Asia-Pacific

Country Key Metric Key Driver
China 58% of regional share Provincial mandates; vertically integrated supply chain [16]
India 19.4% CAGR Viability Gap Funding; state DISCOM procurement [13]
Japan USD 3.90 Billion (2025) Post-Fukushima grid resilience; FIT-to-FIP transition [12]
South Korea 14.8% CAGR RE3020 targets; ESS safety-regulation refresh
ASEAN 18.5% CAGR Island-grid electrification; Thailand PDP 2024 [4]
Rest of Asia-Pacific 8% of regional share Australia NEM capacity investment scheme; Taiwan offshore wind [12]

ย 

China installed more grid-connected battery storage in 2024 than the rest of the world combined, driven by provincial mandates requiring renewable developers to pair 10โ€“20% of rated capacity with storage [16]. India's National Energy Storage Mission and Viability Gap Funding scheme have catalyzed a pipeline exceeding 15 GWh of tendered capacity [13]. Japan's Battery Energy Storage Systems Market is maturing around grid-resilience use cases following successive typhoon-related outages, while Australia's National Electricity Market reform introduced a Capacity Investment Scheme specifically designed for dispatchable storage [12].

South America

Country Key Metric Key Driver
Brazil 48% of regional share ANEEL distributed-generation reforms; commercial self-supply
Argentina 16.7% CAGR Lithium-value-chain integration; Vaca Muerta hybrid projects [4]
Rest of South America USD 1.10 Billion (2025) Chile solar-plus-storage PPAs; Colombia grid-reliability tenders [12]

ย 

Chile has demonstrated solar-plus-storage PPA pricing below USD 30/MWh, proving that four-hour batteries can deliver firm evening-peak supply in high-irradiance markets [12]. Brazil's evolving distributed-generation regulations are creating commercial-scale storage demand as net-metering credits phase down. Argentina's lithium mining boom positions the country as both a supply-chain participant and a domestic consumer of battery storage technology.

Middle East & Africa

Country Key Metric Key Driver
Saudi Arabia 35% of regional share Vision 2030 renewable-storage targets; NEOM smart-city procurement [14]
UAE 17.8% CAGR Abu Dhabi clean-energy strategy; Masdar-led tenders [14]
South Africa USD 1.20 Billion (2025) Loadshedding mitigation; REIPPPP Bid Window 7 [6]
Egypt 19.0% CAGR Suez Economic Zone green-hydrogen corridor; grid-stabilization needs [4]
Rest of MEA 22% of the regional share Kenya off-grid solar-storage; Morocco Noor-Midelt complex [14]

ย 

The Middle East & Africa is the fastest-growing region for the Battery Energy Storage Systems Market, propelled by sovereign decarbonization programs that mandate gigawatt-scale storage procurement within compressed timelines. Saudi Arabia's Public Investment Fund has committed over USD 10 billion to renewable-plus-storage infrastructure under Vision 2030 [14]. South Africa's grid crisis has made battery storage a quasi-essential service, with independent power producers increasingly including four-hour BESS modules in their Bid Window submissions [6].

ย 

Battery Energy Storage Systems Market By Region, 2025-2035

Competitive Benchmarking

The Battery Energy Storage Systems Market exhibits medium market concentration. The top five players collectively hold an estimated 38โ€“45% revenue share, with a long tail of regional integrators, EPC contractors, and emerging technology providers competing on specialization and local relationships. The Herfindahl-Hirschman Index sits in the moderately concentrated range (approximately 900โ€“1,100), indicating that no single firm dominates pricing or technology standards [2][6].

Company Est. Revenue Share Range Key Offerings Strategic Positioning
CATL 12โ€“15% LFP & NMC cells; EnerOne/EnerC containerized systems Vertically integrated cell-to-system; global scale leader
BYD Company 8โ€“11% Blade Battery; BYD Cube containerized BESS Cost-competitive LFP; strong domestic and export pipeline
Tesla Energy 6โ€“9% Megapack; Autobidder software platform Integrated hardware-software; brand-driven utility adoption
Samsung SDI 5โ€“8% NMC prismatic cells; utility-grade rack systems High energy-density cells; strong Korea/Japan presence
LG Energy Solution 5โ€“7% NMC pouch cells; RESU residential systems Diversified EV-to-storage cell supply; U.S. manufacturing expansion
Fluence Energy 4โ€“6% Gridstack; Mosaic digital platform Software-centric integration; Siemens/AES joint-venture heritage
Sungrow Power Supply 3โ€“5% PowerTitan; integrated PCS and EMS Price-competitive inverter-plus-storage bundle; APAC & EMEA growth
Wรคrtsilรค 2โ€“4% GridSolv Quantum; GEMS digital platform Grid-forming capability; gas-to-storage transition customer base
Honeywell International 2โ€“3% Battery Management System; Experion integration Industrial-IoT overlay; brownfield grid-modernization projects
Siemens Energy 2โ€“3% Siestorage; grid-stabilization turnkey solutions Transmission-grade integration; strong European utility relationships

ย 

ย 

Recent News & Developments

ย 

ย 

ย 

ย 

ย 

ย 

ย 

ย 

  • June 2025: Toshiba Energy Systems placed an order with Sungrow for a 100 MW/351 MWh system at SGET Sapporo, one of the biggest storage projects in Japan.
  • May 2025: In accordance with Australia's EPBC Act, Samsung C&T submitted proposals for a 320 MWh BESS in New South Wales.
  • In April 2025, LG Energy Solution and Omron signed a 1 trillion-won contract for more than 2 GWh LFP batteries that will be sent to Japan.
  • March 2025: For a 172 MW/408 MWh hybrid project in Australia, Gentari selected Fluence's AI platform.

ย 

Battery Energy Storage Systems Market Report Scope

Parameter Detail
Market Scope Global Battery Energy Storage Systems Market โ€” hardware, software, and services
Study Period 2021โ€“2035
CAGR (Forecast) 15.8% (2026โ€“2035)
Base Year Size USD 82.80 Billion (2025)
Forecast Endpoint USD 363.50 Billion (2035)
Fastest Growing Segments LFP by battery type; Residential by end user; MEA by region
Companies Profiled 10 (CATL, BYD, Tesla Energy, Samsung SDI, LG Energy Solution, Fluence, Sungrow, Wรคrtsilรค, Honeywell, Siemens Energy)
Valuation Currency USD Billion

ย 

ย 

FAQs

What is the typical payback period for utility-scale installations in the Battery Energy Storage Systems Market?
Most utility-scale systems achieve payback within 6โ€“8 years through stacked revenues from arbitrage, capacity, and ancillary services. Declining cell costs are compressing this timeline further [2].
How do LFP cells compare to NMC for stationary storage applications?
LFP offers superior cycle life (6,000+ cycles) and lower thermal-runaway risk, making it preferred for four-hour-plus stationary use. NMC retains an edge in energy density for space-constrained sites [9].
What procurement model dominates large-scale projects in the Battery Energy Storage Systems Market?
Turnkey EPC contracts account for the majority of projects above 100 MWh, consolidating design, permitting, and commissioning risk. Owner-managed procurement is growing among repeat developers [17].
How are grid operators qualifying storage assets for frequency regulation?
Operators require sub-second response certification and a minimum 15-minute sustained discharge. FERC Order 841 in the United States has standardized market-participation rules for storage [5].
What role does augmentation play in long-term storage contracts?
Adding replacement cells mid-life to restore original capacity is standard in 15โ€“20-year tolling agreements. It typically adds 10โ€“15% to lifecycle cost but extends asset viability [7].
Are sodium-ion batteries commercially viable for the Battery Energy Storage Systems Market?
Sodium-ion has reached pilot-scale deployment in China, with initial grid projects delivered by major manufacturers. Cost parity with LFP is expected by 2028โ€“2029 for short-duration applications [9].
How does insurance underwriting affect BESS project financing?
Insurers now require third-party cell-level testing and UL 9540A certification before issuing property coverage. Premium rates have stabilized after early thermal incidents increased costs [20]. ย  ย 
Author
Author
Author Profile
Chitranshi Jaiswal LinkedIn
Team Lead - Research
Chitranshi is a Team Leader in the Chemicals & Materials (CnM) and Energy & Power (EnP) domains, with 6+ years of experience in market research. She leads and mentors teams to deliver cross-domain projects that equip clients with actionable insights and growth strategies. She is skilled in market estimation, forecasting, competitive benchmarking, and both primary & secondary research, enabling her to turn complex data into decision-ready insights. An engineer and MBA professional, she combines technical expertise with strategic acumen to solve dynamic market challenges. Chitranshi has successfully managed projects that support market entry, investment planning, and competitive positioning, while building strong client relationships. Certified in Advanced Excel & Power BI she leverages data-driven approaches to ensure accuracy, clarity, and impactful outcomes.

Research Approach

ย 

Secondary Research

The secondary research process involved comprehensive analysis of regulatory databases, industry publications, technical standards, and authoritative energy organizations. Key sources included the US Department of Energy (DOE), Energy Information Administration (EIA), Federal Energy Regulatory Commission (FERC), National Renewable Energy Laboratory (NREL), International Energy Agency (IEA), International Renewable Energy Agency (IRENA), European Commission Directorate-General for Energy, European Battery Alliance, China National Energy Administration (NEA), Ministry of Economy, Trade and Industry (METI) - Japan, California Energy Commission (CEC), US Energy Storage Association (ESA), European Association for Storage of Energy (EASE), IEEE Standards Association, International Electrotechnical Commission (IEC), World Bank Energy Data, BloombergNEF (BNEF), Wood Mackenzie Energy Storage Service, and national utility commission reports from key markets.

Deployment statistics, grid interconnection standards, regulatory policy frameworks, technology cost trends, and market landscape analysis for lithium-ion batteries, sodium-ion batteries, and other emerging energy storage chemistries across utility-scale, commercial & industrial, and residential applications were gathered from these sources.

ย 

Primary Research

In order to gather both qualitative and quantitative insights, supply-side and demand-side stakeholders were interviewed during the primary research process. CEOs, CTOs, VPs of Business Development, heads of regulatory affairs, and commercial directors from battery cell producers, system integrators, inverter suppliers, and EPC contractors were examples of supply-side sources. Chief grid officers, utility procurement leads, developers of renewable energy projects, commercial and industrial energy managers, and sustainability directors from electric utilities, independent power producers, commercial real estate companies, and industrial manufacturing facilities were examples of demand-side sources. Market segmentation, manufacturing capacity development schedules, grid-scale deployment patterns, energy arbitrage economics, and utility procurement dynamics were all corroborated by primary research.

Primary Respondent Breakdown:

By Designation: C-level Primaries (28%), Director Level (35%), Others (37%)

By Region: North America (40%), Europe (25%), Asia-Pacific (28%), Rest of World (7%)

ย 

Market Size Estimation

Capacity deployment mapping and revenue analysis along the value chain were used to determine the global market valuation. The methodology comprised:

Finding more than fifty major producers and system integrators in North America, Europe, Asia-Pacific, and Latin America

Product mapping for flow batteries, sodium-ion, lithium-ion (LFP, NMC, NCA), and other new battery chemistries

Examination of stated and projected yearly income for battery energy storage system portfolios

Coverage of producers and distributors accounting for 75โ€“80% of the world market in 2024

Extrapolation of segment-specific valuations across battery type, industry vertical, capacity scale, and application categories utilizing top-down (manufacturer and utility revenue validation) and bottom-up (installed capacity ร— system cost by application and location) methods

Download Free Sample

Kindly complete the form below to receive a free sample of this Report

Download PDF ×

We do not share your information with anyone. However, we may send you emails based on your report interest from time to time. You may contact us at any time to opt-out.

















