• Cat-intel
  • MedIntelliX
  • Resources
  • About Us
  • Hero Background
    English
    Chinese
    French
    Japanese
    Korean
    German
    Spanish

    Bio-Based Chemicals Market Size

    ID: MRFR/CnM/4251-CR
    449 Pages
    Anshula Mandaokar
    December 2021

    Bio-based Chemicals Market Research Report Information By Type (Bio-alcohols, Bio-plastics, Bio-lubricants, Bio-solvents, Bio-surfactants, Bio-based acids), By Application (Food & beverages, Agriculture, Automotive, Personal Care, Packaging, Detergents & cleaner, Paints & coating, Adhesives and sealants, Pharmaceutical, Paint dispersion), And By Region (North America, Europe, Asia-P...

    Share:
    Download PDF ×

    We do not share your information with anyone. However, we may send you emails based on your report interest from time to time. You may contact us at any time to opt-out.

    Bio-Based Chemicals Market Infographic
    $ 4,950.0
    $ 5,950.0
    $ 7,250.0

    Bio Based Chemicals Size

    Bio-Based Chemicals Market Growth Projections and Opportunities

    The market for bio-based chemicals is influenced by several key factors that shape its growth, demand, and sustainability. One significant factor is the increasing global awareness of environmental issues and the need for sustainable solutions. With growing concerns about climate change, pollution, and finite fossil fuel resources, there's a rising demand for alternatives to traditional petrochemical-based products. Bio-based chemicals, derived from renewable resources such as plants, algae, and waste biomass, offer a promising solution to reduce reliance on fossil fuels and mitigate environmental impacts. Bio-based chemicals are chemical compounds that are made entirely or partially from biological resources, such as biomasses, feedstock, plants, algae, crops, trees, marine life, and biological waste. Products made with bio-based chemicals are environmentally benign since they do not emit hazardous emissions or pollute the environment when discarded. Government regulations in developed countries regarding the use of synthetic chemicals are expected to play a key role in the global bio-based chemicals market's growth. Another crucial market factor is government policies and regulations aimed at promoting the use of bio-based chemicals. Many countries have implemented policies to incentivize the production and consumption of renewable products, including bio-based chemicals. These policies often include subsidies, tax incentives, renewable energy mandates, and carbon pricing mechanisms, which create a favorable environment for the growth of the bio-based chemicals market. Additionally, regulations aimed at reducing greenhouse gas emissions and promoting sustainable development further drive the adoption of bio-based chemicals across various industries. Furthermore, technological advancements play a significant role in shaping the bio-based chemicals market. Continuous innovation in biotechnology, fermentation processes, and biomass conversion techniques has led to the development of cost-effective and sustainable methods for producing bio-based chemicals. Advances in genetic engineering and synthetic biology have enabled the engineering of microorganisms and enzymes for enhanced production of target compounds from renewable feedstocks. These technological advancements not only improve the efficiency and scalability of bio-based chemical production but also expand the range of available bio-based products, driving market growth and diversification. Market dynamics such as supply chain considerations and feedstock availability also influence the bio-based chemicals market. The availability and cost of feedstocks, including agricultural residues, forestry residues, and non-food crops, play a crucial role in determining the competitiveness of bio-based chemical production. Factors such as land use competition, crop yields, and weather conditions can impact feedstock availability and prices, affecting the profitability and sustainability of bio-based chemical production. Additionally, the development of efficient supply chains and infrastructure for sourcing, transporting, and processing biomass feedstocks is essential for the growth of the bio-based chemicals market. Moreover, consumer preferences and market demand for sustainable products drive the adoption of bio-based chemicals across various end-user industries. Businesses and consumers are increasingly seeking environmentally friendly alternatives to conventional products, including packaging materials, plastics, cosmetics, and pharmaceuticals. Bio-based chemicals offer several environmental benefits, such as reduced carbon footprint, biodegradability, and lower toxicity, which resonate with environmentally conscious consumers and businesses. As a result, companies are investing in research, development, and marketing efforts to capitalize on the growing demand for bio-based products, further fueling market growth and innovation.

    Bio-Based Chemicals Market Size Graph

    Market Summary

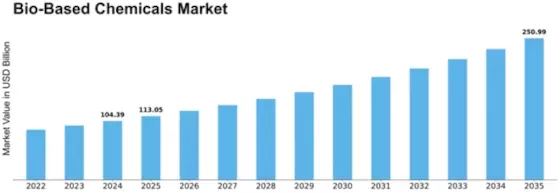
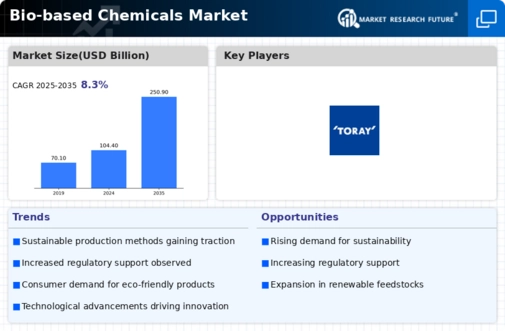
    As per Market Research Future Analysis, the Global Bio-based Chemicals Market was valued at USD 104.39 Billion in 2024 and is projected to grow to USD 250.99 Billion by 2035, with a CAGR of 8.30% from 2025 to 2035. Bio-based chemicals, derived from renewable biological resources, serve as sustainable alternatives to petroleum-based chemicals, contributing to lower environmental impacts. Key applications include biofuels, bioplastics, and bio-based solvents, with significant demand in sectors like food and beverage, pharmaceuticals, and personal care. The Asia-Pacific region leads the market, driven by agricultural applications, while Europe and North America follow due to stringent regulations and R&D investments.

    Key Market Trends & Highlights

    The bio-based chemicals market is witnessing significant growth driven by environmental concerns and regulatory support.

    • Market Size in 2024: USD 104.39 Billion
    • Projected Market Size by 2035: USD 250.99 Billion
    • CAGR from 2025 to 2035: 8.30%
    • Largest Regional Market Share in 2024: Asia-Pacific

    Market Size & Forecast

    2024 Market Size USD 104.39 Billion
    2035 Market Size USD 250.99 Billion
    CAGR (2024-2035) 8.30%

    Major Players

    Major companies include ADM, DuPont, Evonik Industries, Toray Industries, and Cargill Incorporated.

    Market Trends

    Depletion of Fossil Fuel Resources Will Boost Market

    The market for bio-based chemicals is expanding as a result of increased greenhouse gas emissions and the depletion of fossil fuel supplies. The use of biomaterials has grown as a result of these considerations. The use of bio-based goods across sectors is supported by ongoing measures to reduce hazardous emissions. The expanding idea of "green chemistry" will help to accelerate this acceptance rate. Government measures that are supportive of reducing the use of dangerous chemicals will help the industry.

    The transition towards bio-based chemicals is increasingly recognized as a pivotal strategy for achieving sustainability and reducing reliance on fossil fuels, thereby fostering a circular economy.

    U.S. Department of Energy

    Bio-Based Chemicals Market Market Drivers

    Market Growth Projections

    The Global Bio-based Chemicals Market Industry is poised for substantial growth, with projections indicating a market size of 104.4 USD Billion in 2024 and an anticipated increase to 250.9 USD Billion by 2035. This growth trajectory suggests a compound annual growth rate of 8.3% from 2025 to 2035, highlighting the increasing adoption of bio-based chemicals across various sectors. The market's expansion is driven by factors such as rising consumer demand for sustainable products, supportive government policies, and ongoing technological advancements. These projections underscore the potential for bio-based chemicals to play a pivotal role in the transition towards a more sustainable and circular economy.

    Consumer Awareness and Education

    Consumer awareness and education are crucial factors influencing the Global Bio-based Chemicals Market Industry. As consumers become more informed about the environmental impacts of their choices, there is a growing demand for products that utilize bio-based chemicals. Educational initiatives and marketing campaigns are effectively communicating the benefits of bio-based alternatives, leading to increased consumer preference for these products. This heightened awareness not only drives demand but also encourages manufacturers to innovate and expand their bio-based product lines. The result is a dynamic market environment where consumer preferences significantly shape the trajectory of bio-based chemicals, fostering a culture of sustainability.

    Government Regulations and Support

    Government regulations play a pivotal role in shaping the Global Bio-based Chemicals Market Industry. Many countries are implementing stringent regulations aimed at reducing greenhouse gas emissions and promoting the use of renewable resources. For instance, policies that encourage the production and use of bio-based chemicals are becoming more common, providing financial incentives and subsidies to manufacturers. This regulatory support not only fosters innovation but also creates a favorable environment for investment in bio-based technologies. As governments worldwide commit to sustainability goals, the bio-based chemicals sector is likely to benefit significantly, potentially leading to a market growth trajectory that aligns with global environmental objectives.

    Rising Demand for Sustainable Products

    The Global Bio-based Chemicals Market Industry experiences a notable increase in demand for sustainable products. Consumers and businesses alike are increasingly prioritizing environmentally friendly alternatives to traditional petrochemical products. This shift is driven by heightened awareness of environmental issues and a desire to reduce carbon footprints. As a result, bio-based chemicals, which are derived from renewable resources, are gaining traction. The market is projected to reach 104.4 USD Billion in 2024, reflecting a growing preference for sustainable solutions across various sectors, including packaging, textiles, and personal care. This trend indicates a robust future for bio-based chemicals as sustainability becomes a core value for consumers.

    Technological Advancements in Production

    Technological advancements are transforming the Global Bio-based Chemicals Market Industry by enhancing production efficiency and reducing costs. Innovations in biotechnology, such as synthetic biology and metabolic engineering, enable the development of bio-based chemicals from a wider range of feedstocks. These advancements facilitate the production of high-value chemicals with improved yield and purity. As a result, manufacturers can produce bio-based alternatives that are competitive with traditional chemicals. The anticipated compound annual growth rate of 8.3% from 2025 to 2035 underscores the potential for technological innovations to drive market expansion, making bio-based chemicals increasingly accessible and economically viable.

    Growing Investment in Renewable Resources

    Investment in renewable resources is a significant driver of the Global Bio-based Chemicals Market Industry. As industries seek to transition away from fossil fuels, there is a marked increase in funding directed towards the development of bio-based feedstocks. This investment not only supports research and development but also enhances the scalability of bio-based chemical production. The market is expected to grow to 250.9 USD Billion by 2035, reflecting the increasing financial commitment to sustainable practices. This trend indicates a shift in the industrial landscape, where renewable resources are becoming integral to the supply chain, further solidifying the role of bio-based chemicals in various applications.

    Market Segment Insights

    Bio-based Chemicals Type Insights

    The market segmentation, based on Type, includes Inductive Bio-alcohols, Bio-plastics, Bio-lubricants, Bio-solvents, Bio-surfactants, and Bio-based acids. The bio-alcohols category accounted for the biggest market share of the market. As of the broad expanding demand from major end-use sectors such as food and beverage, pharmaceutical, cosmetics, and personal care.

    Bio-based Chemicals Application Insights

    Based on Application, the market segmentation includes Food & beverages, Agriculture, Automotive, Personal Care, Packaging, Detergents & cleaner, Paints & coating, Adhesives and sealants, Pharmaceuticals, and Paint dispersion. The Paints & coating segment is expected to dominate the market. The demand for bio-based chemicals in this segment is being driven by the need for sustainable and eco-friendly alternatives to traditional petroleum-based chemicals, which are associated with environmental concerns.

    Figure 2: Bio-based Chemicals Market, by Type, 2022 & 2030 (USD Billion)Source: Secondary Research, Primary Research, Market Research Future Database, and Analyst Review

    Get more detailed insights about Bio-based Chemicals Market Research Report—Global Forecast till 2032

    Regional Insights

    By region, the study provides market insights into North America, Europe, Asia-Pacific, and the Rest of the World. Asia-Pacific had the largest market share and is expected to expand at the quickest rate in the industry. This is mostly due to the increased need for bio-based chemicals in the Asia-Pacific agriculture business. Additionally, bio-based chemicals have a broad range of uses in agriculture, such as bio-pesticides and bio-fertilizers, which are fueling the Asia-Pacific market.

    Figure 3: BIO-BASED CHEMICALS MARKET SHARE BY REGION 2022 (%)BIO-BASED CHEMICALS MARKET SHARE BY REGIONSource: Secondary Research, Primary Research, Market Research Future Database, and Analyst Review

    Due to strict government controls and considerable spending on R&D and technology developments, Europe accounted for the second-largest share of the worldwide market. North America comes after Europe. Because of tight environmental rules imposed by the Environmental Protection Agency (EPA) governing the use of synthetic chemicals, North America saw slow development in the worldwide market.

    Key Companies in the Bio-Based Chemicals Market market include

    Industry Developments

    July 2021: Archer Daniels Midland Corporation (ADM) has agreed to buy Sojaprotein, the largest manufacturer of plant-based proteins in southern Europe. The acquisition of Sojaprotein is anticipated to boost the company's manufacturing capacity and meet the nutritional demands of consumers.

    June 2021: TotalEnergies, MPG Manifattura Plastica, and Froneri announced the commercial release of bio-based ice cream plastic cups produced from Certified Renewable Polypropylene. Its bio-based naphtha-based renewable polypropylene delivers virgin-like performance with a lower carbon footprint and is totally recyclable.

    Future Outlook

    Bio-Based Chemicals Market Future Outlook

    The Bio-based Chemicals Market is projected to grow at an 8.30% CAGR from 2025 to 2035, driven by sustainability initiatives, technological advancements, and increasing consumer demand for eco-friendly products.

    New opportunities lie in:

    • Invest in R&D for innovative bio-based product formulations.
    • Expand supply chains to enhance sustainability and reduce costs.
    • Leverage digital marketing strategies to target eco-conscious consumers.

    By 2035, the Bio-based Chemicals Market is expected to achieve substantial growth, reflecting a robust shift towards sustainable practices.

    Market Segmentation

    Bio-based Chemicals Type Outlook

    • Bio-alcohols
    • Bio-plastics
    • Bio-lubricants
    • Bio-solvents
    • Bio-surfactants
    • Bio-based acids

    Bio-based Chemicals Regional Outlook

    North America
    • US
    • Canada

    Bio-based Chemicals Application Outlook

    • Food & beverages
    • Agriculture
    • Automotive
    • Personal Care
    • Packaging
    • Detergents & cleaner
    • Paints & coating
    • Adhesives and sealants
    • Pharmaceutical
    • Paint dispersion

    Report Scope

    Report Attribute/Metric Details
    Market Size 2024 USD 104.39 Billion
    Market Size 2035 250.99 (Value (USD Billion))
    Compound Annual Growth Rate (CAGR) 8.30% (2025 - 2035)
    Base Year 2024
    Market Forecast Period 2025 - 2035
    Historical Data 2018 & 2022
    Market Forecast Units Value (USD Billion)
    Report Coverage Revenue Forecast, Market Competitive Landscape, Growth Factors, and Trends
    Segments Covered Type, Application, and Region
    Geographies Covered North America, Europe, Asia Pacific, and Rest of the World
    Countries Covered The U.S, Canada, Germany, France, UK, Italy, Spain, China, Japan, India, Australia, South Korea, and Brazil
    Key Companies Profiled AGAE Technologies, TOTAL, ADM, DuPont, Evonik Industries, Toray Industries Inc, Cargill Incorporated, GF Biochemicals Ltd, Mitsubishi Chemical Corporation, DSM
    Key Market Opportunities The increasing number of lignocellulosic biorefineries Research & development related to bio-based chemicals
    Key Market Dynamics Growing demand for bio-based lubricants Increasing adoption of bioplastics Increasing application of bio-based alcohols.
    Market Size 2025 113.06 (Value (USD Billion))

    Market Highlights

    Author

    Anshula Mandaokar
    Team Lead - Research

    She holds an experience of about 6+ years in market research and business consulting, working under the spectrum of information communication technology, telecommunications and semiconductor domains. aarti conceptualizes and implements a scalable business strategy and provides strategic leadership to the clients. her expertise lies in market estimation, competitive intelligence, pipeline analysis, customer assessment, etc.

    Leave a Comment

    Latest Comments

    John Doe
    john@example.com

    This is a great article! Really helped me understand the topic better.

    Posted on July 23, 2025, 10:15 AM
    Jane Smith
    jane@domain.com

    Thanks for sharing this. I’ve bookmarked it for later reference.

    Posted on July 22, 2025, 7:45 PM

    FAQs

    How much is the Bio-based Chemical market?

    The Bio-based Chemical market size was valued at USD 96.39 Billion in 2023.

    What is the growth rate of the Bio-based Chemical market?

    The market is projected to grow at a CAGR of 8.30% during the forecast period, 2024-2032.

    Which region held the largest market share in the Bio-based Chemicals market?

    Asia Pacific had the largest share of the Bio-based Chemicals market.

    Who are the key players in the Bio-based Chemicals market?

    The key players in the market are AGAE Technologies, TOTAL, ADM, DuPont, Evonik Industries, Toray Industries Inc, Cargill Incorporated, GF Biochemicals Ltd, Mitsubishi Chemical Corporation, and DSM.

    Which Type led the market of Bio-based Chemicals?

    The Bio-alcohols category dominated the market in 2023.

    Which Application had the largest market share in the market?

    Paints & coating had the largest share in the market for Bio-based Chemicals.

    1. Executive Summary 18
      1. MARKET ATTRACTIVENESS ANALYSIS 20
        1. GLOBAL BIO-BASED CHEMICALS MARKET, BY TYPE 21
        2. GLOBAL BIO-BASED CHEMICALS MARKET, BY APPLICATION 22
        3. GLOBAL BIO-BASED CHEMICALS MARKET, BY REGION 23
    2. Market Introduction 24
      1. DEFINITION 24
      2. Scope of the Study 24
      3. MARKET STRUCTURE 25
    3. Research Methodology 26
      1. RESEARCH PROCESS 26
      2. PRIMARY RESEARCH 27
      3. SECONDARY RESEARCH 28
      4. MARKET SIZE ESTIMATION 28
      5. TOP-DOWN AND Bottom-up Approach 29
      6. FORECAST MODEL 30
      7. LIST OF ASSUMPTIONS & LIMITATIONS 31
    4. MARKET DYNAMICS 32
      1. INTRODUCTION 32
      2. DRIVERS 33
        1. GROWING DEMAND FOR BIO-BASED LUBRICANTS 33
        2. INCREASING ADOPTION OF BIOPLASTICS 33
        3. INCREASING APPLICATION OF BIO-BASED ALCOHOLS 34
      3. RESTRAINTS 36
        1. VOLATILE RAW MATERIAL PRICES 36
        2. DISADVANTAGES RELATED TO BIO-BASED LUBRICANTS AND BIOPLASTICS 37
      4. OPPORTUNITIES 38
        1. INCREASING NUMBER OF LIGNOCELLULOSIC BIOREFINERIES 38
        2. RESEARCH & DEVELOPMENT RELATED TO BIO-BASED CHEMICALS 38
      5. TREND 39
        1. INCREASING FOCUS ON PRODUCTION COST OPTIMIZATION THROUGH TECHNOLOGICAL INNOVATION 39
      6. MACROECONOMIC INDICATORS 40
        1. GDP GROWTH 40
    5. MARKET FACTOR ANALYSIS 42
      1. SUPPLY CHAIN ANALYSIS 42
        1. RAW MATERIAL SUPPLIERS 42
        2. BIO-BASED CHEMICALS PRODUCERS 46
        3. DISTRIBUTION & SALES CHANNEL 46
        4. APPLICATION 47
      2. PORTER''S FIVE FORCES ANALYSIS 48
        1. THREAT OF NEW ENTRANTS 48
        2. BARGAINING POWER OF SUPPLIERS 49
        3. THREAT OF SUBSTITUTES 49
        4. BARGAINING POWER OF BUYERS 49
        5. INTENSITY OF RIVALRY 49
      3. PRICING OVERVIEW, 2019-2021 (USD/TONS) 49
        1. PRICING OVERVIEW, BY REGION 49
        2. PRICING OVERVIEW, BY COUNTRY 50
        3. PRICING OVERVIEW, BY TYPE 50
      4. REGULATORY FRAMEWORK 50
      5. GLOBAL PETROCHEMICALS MARKET OUTLOOK 54
        1. COMPARISON ANALYSIS ON BIO-BASED CHEMICALS & PETROCHEMICALS 56
      6. IMPACT OF COVID 19 OUTBREAK ON GLOBAL BIO-BASED CHEMICALS MARKET 56
        1. IMPACT ON GLOBAL ECONOMY 56
        2. PRODUCTION SCENARIO 56
    6. GLOBAL BIO-BASED CHEMICALS MARKET, BY TYPE 58
      1. INTRODUCTION 58
      2. BIO-PLASTICS 60
      3. BIO-LUBRICANTS 62
      4. BIO-SOLVENTS 63
      5. BIO-SURFACTANTS 64
      6. BIO-BASED ACIDS 65
      7. BIO-ALCOHOLS 66
      8. OTHERS 67
    7. GLOBAL BIO-BASED CHEMICALS MARKET, BY APPLICATION 68
      1. INTRODUCTION 68
      2. AGRICULTURE 71
      3. AUTOMOTIVE 72
      4. PERSONAL CARE 73
      5. FOOD & BEVERAGES 74
      6. PACKAGING 75
      7. DETERGENTS & CLEANERS 76
      8. PAINTS & COATING 77
      9. ADHESIVES & SEALANTS 78
      10. PHARMACEUTICALS 79
      11. PAINT DISPERSIONS 80
      12. OTHERS 81
    8. GLOBAL BIO-BASED CHEMICALS MARKET, BY REGION 83
      1. INTRODUCTION 83
      2. NORTH AMERICA 86
        1. US 89
        2. CANADA 91
      3. EUROPE 94
        1. GERMANY 97
        2. UK 99
        3. RUSSIA 102
        4. FRANCE 104
        5. SPAIN 107
        6. ITALY 109
        7. REST OF EUROPE 112
      4. ASIA-PACIFIC 115
        1. CHINA 119
        2. INDIA 121
        3. JAPAN 124
        4. AUSTRALIA & NEW ZEALAND 126
        5. SOUTH KOREA 129
        6. REST OF ASIA-PACIFIC 131
      5. LATIN AMERICA 134
        1. BRAZIL 137
        2. MEXICO 140
        3. ARGENTINA 142
        4. REST OF LATIN AMERICA 145
      6. MIDDLE EAST & AFRICA 148
        1. GCC COUNTRIES 151
        2. ISRAEL 154
        3. SOUTH AFRICA 156
        4. REST OF THE MIDDLE EAST & AFRICA 159
    9. Competitive Landscape 162
      1. INTRODUCTION 162
      2. MARKET STRATEGY ANALYSIS 162
      3. KEY DEVELOPMENTS & GROWTH STRATEGIES 163
      4. COMPETITIVE BENCHMARKING 166
    10. COMPANY PROFILES 167
      1. BASF SE 167
        1. COMPANY OVERVIEW 167
        2. FINANCIAL OVERVIEW 168
        3. PRODUCTS OFFERED 168
        4. KEY DEVELOPMENTS 170
        5. SWOT ANALYSIS 170
        6. KEY STRATEGIES 171
      2. DUPONT 172
        1. COMPANY OVERVIEW 172
        2. FINANCIAL OVERVIEW 172
        3. PRODUCTS OFFERED 173
        4. KEY DEVELOPMENTS 173
        5. SWOT ANALYSIS 174
        6. KEY STRATEGIES 174
      3. VERTEC BIOSOLVENT 175
        1. COMPANY OVERVIEW 175
        2. FINANCIAL OVERVIEW 175
        3. PRODUCTS OFFERED 175
        4. KEY DEVELOPMENTS 176
        5. SWOT ANALYSIS 176
        6. KEY STRATEGIES 176
      4. AGAE TECHNOLOGIES, LLC 177
        1. COMPANY OVERVIEW 177
        2. FINANCIAL OVERVIEW 177
        3. PRODUCTS OFFERED 177
        4. KEY DEVELOPMENT 177
        5. SWOT ANALYSIS 178
        6. KEY STRATEGIES 178
      5. TOTALENERGIES 179
        1. COMPANY OVERVIEW 179
        2. FINANCIAL OVERVIEW 179
        3. PRODUCTS OFFERED 180
        4. KEY DEVELOPMENTS 180
        5. SWOT ANALYSIS 181
        6. KEY STRATEGIES 181
      6. ARCHER DANIELS MIDLAND COMPANY 182
        1. COMPANY OVERVIEW 182
        2. FINANCIAL OVERVIEW 182
        3. PRODUCTS OFFERED 183
        4. KEY DEVELOPMENTS 183
        5. SWOT ANALYSIS 184
        6. KEY STRATEGIES 184
      7. BRASKEM 185
        1. COMPANY OVERVIEW 185
        2. FINANCIAL OVERVIEW 185
        3. PRODUCTS OFFERED 186
        4. KEY DEVELOPMENTS 186
        5. SWOT ANALYSIS 187
        6. KEY STRATEGIES 187
      8. EVONIK INDUSTRIES AG 188
        1. COMPANY OVERVIEW 188
        2. FINANCIAL OVERVIEW 189
        3. PRODUCTS OFFERED 189
        4. KEY DEVELOPMENTS 190
        5. SWOT ANALYSIS 191
        6. KEY STRATEGIES 191
      9. TORAY INDUSTRIES INC 192
        1. COMPANY OVERVIEW 192
        2. FINANCIAL OVERVIEW 192
        3. PRODUCTS OFFERED 193
        4. KEY DEVELOPMENTS 193
        5. SWOT ANALYSIS 194
        6. KEY STRATEGIES 194
      10. MITSUBISHI CHEMICAL CORPORATION 195
        1. COMPANY OVERVIEW 195
        2. FINANCIAL OVERVIEW 195
        3. PRODUCTS OFFERED 196
        4. KEY DEVELOPMENTS 196
        5. SWOT ANALYSIS 197
        6. KEY STRATEGIES 197
      11. CARGILL, INCORPORATED 198
        1. COMPANY OVERVIEW 198
        2. FINANCIAL OVERVIEW 198
        3. PRODUCTS OFFERED 199
        4. KEY DEVELOPMENTS 200
        5. SWOT ANALYSIS 201
        6. KEY STRATEGIES 201
      12. DSM 202
        1. COMPANY OVERVIEW 202
        2. FINANCIAL OVERVIEW 202
        3. PRODUCTS OFFERED 203
        4. KEY DEVELOPMENTS 203
        5. SWOT ANALYSIS 204
        6. KEY STRATEGIES 204
      13. ITACONIX PLC 205
        1. COMPANY OVERVIEW 205
        2. FINANCIAL OVERVIEW 205
        3. PRODUCTS OFFERED 206
        4. KEY DEVELOPMENTS 206
        5. SWOT ANALYSIS 206
        6. KEY STRATEGIES 207
      14. LYONDELLBASELL 208
        1. COMPANY OVERVIEW 208
        2. FINANCIAL OVERVIEW 208
        3. PRODUCTS OFFERED 209
        4. KEY DEVELOPMENT 209
        5. SWOT ANALYSIS 210
        6. KEY STRATEGIES 210
      15. GFBIOCHEMICALS LTD 211
        1. COMPANY OVERVIEW 211
        2. FINANCIAL OVERVIEW 211
        3. PRODUCTS OFFERED 211
        4. KEY DEVELOPMENTS 211
        5. SWOT ANALYSIS 212
        6. KEY STRATEGIES 212
    11. APPENDIX 213
      1. REFERENCES 213
      2. RELATED REPORTS 214
    12. List of Tables and Figures
      1. LIST OF TABLES
      2. TABLE 1 LIST OF ASSUMPTIONS & LIMITATIONS 31
      3. TABLE 2 GLOBAL NOMINAL GDP AND GDP GROWTH RATE, 2019 40
      4. TABLE 3 LIST OF RAW MATEIAL SUPPLIERS 43
      5. TABLE 4 LIST OF TOP 10 COUNTRIES PRODUCING CORN, 2019 (MILLION TONNES) 43
      6. TABLE 5 LIST OF TOP 10 COUNTRIES PRODUCING SUGARCANE, 2019 (MILLION TONNES) 44
      7. TABLE 6 LIST OF TOP 10 COUNTRIES PRODUCING SUGAR BEET, 2019 (MILLION TONNES) 44
      8. TABLE 7 LIST OF TOP 10 COUNTRIES PRODUCING WHEAT, 2019 (MILLION TONNES) 45
      9. TABLE 8 LIST OF TOP 10 COUNTRIES PRODUCING CEREALS, 2019 (MILLION TONNES) 45
      10. TABLE 9 RAW MATERIAL PRICING ANALYSIS (USD/TONS) 46
      11. TABLE 10 LIST OF DISTRIBUTORS 47
      12. TABLE 11 PRICING OVERVIEW, BY REGION 49
      13. TABLE 12 PRICING OVERVIEW, BY COUNTRY 50
      14. TABLE 13 PRICING OVERVIEW, BY TYPE 50
      15. TABLE 14 LIST OF REGULATIONS ON SYNTHETIC CHEMICALS 51
      16. TABLE 15 LEGISLATIONS RELATED TO BIO-BASED CHEMICALS 53
      17. TABLE 16 GLOBAL BIO-BASED CHEMICALS, BY TYPE, 2022-2030 (USD MILLION) 59
      18. TABLE 17 GLOBAL BIO-BASED CHEMICALS MARKET, BY TYPE, 2022-2030 (KILOTONS) 60
      19. TABLE 18 GLOBAL BIO-BASED CHEMICALS MARKET FOR BIO-PLASTICS, BY REGION, 2022-2030 (USD MILLION) 61
      20. TABLE 19 GLOBAL BIO-BASED CHEMICALS MARKET FOR BIO-PLASTICS, BY REGION, 2022-2030 (KILOTONS) 61
      21. TABLE 20 GLOBAL BIO-BASED CHEMICALS MARKET FOR BIO-LUBRICANTS, BY REGION, 2022-2030 (USD MILLION) 62
      22. TABLE 21 GLOBAL BIO-BASED CHEMICALS MARKET FOR BIO-LUBRICANTS, BY REGION, 2022-2030 (KILOTONS) 62
      23. TABLE 22 GLOBAL BIO-BASED CHEMICALS MARKET FOR BIO-SOLVENTS, BY REGION, 2022-2030 (USD MILLION) 63
      24. TABLE 23 GLOBAL BIO-BASED CHEMICALS MARKET FOR BIO-SOLVENTS, BY REGION, 2022-2030 (KILOTONS) 63
      25. TABLE 24 GLOBAL BIO-BASED CHEMICALS MARKET FOR BIO-SURFACTANTS, BY REGION, 2022-2030 (USD MILLION) 64
      26. TABLE 25 GLOBAL BIO-BASED CHEMICALS MARKET FOR BIO-SURFACTANTS, BY REGION, 2022-2030 (KILOTONS) 64
      27. TABLE 26 GLOBAL BIO-BASED CHEMICALS MARKET FOR BIO-BASED ACIDS, BY REGION, 2022-2030 (USD MILLION) 65
      28. TABLE 27 GLOBAL BIO-BASED CHEMICALS MARKET FOR BIO-BASED ACIDS, BY REGION, 2022-2030 (KILOTONS) 65
      29. TABLE 28 GLOBAL BIO-BASED CHEMICALS MARKET FOR BIO-ALCOHOLS, BY REGION, 2022-2030 (USD MILLION) 66
      30. TABLE 29 GLOBAL BIO-BASED CHEMICALS MARKET FOR BIO-ALCOHOLS, BY REGION, 2022-2030 (KILOTONS) 66
      31. TABLE 30 GLOBAL BIO-BASED CHEMICALS MARKET FOR OTHERS, BY REGION, 2022-2030 (USD MILLION) 67
      32. TABLE 31 GLOBAL BIO-BASED CHEMICALS MARKET FOR OTHERS, BY REGION, 2022-2030 (KILOTONS) 67
      33. TABLE 32 GLOBAL BIO-BASED CHEMICALS, BY APPLICATION, 2022-2030 (USD MILLION) 69
      34. TABLE 33 GLOBAL BIO-BASED CHEMICALS MARKET, BY APPLICATION, 2022-2030 (KILOTONS) 70
      35. TABLE 34 GLOBAL BIO-BASED CHEMICALS MARKET FOR AGRICULTURE, BY REGION, 2022-2030 (USD MILLION) 71
      36. TABLE 35 GLOBAL BIO-BASED CHEMICALS MARKET FOR AGRICULTURE, BY REGION, 2022-2030 (KILOTONS) 72
      37. TABLE 36 GLOBAL BIO-BASED CHEMICALS MARKET FOR AUTOMOTIVE, BY REGION, 2022-2030 (USD MILLION) 72
      38. TABLE 37 GLOBAL BIO-BASED CHEMICALS MARKET FOR AUTOMOTIVE, BY REGION, 2022-2030 (KILOTONS) 73
      39. TABLE 38 GLOBAL BIO-BASED CHEMICALS MARKET FOR PERSONAL CARE, BY REGION, 2022-2030 (USD MILLION) 73
      40. TABLE 39 GLOBAL BIO-BASED CHEMICALS MARKET FOR PERSONAL CARE, BY REGION, 2022-2030 (KILOTONS) 74
      41. TABLE 40 GLOBAL BIO-BASED CHEMICALS MARKET FOR FOOD & BEVERAGES, BY REGION, 2022-2030 (USD MILLION) 74
      42. TABLE 41 GLOBAL BIO-BASED CHEMICALS MARKET FOR FOOD & BEVERAGES, BY REGION, 2022-2030 (KILOTONS) 75
      43. TABLE 42 GLOBAL BIO-BASED CHEMICALS MARKET FOR PACKAGING, BY REGION, 2022-2030 (USD MILLION) 75
      44. TABLE 43 GLOBAL BIO-BASED CHEMICALS MARKET FOR PACKAGING, BY REGION, 2022-2030 (KILOTONS) 76
      45. TABLE 44 GLOBAL BIO-BASED CHEMICALS MARKET FOR DETERGENTS & CLEANERS, BY REGION, 2022-2030 (USD MILLION) 76
      46. TABLE 45 GLOBAL BIO-BASED CHEMICALS MARKET FOR DETERGENTS & CLEANERS, BY REGION, 2022-2030 (KILOTONS) 77
      47. TABLE 46 GLOBAL BIO-BASED CHEMICALS MARKET FOR PAINTS & COATING, BY REGION, 2022-2030 (USD MILLION) 77
      48. TABLE 47 GLOBAL BIO-BASED CHEMICALS MARKET FOR PAINTS & COATING, BY REGION, 2022-2030 (KILOTONS) 78
      49. TABLE 48 GLOBAL BIO-BASED CHEMICALS MARKET FOR ADHESIVES & SEALANTS, BY REGION, 2022-2030 (USD MILLION) 78
      50. TABLE 49 GLOBAL BIO-BASED CHEMICALS MARKET FOR ADHESIVES & SEALANTS, BY REGION, 2022-2030 (KILOTONS) 79
      51. TABLE 50 GLOBAL BIO-BASED CHEMICALS MARKET FOR PHARMACEUTICALS, BY REGION, 2022-2030 (USD MILLION) 79
      52. TABLE 51 GLOBAL BIO-BASED CHEMICALS MARKET FOR PHARMACEUTICALS, BY REGION, 2022-2030 (KILOTONS) 80
      53. TABLE 52 GLOBAL BIO-BASED CHEMICALS MARKET FOR PAINT DISPERSIONS, BY REGION, 2022-2030 (USD MILLION) 80
      54. TABLE 53 GLOBAL BIO-BASED CHEMICALS MARKET FOR PAINT DISPERSIONS, BY REGION, 2022-2030 (KILOTONS) 81
      55. TABLE 54 GLOBAL BIO-BASED CHEMICALS MARKET FOR OTHERS, BY REGION, 2022-2030 (USD MILLION) 81
      56. TABLE 55 GLOBAL BIO-BASED CHEMICALS MARKET FOR OTHERS, BY REGION, 2022-2030 (KILOTONS) 82
      57. TABLE 56 GLOBAL BIO-BASED CHEMICALS MARKET, BY REGION, 2022-2030 (USD MILLION) 84
      58. TABLE 57 GLOBAL BIO-BASED CHEMICALS MARKET, BY REGION, 2022-2030 (KILOTONS) 85
      59. TABLE 58 NORTH AMERICA BIO-BASED CHEMICALS MARKET, BY COUNTRY, 2022-2030 (USD MILLION) 86
      60. TABLE 59 NORTH AMERICA BIO-BASED CHEMICALS MARKET, BY COUNTRY, 2022-2030 (KILOTONS) 86
      61. TABLE 60 NORTH AMERICA BIO-BASED CHEMICALS MARKET, BY TYPE, 2022-2030 (USD MILLION) 87
      62. TABLE 61 NORTH AMERICA BIO-BASED CHEMICALS MARKET, BY TYPE, 2022-2030 (KILOTONS) 87
      63. TABLE 62 NORTH AMERICA BIO-BASED CHEMICALS MARKET, BY APPLICATION, 2022-2030 (USD MILLION) 88
      64. TABLE 63 NORTH AMERICA BIO-BASED CHEMICALS MARKET, BY APPLICATION, 2022-2030 (KILOTONS) 88
      65. TABLE 64 US BIO-BASED CHEMICALS MARKET, BY TYPE, 2022-2030 (USD MILLION) 89
      66. TABLE 65 US BIO-BASED CHEMICALS MARKET, BY TYPE, 2022-2030 (KILOTONS) 89
      67. TABLE 66 US BIO-BASED CHEMICALS MARKET, BY APPLICATION, 2022-2030 (USD MILLION) 90
      68. TABLE 67 US BIO-BASED CHEMICALS MARKET, BY APPLICATION, 2022-2030 (KILOTONS) 90
      69. TABLE 68 CANADA BIO-BASED CHEMICALS MARKET, BY TYPE, 2022-2030 (USD MILLION) 91
      70. TABLE 69 CANADA BIO-BASED CHEMICALS MARKET, BY TYPE, 2022-2030 (KILOTONS) 91
      71. TABLE 70 CANADA BIO-BASED CHEMICALS MARKET, BY APPLICATION, 2022-2030 (USD MILLION) 92
      72. TABLE 71 CANADA BIO-BASED CHEMICALS MARKET, BY APPLICATION, 2022-2030 (KILOTONS) 93
      73. TABLE 72 EUROPE BIO-BASED CHEMICALS MARKET, BY COUNTRY, 2022-2030 (USD MILLION) 94
      74. TABLE 73 EUROPE BIO-BASED CHEMICALS MARKET, BY COUNTRY, 2022-2030 (KILOTONS) 95
      75. TABLE 74 EUROPE BIO-BASED CHEMICALS MARKET, BY TYPE, 2022-2030 (USD MILLION) 95
      76. TABLE 75 EUROPE BIO-BASED CHEMICALS MARKET, BY TYPE, 2022-2030 (KILOTONS) 96
      77. TABLE 76 EUROPE BIO-BASED CHEMICALS MARKET, BY APPLICATION, 2022-2030 (USD MILLION) 96
      78. TABLE 77 EUROPE BIO-BASED CHEMICALS MARKET, BY APPLICATION, 2022-2030 (KILOTONS) 97
      79. TABLE 78 GERMANY BIO-BASED CHEMICALS MARKET, BY TYPE, 2022-2030 (USD MILLION) 97
      80. TABLE 79 GERMANY BIO-BASED CHEMICALS MARKET, BY TYPE, 2022-2030 (KILOTONS) 98
      81. TABLE 80 GERMANY BIO-BASED CHEMICALS MARKET, BY APPLICATION, 2022-2030 (USD MILLION) 98
      82. TABLE 81 GERMANY BIO-BASED CHEMICALS MARKET, BY APPLICATION, 2022-2030 (KILOTONS) 99
      83. TABLE 82 UK BIO-BASED CHEMICALS MARKET, BY TYPE, 2022-2030 (USD MILLION) 99
      84. TABLE 83 UK BIO-BASED CHEMICALS MARKET, BY TYPE, 2022-2030 (KILOTONS) 100
      85. TABLE 84 UK BIO-BASED CHEMICALS MARKET, BY APPLICATION, 2022-2030 (USD MILLION) 100
      86. TABLE 85 UK BIO-BASED CHEMICALS MARKET, BY APPLICATION, 2022-2030 (KILOTONS) 101
      87. TABLE 86 RUSSIA BIO-BASED CHEMICALS MARKET, BY TYPE, 2022-2030 (USD MILLION) 102
      88. TABLE 87 RUSSIA BIO-BASED CHEMICALS MARKET, BY TYPE, 2022-2030 (KILOTONS) 102
      89. TABLE 88 RUSSIA BIO-BASED CHEMICALS MARKET, BY APPLICATION, 2022-2030 (USD MILLION) 103
      90. TABLE 89 RUSSIA BIO-BASED CHEMICALS MARKET, BY APPLICATION, 2022-2030 (KILOTONS) 104
      91. TABLE 90 FRANCE BIO-BASED CHEMICALS MARKET, BY TYPE, 2022-2030 (USD MILLION) 104
      92. TABLE 91 FRANCE BIO-BASED CHEMICALS MARKET, BY TYPE, 2022-2030 (KILOTONS) 105
      93. TABLE 92 FRANCE BIO-BASED CHEMICALS MARKET, BY APPLICATION, 2022-2030 (USD MILLION) 105
      94. TABLE 93 FRANCE BIO-BASED CHEMICALS MARKET, BY APPLICATION, 2022-2030 (KILOTONS) 106
      95. TABLE 94 SPAIN BIO-BASED CHEMICALS MARKET, BY TYPE, 2022-2030 (USD MILLION) 107
      96. TABLE 95 SPAIN BIO-BASED CHEMICALS MARKET, BY TYPE, 2022-2030 (KILOTONS) 107
      97. TABLE 96 SPAIN BIO-BASED CHEMICALS MARKET, BY APPLICATION, 2022-2030 (USD MILLION) 108
      98. TABLE 97 SPAIN BIO-BASED CHEMICALS MARKET, BY APPLICATION, 2022-2030 (KILOTONS) 109
      99. TABLE 98 ITALY BIO-BASED CHEMICALS MARKET, BY TYPE, 2022-2030 (USD MILLION) 109
      100. TABLE 99 ITALY BIO-BASED CHEMICALS MARKET, BY TYPE, 2022-2030 (KILOTONS) 110
      101. TABLE 100 ITALY BIO-BASED CHEMICALS MARKET, BY APPLICATION, 2022-2030 (USD MILLION) 110
      102. TABLE 101 ITALY BIO-BASED CHEMICALS MARKET, BY APPLICATION, 2022-2030 (KILOTONS) 111
      103. TABLE 102 REST OF EUROPE BIO-BASED CHEMICALS MARKET, BY TYPE, 2022-2030 (USD MILLION) 112
      104. TABLE 103 REST OF EUROPE BIO-BASED CHEMICALS MARKET, BY TYPE, 2022-2030 (KILOTONS) 112
      105. TABLE 104 REST OF EUROPE BIO-BASED CHEMICALS MARKET, BY APPLICATION, 2022-2030 (USD MILLION) 113
      106. TABLE 105 REST OF EUROPE BIO-BASED CHEMICALS MARKET, BY APPLICATION, 2022-2030 (KILOTONS) 114
      107. TABLE 106 ASIA-PACIFIC BIO-BASED CHEMICALS MARKET, BY COUNTRY, 2022-2030 (USD MILLION) 115
      108. TABLE 107 ASIA-PACIFIC BIO-BASED CHEMICALS MARKET, BY COUNTRY, 2022-2030 (KILOTONS) 116
      109. TABLE 108 ASIA-PACIFIC BIO-BASED CHEMICALS MARKET, BY TYPE, 2022-2030 (USD MILLION) 116
      110. TABLE 109 ASIA-PACIFIC BIO-BASED CHEMICALS MARKET, BY TYPE, 2022-2030 (KILOTONS) 117
      111. TABLE 110 ASIA-PACIFIC BIO-BASED CHEMICALS MARKET, BY APPLICATION, 2022-2030 (USD MILLION) 117
      112. TABLE 111 ASIA-PACIFIC BIO-BASED CHEMICALS MARKET, BY APPLICATION, 2022-2030 (KILOTONS) 118
      113. TABLE 112 CHINA BIO-BASED CHEMICALS MARKET, BY TYPE, 2022-2030 (USD MILLION) 119
      114. TABLE 113 CHINA BIO-BASED CHEMICALS MARKET, BY TYPE, 2022-2030 (KILOTONS) 119
      115. TABLE 114 CHINA BIO-BASED CHEMICALS MARKET, BY APPLICATION, 2022-2030 (USD MILLION) 120
      116. TABLE 115 CHINA BIO-BASED CHEMICALS MARKET, BY APPLICATION, 2022-2030 (KILOTONS) 121
      117. TABLE 116 INDIA BIO-BASED CHEMICALS MARKET, BY TYPE, 2022-2030 (USD MILLION) 121
      118. TABLE 117 INDIA BIO-BASED CHEMICALS MARKET, BY TYPE, 2022-2030 (KILOTONS) 122
      119. TABLE 118 INDIA BIO-BASED CHEMICALS MARKET, BY APPLICATION, 2022-2030 (USD MILLION) 122
      120. TABLE 119 INDIA BIO-BASED CHEMICALS MARKET, BY APPLICATION, 2022-2030 (KILOTONS) 123
      121. TABLE 120 JAPAN BIO-BASED CHEMICALS MARKET, BY TYPE, 2022-2030 (USD MILLION) 124
      122. TABLE 121 JAPAN BIO-BASED CHEMICALS MARKET, BY TYPE, 2022-2030 (KILOTONS) 124
      123. TABLE 122 JAPAN BIO-BASED CHEMICALS MARKET, BY APPLICATION, 2022-2030 (USD MILLION) 125
      124. TABLE 123 JAPAN BIO-BASED CHEMICALS MARKET, BY APPLICATION, 2022-2030 (KILOTONS) 126
      125. TABLE 124 AUSTRALIA & NEW ZEALAND BIO-BASED CHEMICALS MARKET, BY TYPE, 2022-2030 (USD MILLION) 126
      126. TABLE 125 AUSTRALIA & NEW ZEALAND BIO-BASED CHEMICALS MARKET, BY TYPE, 2022-2030 (KILOTONS) 127
      127. TABLE 126 AUSTRALIA & NEW ZEALAND BIO-BASED CHEMICALS MARKET, BY APPLICATION, 2022-2030 (USD MILLION) 127
      128. TABLE 127 AUSTRALIA & NEW ZEALAND BIO-BASED CHEMICALS MARKET, BY APPLICATION, 2022-2030 (KILOTONS) 128
      129. TABLE 128 SOUTH KOREA BIO-BASED CHEMICALS MARKET, BY TYPE, 2022-2030 (USD MILLION) 129
      130. TABLE 129 SOUTH KOREA BIO-BASED CHEMICALS MARKET, BY TYPE, 2022-2030 (KILOTONS) 129
      131. TABLE 130 SOUTH KOREA BIO-BASED CHEMICALS MARKET, BY APPLICATION, 2022-2030 (USD MILLION) 130
      132. TABLE 131 SOUTH KOREA BIO-BASED CHEMICALS MARKET, BY APPLICATION, 2022-2030 (KILOTONS) 131
      133. TABLE 132 REST OF ASIA-PACIFIC BIO-BASED CHEMICALS MARKET, BY TYPE, 2022-2030 (USD MILLION) 131
      134. TABLE 133 REST OF ASIA-PACIFIC BIO-BASED CHEMICALS MARKET, BY TYPE, 2022-2030 (KILOTONS) 132
      135. TABLE 134 REST OF ASIA-PACIFIC BIO-BASED CHEMICALS MARKET, BY APPLICATION, 2022-2030 (USD MILLION) 132
      136. TABLE 135 REST OF ASIA-PACIFIC BIO-BASED CHEMICALS MARKET, BY APPLICATION, 2022-2030 (KILOTONS) 133
      137. TABLE 136 LATIN AMERICA BIO-BASED CHEMICALS MARKET, BY COUNTRY, 2022-2030 (USD MILLION) 134
      138. TABLE 137 LATIN AMERICA BIO-BASED CHEMICALS MARKET, BY COUNTRY, 2022-2030 (KILOTONS) 134
      139. TABLE 138 LATIN AMERICA BIO-BASED CHEMICALS MARKET, BY TYPE, 2022-2030 (USD MILLION) 135
      140. TABLE 139 LATIN AMERICA BIO-BASED CHEMICALS MARKET, BY TYPE, 2022-2030 (KILOTONS) 135
      141. TABLE 140 LATIN AMERICA BIO-BASED CHEMICALS MARKET, BY APPLICATION, 2022-2030 (USD MILLION) 136
      142. TABLE 141 LATIN AMERICA BIO-BASED CHEMICALS MARKET, BY APPLICATION, 2022-2030 (KILOTONS) 137
      143. TABLE 142 BRAZIL BIO-BASED CHEMICALS MARKET, BY TYPE, 2022-2030 (USD MILLION) 137
      144. TABLE 143 BRAZIL BIO-BASED CHEMICALS MARKET, BY TYPE, 2022-2030 (KILOTONS) 138
      145. TABLE 144 BRAZIL BIO-BASED CHEMICALS MARKET, BY APPLICATION, 2022-2030 (USD MILLION) 138
      146. TABLE 145 BRAZIL BIO-BASED CHEMICALS MARKET, BY APPLICATION, 2022-2030 (KILOTONS) 139
      147. TABLE 146 MEXICO BIO-BASED CHEMICALS MARKET, BY TYPE, 2022-2030 (USD MILLION) 140
      148. TABLE 147 MEXICO BIO-BASED CHEMICALS MARKET, BY TYPE, 2022-2030 (KILOTONS) 140
      149. TABLE 148 MEXICO BIO-BASED CHEMICALS MARKET, BY APPLICATION, 2022-2030 (USD MILLION) 141
      150. TABLE 149 MEXICO BIO-BASED CHEMICALS MARKET, BY APPLICATION, 2022-2030 (KILOTONS) 142
      151. TABLE 150 ARGENTINA BIO-BASED CHEMICALS MARKET, BY TYPE, 2022-2030 (USD MILLION) 142
      152. TABLE 151 ARGENTINA BIO-BASED CHEMICALS MARKET, BY TYPE, 2022-2030 (KILOTONS) 143
      153. TABLE 152 ARGENTINA BIO-BASED CHEMICALS MARKET, BY APPLICATION, 2022-2030 (USD MILLION) 143
      154. TABLE 153 ARGENTINA BIO-BASED CHEMICALS MARKET, BY APPLICATION, 2022-2030 (KILOTONS) 144
      155. TABLE 154 REST OF LATIN AMERICA BIO-BASED CHEMICALS MARKET, BY TYPE, 2022-2030 (USD MILLION) 145
      156. TABLE 155 REST OF LATIN AMERICA BIO-BASED CHEMICALS MARKET, BY TYPE, 2022-2030 (KILOTONS) 145
      157. TABLE 156 REST OF LATIN AMERICA BIO-BASED CHEMICALS MARKET, BY APPLICATION, 2022-2030 (USD MILLION) 146
      158. TABLE 157 REST OF LATIN AMERICA BIO-BASED CHEMICALS MARKET, BY APPLICATION, 2022-2030 (KILOTONS) 147
      159. TABLE 158 MIDDLE EAST & AFRICA BIO-BASED CHEMICALS MARKET, BY COUNTRY, 2022-2030 (USD MILLION) 148
      160. TABLE 159 MIDDLE EAST & AFRICA BIO-BASED CHEMICALS MARKET, BY COUNTRY, 2022-2030 (KILOTONS) 149
      161. TABLE 160 MIDDLE EAST & AFRICA BIO-BASED CHEMICALS MARKET, BY TYPE, 2022-2030 (USD MILLION) 149
      162. TABLE 161 MIDDLE EAST & AFRICA BIO-BASED CHEMICALS MARKET, BY TYPE, 2022-2030 (KILOTONS) 150
      163. TABLE 162 MIDDLE EAST & AFRICA BIO-BASED CHEMICALS MARKET, BY APPLICATION, 2022-2030 (USD MILLION) 150
      164. TABLE 163 MIDDLE EAST & AFRICA BIO-BASED CHEMICALS MARKET, BY APPLICATION, 2022-2030 (KILOTONS) 151
      165. TABLE 164 GCC COUNTRIES BIO-BASED CHEMICALS MARKET, BY TYPE, 2022-2030 (USD MILLION) 151
      166. TABLE 165 GCC COUNTRIES BIO-BASED CHEMICALS MARKET, BY TYPE, 2022-2030 (KILOTONS) 152
      167. TABLE 166 GCC COUNTRIES BIO-BASED CHEMICALS MARKET, BY APPLICATION, 2022-2030 (USD MILLION) 152
      168. TABLE 167 GCC COUNTRIES BIO-BASED CHEMICALS MARKET, BY APPLICATION, 2022-2030 (KILOTONS) 153
      169. TABLE 168 ISRAEL BIO-BASED CHEMICALS MARKET, BY TYPE, 2022-2030 (USD MILLION) 154
      170. TABLE 169 ISRAEL BIO-BASED CHEMICALS MARKET, BY TYPE, 2022-2030 (KILOTONS) 154
      171. TABLE 170 ISRAEL BIO-BASED CHEMICALS MARKET, BY APPLICATION, 2022-2030 (USD MILLION) 155
      172. TABLE 171 ISRAEL BIO-BASED CHEMICALS MARKET, BY APPLICATION, 2022-2030 (KILOTONS) 156
      173. TABLE 172 SOUTH AFRICA BIO-BASED CHEMICALS MARKET, BY TYPE, 2022-2030 (USD MILLION) 156
      174. TABLE 173 SOUTH AFRICA BIO-BASED CHEMICALS MARKET, BY TYPE, 2022-2030 (KILOTONS) 157
      175. TABLE 174 SOUTH AFRICA BIO-BASED CHEMICALS MARKET, BY APPLICATION, 2022-2030 (USD MILLION) 157
      176. TABLE 175 SOUTH AFRICA BIO-BASED CHEMICALS MARKET, BY APPLICATION, 2022-2030 (KILOTONS) 158
      177. TABLE 176 REST OF THE MIDDLE EAST & AFRICA BIO-BASED CHEMICALS MARKET, BY TYPE, 2022-2030 (USD MILLION) 159
      178. TABLE 177 REST OF THE MIDDLE EAST & AFRICA BIO-BASED CHEMICALS MARKET, BY TYPE, 2022-2030 (KILOTONS) 159
      179. TABLE 178 REST OF THE MIDDLE EAST & AFRICA BIO-BASED CHEMICALS MARKET, BY APPLICATION, 2022-2030 (USD MILLION) 160
      180. TABLE 179 REST OF THE MIDDLE EAST & AFRICA BIO-BASED CHEMICALS MARKET, BY APPLICATION, 2022-2030 (KILOTONS) 161
      181. TABLE 180 KEY DEVELOPMENTS & GROWTH STRATEGIES 163
      182. TABLE 181 BASF SE: PRODUCTS OFFERED 168
      183. TABLE 182 BASF SE: KEY DEVELOPMENTS 170
      184. TABLE 183 DUPONT: PRODUCTS OFFERED 173
      185. TABLE 184 DUPONT: KEY DEVELOPMENTS 173
      186. TABLE 185 VERTEC BIOSOLVENTS: PRODUCTS OFFERED 175
      187. TABLE 186 AGAE TECHNOLOGIES, LLC: PRODUCTS OFFERED 177
      188. TABLE 187 TOTALENERGIES: PRODUCTS OFFERED 180
      189. TABLE 188 TOTALENERGIES: KEY DEVELOPMENTS 180
      190. TABLE 189 ARCHER DANIELS MIDLAND COMPANY: PRODUCTS OFFERED 183
      191. TABLE 190 ARCHER DANIELS MIDLAND COMPANY: KEY DEVELOPMENTS 183
      192. TABLE 191 BRASKEM: PRODUCTS OFFERED 186
      193. TABLE 192 EVONIK INDUSTRIES AG.: PRODUCTS OFFERED 189
      194. TABLE 193 TORAY INDUSTRIES INC: PRODUCTS OFFERED 193
      195. TABLE 194 TORAY INDUSTRIES INC: KEY DEVELOPMENTS 193
      196. TABLE 195 MITSUBISHI CHEMICAL CORPORATION: PRODUCTS OFFERED 196
      197. TABLE 196 MITSUBISHI CHEMICAL CORPORATION: KEY DEVELOPMENTS 196
      198. TABLE 197 CARGILL, INCORPORATED: PRODUCTS OFFERED 199
      199. TABLE 198 CARGILL, INCORPORATED: KEY DEVELOPMENTS 200
      200. TABLE 199 DSM: PRODUCTS OFFERED 203
      201. TABLE 200 DSM: KEY DEVELOPMENTS 203
      202. TABLE 201 ITACONIX PLC: PRODUCTS OFFERED 206
      203. TABLE 202 LYONDELLBASELL: PRODUCTS OFFERED 209
      204. TABLE 203 GFBIOCHEMICALS LTD: PRODUCTS OFFERED 211   LIST OF FIGURES
      205. FIGURE 1 MARKET SYNOPSIS 19
      206. FIGURE 2 MARKET ATTRACTIVENESS ANALYSIS: GLOBAL BIO-BASED CHEMICALS MARKET, 2020 20
      207. FIGURE 3 GLOBAL BIO-BASED CHEMICALS MARKET ANALYSIS BY TYPE 21
      208. FIGURE 4 GLOBAL BIO-BASED CHEMICALS MARKET ANALYSIS BY APPLICATION 22
      209. FIGURE 5 GLOBAL BIO-BASED CHEMICALS MARKET ANALYSIS BY REGION 23
      210. FIGURE 6 GLOBAL BIO-BASED CHEMICALS MARKET: MARKET STRUCTURE 25
      211. FIGURE 7 RESEARCH PROCESS OF MRFR 26
      212. FIGURE 8 MARKET DYNAMICS OVERVIEW 32
      213. FIGURE 9 GLOBAL BIOPLASTICS PRODUCTION CAPACITIES, 2018 34
      214. FIGURE 10 TRANSPORTATION BIOFUELS, 2019 35
      215. FIGURE 11 GROWTH OF BIOFUEL ANNUAL PRODUCTION (%) (ACTUAL VS REQUIRED) 35
      216. FIGURE 12 DRIVERS IMPACT ANALYSIS 36
      217. FIGURE 13 RESTRAINTS IMPACT ANALYSIS 38
      218. FIGURE 14 UPPLY CHAIN ANALYSIS FOR GLOBAL BIO-BASED CHEMICALS MARKET 42
      219. FIGURE 15 PORTER''S FIVE FORCES ANALYSIS OF THE GLOBAL BIO-BASED CHEMICALS MARKET 48
      220. FIGURE 16 CRUDE OIL PRICE FLUCTUATIONS, WTI 55
      221. FIGURE 17 GLOBAL BIO-BASED CHEMICALS MARKET, BY TYPE, 2022-2030 (USD MILLION) 58
      222. FIGURE 18 GLOBAL BIO-BASED CHEMICALS MARKET, BY TYPE, 2022-2030 (KILOTONS) 59
      223. FIGURE 19 GLOBAL BIO-BASED CHEMICALS MARKET, BY APPLICATION, 2022-2030 (USD MILLION) 68
      224. FIGURE 20 GLOBAL BIO-BASED CHEMICALS MARKET, BY APPLICATION, 2022-2030 (KILOTONS) 70
      225. FIGURE 21 GLOBAL BIO-BASED CHEMICALS MARKET BY REGION, 2022-2030 (USD MILLION) 84
      226. FIGURE 22 GLOBAL BIO-BASED CHEMICALS MARKET BY REGION, 2022-2030 (KILOTONS) 85
      227. FIGURE 23 NORTH AMERICA BIO-BASED CHEMICALS MARKET, BY COUNTRY, 2020 (%SHARE) 86
      228. FIGURE 24 EUROPE BIO-BASED CHEMICALS MARKET, BY COUNTRY, 2020 (%SHARE) 94
      229. FIGURE 25 ASIA-PACIFIC BIO-BASED CHEMICALS MARKET, BY COUNTRY, 2020 (%SHARE) 115
      230. FIGURE 26 LATIN AMERICA BIO-BASED CHEMICALS MARKET, BY COUNTRY, 2020 (%SHARE) 134
      231. FIGURE 27 MIDDLE EAST & AFRICA BIO-BASED CHEMICALS MARKET, BY COUNTRY, 2020 (%SHARE) 148
      232. FIGURE 28 MARKET STRATEGY ANALYSIS 162
      233. FIGURE 29 COMPETITIVE BENCHMARKING 166
      234. FIGURE 30 BASF SE: FINANCIAL OVERVIEW SNAPSHOT 168
      235. FIGURE 31 BASF SE: SWOT ANALYSIS 170
      236. FIGURE 32 DUPONT: FINANCIAL OVERVIEW SNAPSHOT 172
      237. FIGURE 33 DUPONT: SWOT ANALYSIS 174
      238. FIGURE 34 VERTEC BIOSOLVENTS: SWOT ANALYSIS 176
      239. FIGURE 35 AGAE TECHNOLOGIES, LLC: SWOT ANALYSIS 178
      240. FIGURE 36 TOTALENERGIES: FINANCIAL OVERVIEW SNAPSHOT 179
      241. FIGURE 37 TOTALENERGIES: SWOT ANALYSIS 181
      242. FIGURE 38 ARCHER DANIELS MIDLAND COMPANY: FINANCIAL OVERVIEW SNAPSHOT 182
      243. FIGURE 39 ARCHER DANIELS MIDLAND COMPANY: SWOT ANALYSIS 184
      244. FIGURE 40 BRASKEM: FINANCIAL OVERVIEW SNAPSHOT 185
      245. FIGURE 41 BRASKEM: SWOT ANALYSIS 187
      246. FIGURE 42 EVONIK INDUSTRIES AG: FINANCIAL OVERVIEW 189
      247. FIGURE 43 EVONIK INDUSTRIES AG: SWOT ANALYSIS 191
      248. FIGURE 44 TORAY INDUSTRIES INC: FINANCIAL OVERVIEW SNAPSHOT 192
      249. FIGURE 45 TORAY INDUSTRIES INC: SWOT ANALYSIS 194
      250. FIGURE 46 MITSUBISHI CHEMICAL CORPORATION: FINANCIAL OVERVIEW SNAPSHOT 195
      251. FIGURE 47 MITSUBISHI CHEMICAL CORPORATION: SWOT ANALYSIS 197
      252. FIGURE 48 CARGILL, INCORPORATED: FINANCIAL OVERVIEW SNAPSHOT 198
      253. FIGURE 49 CARGILL, INCORPORATED.: SWOT ANALYSIS 201
      254. FIGURE 50 DSM: FINANCIAL OVERVIEW SNAPSHOT 202
      255. FIGURE 51 DSM: SWOT ANALYSIS 204
      256. FIGURE 52 ITACONIX PLC: FINANCIAL OVERVIEW SNAPSHOT 205
      257. FIGURE 53 ITACONIX PLC: SWOT ANALYSIS 206
      258. FIGURE 54 LYONDELLBASELL: FINANCIAL OVERVIEW SNAPSHOT 208
      259. FIGURE 55 LYONDELLBASELL: SWOT ANALYSIS 210
      260. FIGURE 56 GFBIOCHEMICALS LTD: SWOT ANALYSIS 212

    Bio-based Chemicals Market Segmentation

    Bio-based Chemicals Type Outlook (USD Million, 2018-2030)

    • Bio-alcohols
    • Bio-plastics
    • Bio-lubricants
    • Bio-solvents
    • Bio-surfactants
    • Bio-based acids

    Bio-based Chemicals Application Outlook (USD Million, 2018-2030)

    • Food & beverages
    • Agriculture
    • Automotive
    • Personal Care
    • Packaging
    • Detergents & cleaner
    • Paints & coating
    • Adhesives and sealants
    • Pharmaceutical
    • Paint dispersion

    Bio-based Chemicals Regional Outlook (USD Million, 2018-2030)

    • North America Outlook (USD Million, 2018-2030)

      • North America Bio-based Chemicals by Type
        • Bio-alcohols
        • Bio-plastics
        • Bio-lubricants
        • Bio-solvents
        • Bio-surfactants
        • Bio-based acids
      • North America Bio-based Chemicals by Application
        • Food & beverages
        • Agriculture
        • Automotive
        • Personal Care
        • Packaging
        • Detergents & cleaner
        • Paints & coating
        • Adhesives and sealants
        • Pharmaceutical
        • Paint dispersion
      • US Outlook (USD Million, 2018-2030)

      • US Bio-based Chemicals by Type
        • Bio-alcohols
        • Bio-plastics
        • Bio-lubricants
        • Bio-solvents
        • Bio-surfactants
        • Bio-based acids
      • US Bio-based Chemicals by Application
        • Food & beverages
        • Agriculture
        • Automotive
        • Personal Care
        • Packaging
        • Detergents & cleaner
        • Paints & coating
        • Adhesives and sealants
        • Pharmaceutical
        • Paint dispersion
      • CANADA Outlook (USD Million, 2018-2030)

      • CANADA Bio-based Chemicals by Type
        • Bio-alcohols
        • Bio-plastics
        • Bio-lubricants
        • Bio-solvents
        • Bio-surfactants
        • Bio-based acids
      • CANADA Bio-based Chemicals by Application
        • Food & beverages
        • Agriculture
        • Automotive
        • Personal Care
        • Packaging
        • Detergents & cleaner
        • Paints & coating
        • Adhesives and sealants
        • Pharmaceutical
        • Paint dispersion
    • Europe Outlook (USD Million, 2018-2030)

      • Europe Bio-based Chemicals by Type
        • Bio-alcohols
        • Bio-plastics
        • Bio-lubricants
        • Bio-solvents
        • Bio-surfactants
        • Bio-based acids
      • Europe Bio-based Chemicals by Application
        • Food & beverages
        • Agriculture
        • Automotive
        • Personal Care
        • Packaging
        • Detergents & cleaner
        • Paints & coating
        • Adhesives and sealants
        • Pharmaceutical
        • Paint dispersion
      • Germany Outlook (USD Million, 2018-2030)

      • Germany Bio-based Chemicals by Type
        • Bio-alcohols
        • Bio-plastics
        • Bio-lubricants
        • Bio-solvents
        • Bio-surfactants
        • Bio-based acids
      • Germany Bio-based Chemicals by Application
        • Food & beverages
        • Agriculture
        • Automotive
        • Personal Care
        • Packaging
        • Detergents & cleaner
        • Paints & coating
        • Adhesives and sealants
        • Pharmaceutical
        • Paint dispersion
      • France Outlook (USD Million, 2018-2030)

      • France Bio-based Chemicals by Type
        • Bio-alcohols
        • Bio-plastics
        • Bio-lubricants
        • Bio-solvents
        • Bio-surfactants
        • Bio-based acids
      • France Bio-based Chemicals by Application
        • Food & beverages
        • Agriculture
        • Automotive
        • Personal Care
        • Packaging
        • Detergents & cleaner
        • Paints & coating
        • Adhesives and sealants
        • Pharmaceutical
        • Paint dispersion
      • UK Outlook (USD Million, 2018-2030)

      • UK Bio-based Chemicals by Type
        • Bio-alcohols
        • Bio-plastics
        • Bio-lubricants
        • Bio-solvents
        • Bio-surfactants
        • Bio-based acids
      • UK Bio-based Chemicals by Application
        • Food & beverages
        • Agriculture
        • Automotive
        • Personal Care
        • Packaging
        • Detergents & cleaner
        • Paints & coating
        • Adhesives and sealants
        • Pharmaceutical
        • Paint dispersion
      • ITALY Outlook (USD Million, 2018-2030)

      • ITALY Bio-based Chemicals by Type
        • Bio-alcohols
        • Bio-plastics
        • Bio-lubricants
        • Bio-solvents
        • Bio-surfactants
        • Bio-based acids
      • ITALY Bio-based Chemicals by Application
        • Food & beverages
        • Agriculture
        • Automotive
        • Personal Care
        • Packaging
        • Detergents & cleaner
        • Paints & coating
        • Adhesives and sealants
        • Pharmaceutical
        • Paint dispersion
      • SPAIN Outlook (USD Million, 2018-2030)

      • Spain Bio-based Chemicals by Type
        • Bio-alcohols
        • Bio-plastics
        • Bio-lubricants
        • Bio-solvents
        • Bio-surfactants
        • Bio-based acids
      • Spain Bio-based Chemicals by Application
        • Food & beverages
        • Agriculture
        • Automotive
        • Personal Care
        • Packaging
        • Detergents & cleaner
        • Paints & coating
        • Adhesives and sealants
        • Pharmaceutical
        • Paint dispersion
      • Rest Of Europe Outlook (USD Million, 2018-2030)

      • REST OF EUROPE Bio-based Chemicals by Type
        • Bio-alcohols
        • Bio-plastics
        • Bio-lubricants
        • Bio-solvents
        • Bio-surfactants
        • Bio-based acids
      • REST OF EUROPE Bio-based Chemicals by Application
        • Food & beverages
        • Agriculture
        • Automotive
        • Personal Care
        • Packaging
        • Detergents & cleaner
        • Paints & coating
        • Adhesives and sealants
        • Pharmaceutical
        • Paint dispersion
    • Asia-Pacific Outlook (USD Million, 2018-2030)

      • Asia-Pacific Bio-based Chemicals by Type
        • Bio-alcohols
        • Bio-plastics
        • Bio-lubricants
        • Bio-solvents
        • Bio-surfactants
        • Bio-based acids
      • Asia-Pacific Bio-based Chemicals by Application
        • Food & beverages
        • Agriculture
        • Automotive
        • Personal Care
        • Packaging
        • Detergents & cleaner
        • Paints & coating
        • Adhesives and sealants
        • Pharmaceutical
        • Paint dispersion
      • China Outlook (USD Million, 2018-2030)

      • China Bio-based Chemicals by Type
        • Bio-alcohols
        • Bio-plastics
        • Bio-lubricants
        • Bio-solvents
        • Bio-surfactants
        • Bio-based acids
      • China Bio-based Chemicals by Application
        • Food & beverages
        • Agriculture
        • Automotive
        • Personal Care
        • Packaging
        • Detergents & cleaner
        • Paints & coating
        • Adhesives and sealants
        • Pharmaceutical
        • Paint dispersion
      • Japan Outlook (USD Million, 2018-2030)

      • Japan Bio-based Chemicals by Type
        • Bio-alcohols
        • Bio-plastics
        • Bio-lubricants
        • Bio-solvents
        • Bio-surfactants
        • Bio-based acids
      • Japan Bio-based Chemicals by Application
        • Food & beverages
        • Agriculture
        • Automotive
        • Personal Care
        • Packaging
        • Detergents & cleaner
        • Paints & coating
        • Adhesives and sealants
        • Pharmaceutical
        • Paint dispersion
      • India Outlook (USD Million, 2018-2030)

      • India Bio-based Chemicals by Type
        • Bio-alcohols
        • Bio-plastics
        • Bio-lubricants
        • Bio-solvents
        • Bio-surfactants
        • Bio-based acids
      • India Bio-based Chemicals by Application
        • Food & beverages
        • Agriculture
        • Automotive
        • Personal Care
        • Packaging
        • Detergents & cleaner
        • Paints & coating
        • Adhesives and sealants
        • Pharmaceutical
        • Paint dispersion
      • Australia Outlook (USD Million, 2018-2030)

      • Australia Bio-based Chemicals by Type
        • Bio-alcohols
        • Bio-plastics
        • Bio-lubricants
        • Bio-solvents
        • Bio-surfactants
        • Bio-based acids
      • Australia Bio-based Chemicals by Application
        • Food & beverages
        • Agriculture
        • Automotive
        • Personal Care
        • Packaging
        • Detergents & cleaner
        • Paints & coating
        • Adhesives and sealants
        • Pharmaceutical
        • Paint dispersion
      • Rest of Asia-Pacific Outlook (USD Million, 2018-2030)

      • Rest of Asia-Pacific Bio-based Chemicals by Type
        • Bio-alcohols
        • Bio-plastics
        • Bio-lubricants
        • Bio-solvents
        • Bio-surfactants
        • Bio-based acids
      • Rest of Asia-Pacific Bio-based Chemicals by Application
        • Food & beverages
        • Agriculture
        • Automotive
        • Personal Care
        • Packaging
        • Detergents & cleaner
        • Paints & coating
        • Adhesives and sealants
        • Pharmaceutical
        • Paint dispersion
    • Rest of the World Outlook (USD Million, 2018-2030)

      • Rest of the World Bio-based Chemicals by Type
        • Bio-alcohols
        • Bio-plastics
        • Bio-lubricants
        • Bio-solvents
        • Bio-surfactants
        • Bio-based acids
      • Rest of the World Bio-based Chemicals by Application
        • Food & beverages
        • Agriculture
        • Automotive
        • Personal Care
        • Packaging
        • Detergents & cleaner
        • Paints & coating
        • Adhesives and sealants
        • Pharmaceutical
        • Paint dispersion
      • Middle East Outlook (USD Million, 2018-2030)

      • Middle East Bio-based Chemicals by Type
        • Bio-alcohols
        • Bio-plastics
        • Bio-lubricants
        • Bio-solvents
        • Bio-surfactants
        • Bio-based acids
      • Middle East Bio-based Chemicals by Application
        • Food & beverages
        • Agriculture
        • Automotive
        • Personal Care
        • Packaging
        • Detergents & cleaner
        • Paints & coating
        • Adhesives and sealants
        • Pharmaceutical
        • Paint dispersion
      • Africa Outlook (USD Million, 2018-2030)

      • Africa Bio-based Chemicals by Type
        • Bio-alcohols
        • Bio-plastics
        • Bio-lubricants
        • Bio-solvents
        • Bio-surfactants
        • Bio-based acids
      • Africa Bio-based Chemicals by Application
        • Food & beverages
        • Agriculture
        • Automotive
        • Personal Care
        • Packaging
        • Detergents & cleaner
        • Paints & coating
        • Adhesives and sealants
        • Pharmaceutical
        • Paint dispersion
      • Latin America Outlook (USD Million, 2018-2030)

      • Latin America Bio-based Chemicals by Type
        • Bio-alcohols
        • Bio-plastics
        • Bio-lubricants
        • Bio-solvents
        • Bio-surfactants
        • Bio-based acids
      • Latin America Bio-based Chemicals by Application
        • Food & beverages
        • Agriculture
        • Automotive
        • Personal Care
        • Packaging
        • Detergents & cleaner
        • Paints & coating
        • Adhesives and sealants
        • Pharmaceutical
        • Paint dispersion
    Infographic

    Free Sample Request

    Kindly complete the form below to receive a free sample of this Report

    Get Free Sample

    Customer Strories

    “I am very pleased with how market segments have been defined in a relevant way for my purposes (such as "Portable Freezers & refrigerators" and "last-mile"). In general the report is well structured. Thanks very much for your efforts.”

    Victoria Milne

    Founder
    Case Study
    Chemicals and Materials