Segmentation Quick Reference
| Dimension | Sub-Segments | Dominant Segment | Fastest Growing Segment |
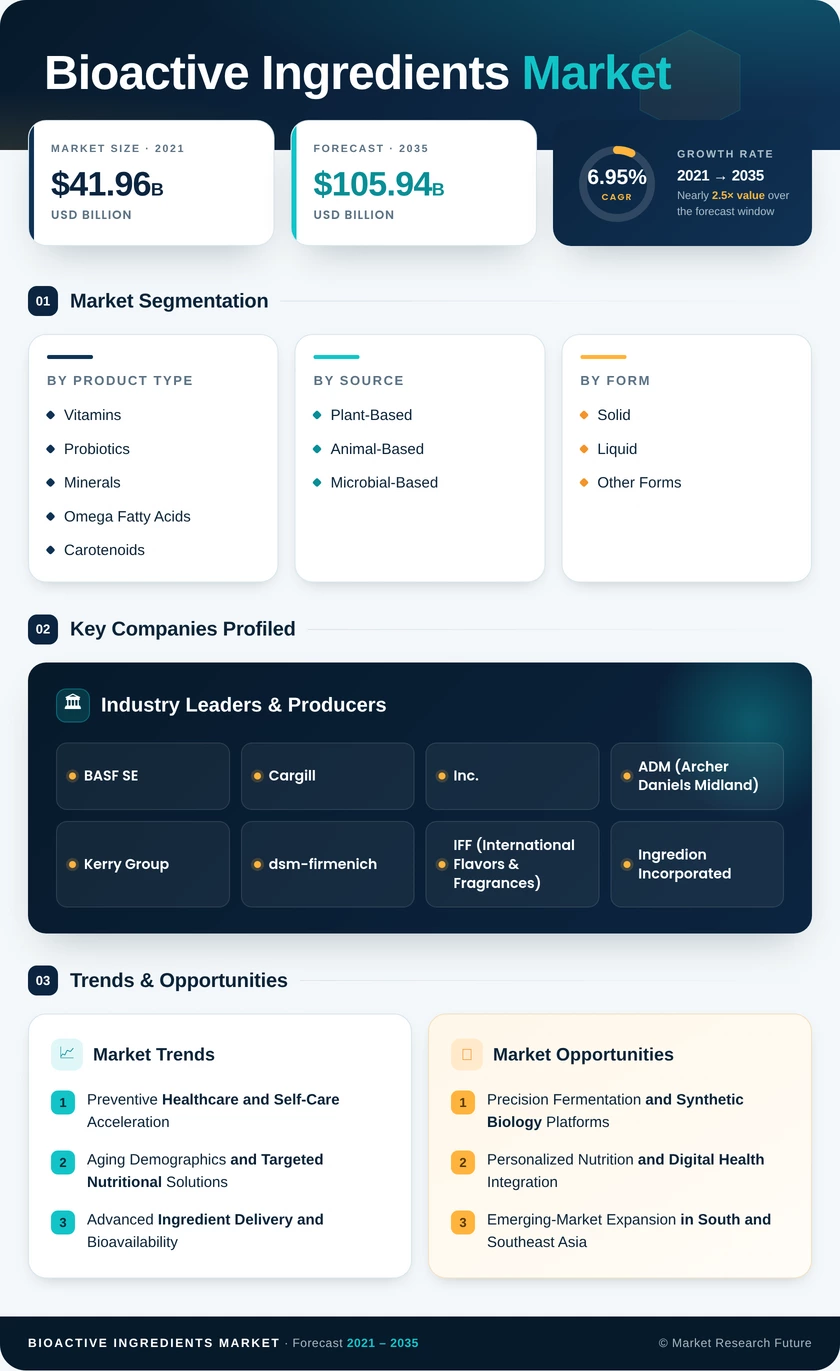
| Product Type | Vitamins, Probiotics, Minerals, Omega Fatty Acids, Carotenoids, Plant Extracts & Others | Vitamins | Probiotics |
| Source | Plant-Based, Animal-Based, Microbial-Based | Plant-Based | Microbial-Based |
| Form | Solid, Liquid, Other Forms | Solid | Liquid |
| Application | Dietary Supplements, Food & Beverages, Bioactive Ingredients Markets, Personal Care & Cosmetics, Animal Nutrition | Dietary Supplements | Food & Beverages |
| Geography | North America, Europe, Asia-Pacific, South America, Middle East & Africa | Europe | Asia-Pacific |
Market Segmentation Overview
By Product Type
| Sub-Segment | Key Trend |
| Vitamins | Immune-support positioning sustains premium demand post-pandemic |
| Probiotics | Strain-specific clinical validation accelerating commercial adoption |
| Minerals | Micronutrient deficiency awareness driving fortification programs |
| Omega Fatty Acids | Algae-derived omega-3 alternatives are gaining market traction |
| Carotenoids | Dual-use as a bioactive and natural colorant expands addressable applications |
| Plant Extracts & Others | Clean-label reformulation creating new demand from mainstream food brands |
Vitamins and probiotics together represent the core growth engine of the product-type segmentation, while minerals maintain steady volume-driven demand through government-led fortification initiatives worldwide.
By Source
| Sub-Segment | Key Trend |
| Plant-Based | Dominant share driven by consumer preference for naturally derived ingredients |
| Animal-Based | Marine-sourced omega-3 and collagen peptides sustain demand despite vegan competition |
| Microbial-Based | Precision fermentation scalability positioning microbial sources as a strategic growth vector |
Plant-based sourcing retains its majority position, but microbial-based ingredients are capturing increasing R&D investment as fermentation economics improve and supply-chain resilience becomes a strategic priority.
By Form
| Sub-Segment | Key Trend |
| Solid | Tablets, capsules, and powders dominate through established manufacturing and consumer familiarity |
| Liquid | Ready-to-drink functional beverages are driving rapid format adoption |
| Other Forms | Gummies and gel formats are expanding through improved taste and convenience profiles |
Solid formats continue to lead on volume, while liquid delivery is reshaping the competitive landscape through functional beverage innovation and enhanced bioavailability profiles.
By Application
| Sub-Segment | Key Trend |
| Dietary Supplements | Preventive health spending and e-commerce distribution sustaining category leadership |
| Food & Beverages | Fortification mandates and functional food innovation are driving the fastest application growth |
| Bioactive Ingredients Markets | Clinical-grade bioactives bridging the supplement-pharma boundary |
| Personal Care & Cosmetics | Nutricosmetics and ingestible beauty are creating cross-category demand |
| Animal Nutrition | Pet wellness premiumization and livestock productivity optimization are expanding use cases |
Dietary supplements anchor the application segmentation, while food and beverage applications are converging with supplement functionality as consumers seek bioactive benefits integrated into everyday consumption patterns.