Bioactive Ingredients Market Summary
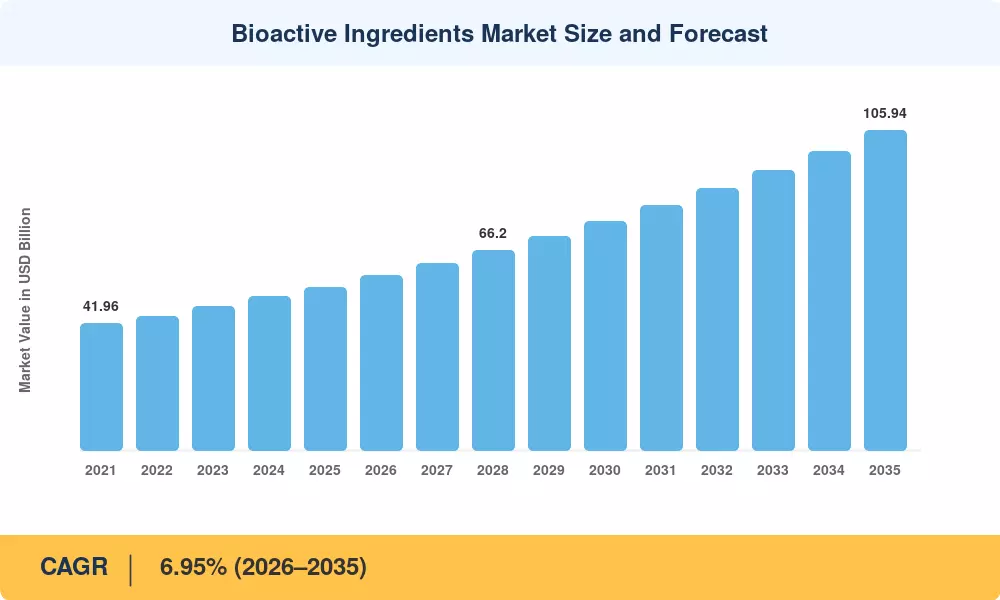
The Bioactive Ingredients Market reached a valuation of USD 54.12 billion in 2025 and is projected to climb from USD 57.88 billion in 2026 to USD 105.94 billion by 2035, registering a CAGR of 6.95% during the forecast period. This expansion is anchored in tightening food-safety mandates across the EU and North America, where regulators have fast-tracked ingredient-approval pathways under updated Novel Food frameworks and GRAS designation reforms [1]. Global investment in functional food R&D crossed USD 12.4 billion in 2024, signaling strong institutional confidence in the sector's long-term trajectory [2].
A fundamental shift is underway in how bioactive compounds reach consumers. Traditional extraction and isolation methods are giving way to precision fermentation, enzyme-directed synthesis, and encapsulation platforms that dramatically improve bioavailability. The European Commission's Horizon Europe program alone allocated EUR 1.8 billion toward sustainable food-ingredient innovation between 2021 and 2025, while the U.S. National Institutes of Health expanded nutrigenomics funding by 23% year-over-year in fiscal year 2024 [3] [4].
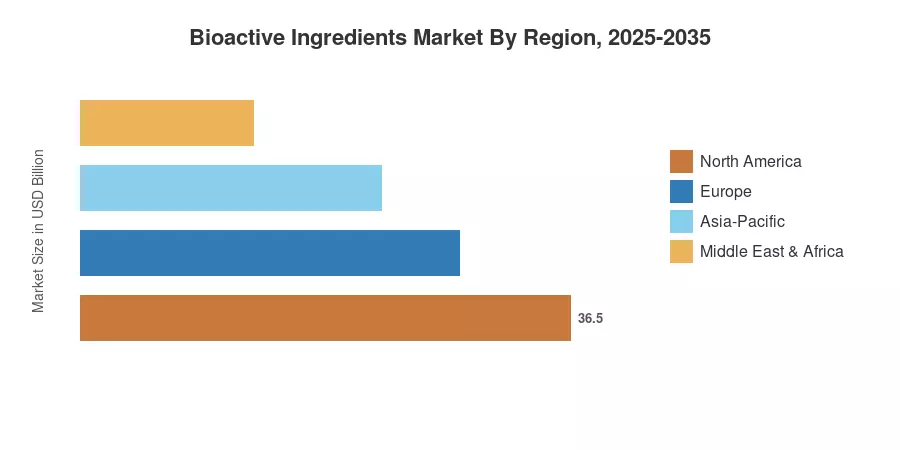
Europe commanded approximately 36.65% of the Bioactive Ingredients Market in 2025, driven by its mature regulatory infrastructure and deeply embedded supplement culture. Asia-Pacific is poised to be the fastest-growing region at a 11.46% CAGR through 2035, propelled by rising middle-class purchasing power in China and India. North America held the second-largest share at roughly 28.10%, underpinned by robust demand for dietary supplement formulations. The Bioactive Ingredients Market stands at an inflection point where demographic aging, personalized nutrition breakthroughs, and clean-label consumer preferences converge.
Key Report Takeaways
• By Product Type
- Vitamins accounted for an estimated 24.50% of the Bioactive Ingredients Market revenue in 2025, reflecting their entrenched role in daily supplement regimens globally.
- Probiotics are forecast to expand at a 9.75% CAGR from 2026 to 2035, fueled by mounting clinical evidence linking gut-health formulations to immune-system support.
• By Source
- Plant-based ingredients captured approximately 57.82% of the Bioactive Ingredients Market share in 2025, supported by consumer preference for naturally derived compounds.
• By Form
- Liquid formats are projected to grow at an 11.97% CAGR through 2035, as ready-to-drink functional beverages gain shelf space in retail channels worldwide.
• By Region
- Europe retained its leadership position within the Bioactive Ingredients Market during 2025, generating over one-third of global revenue.
- Asia-Pacific is set to register the fastest regional growth, with dietary-supplement adoption accelerating across Southeast Asian economies.
Bioactive Ingredients Market Size and Forecast (2021–2035)
Market Research Future's estimation framework integrates bottom-up revenue modeling from manufacturer shipments, import/export trade data, and proprietary demand-side surveys across 42 countries. Historical figures (2021–2024) are validated against published company financials and customs databases, while forecast projections apply regression-adjusted CAGR modeling calibrated to macroeconomic and regulatory indicators.