Download Free Sample
Kindly complete the form below to receive a free sample of this Report
Biodegradable Materials Production Equipment MRO Services Market Research Report By End Use (Food Industry, Pharmaceuticals, Personal Care, Construction, Automotive), By Technology (Thermoplastic, Biocomposite, Additive Manufacturing, Injection Molding, Blow Molding), By Application (Packaging, Agriculture, Textiles, Consumer Goods, Medical), By Service Type (Maintenance, Repair, Overhaul, Consultation, Training), By Material Type (Starch-Based, Polylactic Acid, Cellulose-Based, Polyhydroxyalkanoates, Protein-Based) And By Region (North America, Europe, Asia-Pacific, And Rest Of The World) – Market Forecast Till 2035.
As per MRFR analysis, the Biodegradable Materials Production Equipment MRO Services Market was estimated at 3.5 USD Billion in 2024. The market is projected to grow from 3.75 USD Billion in 2025 to 7.5 USD Billion by 2035, exhibiting a compound annual growth rate (CAGR) of 7.17% during the forecast period 2025 - 2035.
The Biodegradable Materials Production Equipment MRO Services Market is poised for substantial growth driven by sustainability and technological advancements.
| 2024 Market Size | 3.5 (USD Billion) |
| 2035 Market Size | 7.5 (USD Billion) |
| CAGR (2025 - 2035) | 7.17% |
BASF SE (DE), Novamont S.p.A. (IT), NatureWorks LLC (US), Total Corbion PLA (NL), Braskem S.A. (BR), Mitsubishi Chemical Corporation (JP), Futerro (BE), Green Dot Bioplastics (US), Bio-on S.p.A. (IT)
Our Impact
Enabled $4.3B Revenue Impact for Fortune 500 and Leading Multinationals
Partnering with 2000+ Global Organizations Each Year
30K+ Citations by Top-Tier Firms in the Industry
The Biodegradable Materials Production Equipment MRO Services Market is currently experiencing a notable evolution, driven by increasing environmental awareness and regulatory pressures. As industries seek sustainable alternatives, the demand for biodegradable materials has surged, prompting a corresponding need for maintenance, repair, and operations services tailored to this sector. This market appears to be characterized by a growing emphasis on innovation, with companies investing in advanced technologies to enhance the efficiency and effectiveness of production equipment. Furthermore, the integration of smart technologies into MRO services is likely to optimize operational processes, thereby reducing downtime and improving overall productivity. In addition, the Biodegradable Materials Production Equipment MRO Services Market seems to be influenced by shifting consumer preferences towards eco-friendly products. As businesses strive to align with these preferences, they are increasingly seeking reliable MRO services that can support their transition to biodegradable materials. This trend indicates a potential for collaboration between equipment manufacturers and service providers, fostering a more integrated approach to sustainability. Overall, the market is poised for growth, with opportunities for innovation and strategic partnerships that could redefine the landscape of biodegradable materials production.
The Biodegradable Materials Production Equipment MRO Services Market is witnessing a trend towards the adoption of advanced technologies. Innovations such as predictive maintenance and IoT integration are enhancing service efficiency. These technologies enable real-time monitoring of equipment, allowing for timely interventions and minimizing operational disruptions.
A growing emphasis on sustainability is reshaping the Biodegradable Materials Production Equipment MRO Services Market. Companies are increasingly integrating eco-friendly practices into their operations, which includes sourcing sustainable materials and adopting green maintenance practices. This shift reflects a broader commitment to environmental stewardship.
The market is seeing a rise in collaborative partnerships between equipment manufacturers and MRO service providers. Such alliances are aimed at improving service delivery and ensuring that maintenance practices align with the latest advancements in biodegradable materials technology. This trend suggests a move towards a more cohesive approach to equipment management.
The increasing consumer preference for environmentally friendly products drives the Biodegradable Materials Production Equipment MRO Services Market. As awareness of plastic pollution grows, businesses are shifting towards biodegradable alternatives. This trend is reflected in market data, which indicates a projected growth rate of over 15 percent annually for biodegradable materials. Consequently, manufacturers are investing in advanced production equipment, necessitating MRO services to maintain operational efficiency. The demand for biodegradable products is not merely a trend; it represents a fundamental shift in consumer behavior, compelling companies to adapt their production processes. This shift creates a robust market for MRO services, as equipment must be regularly maintained and upgraded to meet the evolving standards of biodegradable material production.
Consumer awareness regarding the environmental impact of materials is a significant driver of the Biodegradable Materials Production Equipment MRO Services Market. Educational initiatives aimed at informing the public about the benefits of biodegradable products are gaining traction. As consumers become more knowledgeable, their purchasing decisions increasingly favor biodegradable options, prompting manufacturers to enhance their production capabilities. Market data indicates that regions with active consumer education campaigns see a marked increase in the demand for biodegradable materials. This heightened demand necessitates the use of specialized production equipment, which in turn requires ongoing MRO services to maintain efficiency and compliance. The synergy between consumer awareness and production capabilities creates a dynamic environment for MRO service providers.
Government regulations promoting the use of biodegradable materials significantly influence the Biodegradable Materials Production Equipment MRO Services Market. Many countries have implemented policies aimed at reducing plastic waste, which encourages manufacturers to adopt biodegradable alternatives. For instance, regulations mandating the reduction of single-use plastics have led to an increased focus on biodegradable production methods. This regulatory environment not only stimulates demand for biodegradable materials but also necessitates the use of specialized production equipment. As a result, MRO services become essential for ensuring that this equipment operates efficiently and complies with regulatory standards. The interplay between regulation and market demand creates a fertile ground for MRO service providers to thrive.
The trend towards sustainable manufacturing practices is a key driver of the Biodegradable Materials Production Equipment MRO Services Market. Companies are increasingly recognizing the long-term benefits of investing in sustainable production methods, which include cost savings and enhanced brand reputation. This shift is supported by market data indicating that businesses adopting sustainable practices can achieve up to 20 percent lower operational costs over time. As manufacturers transition to biodegradable materials, they require reliable MRO services to ensure their production equipment remains in optimal condition. This growing investment in sustainability not only drives demand for biodegradable materials but also creates a robust market for MRO services that support these initiatives.
Technological advancements in production equipment are reshaping the Biodegradable Materials Production Equipment MRO Services Market. Innovations such as automation, improved material processing techniques, and enhanced energy efficiency are becoming increasingly prevalent. These advancements not only boost production capacity but also reduce operational costs, making biodegradable materials more competitive against traditional plastics. Market data suggests that companies investing in state-of-the-art production technologies experience a significant reduction in downtime, which underscores the importance of effective MRO services. As production equipment becomes more sophisticated, the need for specialized maintenance and repair services grows, creating opportunities for MRO providers to offer tailored solutions that enhance equipment longevity and performance.
The Biodegradable Materials Production Equipment MRO Services Market is effectively segmented by application, with Packaging leading the market share. Packaging serves as the dominant segment, driven by increasing consumer demand for sustainable practices and eco-friendly materials. The shift towards biodegradable packaging solutions has strengthened this segment, urging manufacturers to adopt innovative equipment for production. On the other hand, Agriculture is identified as the fastest-growing segment within the market. As the agricultural sector increasingly embraces sustainable practices, the demand for biodegradable materials for mulch films, planting trays, and compostable items is surging. This growth is bolstered by rising awareness of environmental impact and the necessity for sustainable solutions in agricultural practices.
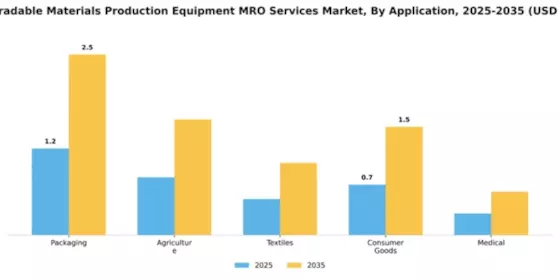
Packaging (Dominant) vs. Agriculture (Emerging)
The Packaging segment dominates the Biodegradable Materials Production Equipment MRO Services Market due to its significant role in addressing the environmental concerns associated with traditional packaging. As consumers and businesses prioritize eco-friendly solutions, manufacturers are investing in advanced biodegradable materials to meet this rising demand. This segment is characterized by innovative production technologies that enhance the functionality and durability of biodegradable packaging options. In contrast, the Agriculture segment is emerging strongly, driven by the need for sustainable solutions in farming practices. It focuses on the development of biodegradable films and other materials that contribute to soil health while reducing plastic pollution. This shift reflects the sector's commitment to sustainability, leading to increased investment in biodegradable production technologies.
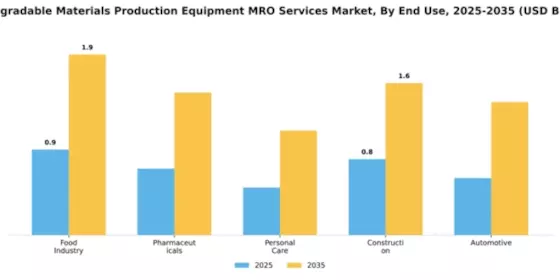
In the Biodegradable Materials Production Equipment MRO Services Market, the Food Industry stands out as the largest segment, accounting for a significant portion of the market share. This sector's substantial contribution is common due to the growing consumer demand for sustainable packaging solutions and practices. Pharmaceuticals follow closely, spotlighted as the fastest-growing segment, fueled by increasing awareness of eco-friendly materials in medical applications and the industry's shift toward reducing environmental impacts.
Food Industry: Dominant vs. Pharmaceuticals: Emerging
The Food Industry is positioned as a dominant player in the Biodegradable Materials Production Equipment MRO Services Market, primarily driven by the rising emphasis on sustainable food packaging and waste reduction strategies. Major food manufacturers are increasingly investing in biodegradable materials to meet consumer preferences for eco-friendly products. In contrast, the Pharmaceuticals sector is an emerging market segment, experiencing rapid growth as companies innovate in biodegradable materials for medical uses. This interest is driven by a heightened regulatory focus on sustainability and public demand for environmentally-responsible practices in pharmaceutical manufacturing.
The biodegradable materials production equipment MRO services market is witnessing a significant shift in material type preferences. Starch-based materials have established themselves as the largest segment due to their widespread adoption in various applications like food packaging and disposable tableware. Meanwhile, polylactic acid (PLA) emerges as one of the fastest-growing segments, gaining traction because of its versatility and adaptability in different sectors, including textiles and consumer goods. As manufacturers focus on sustainable alternatives, both segments are expected to play pivotal roles in the market landscape.
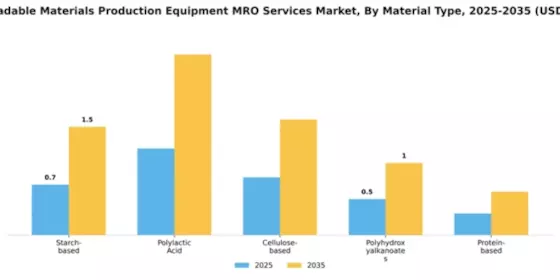
Starch-based (Dominant) vs. Polylactic Acid (Emerging)
Starch-based materials hold a dominant position in the biodegradable materials production equipment MRO services market. Their inherent properties, such as biodegradability and renewability, make them appealing to manufacturers aiming to reduce environmental impact. Furthermore, the starch-based segment is widely accepted due to its low cost and ease of processing. In comparison, polylactic acid (PLA) is an emerging player characterized by its diverse applications and excellent mechanical properties. PLA's growth is fueled by increasing demand for eco-friendly materials across various industries, including healthcare, packaging, and electronics. As sustainability becomes a priority, the adoption of both starch-based and PLA materials is poised to rise.
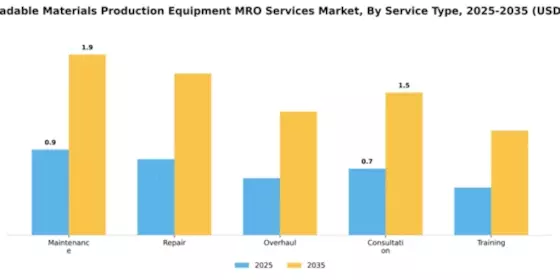
The service type segment in the Biodegradable Materials Production Equipment MRO Services Market showcases a diverse array of offerings, each catering to the unique needs of the biodegradable materials industry. Currently, maintenance services account for the largest share, as companies prioritize keeping their equipment operational and efficient. Repair and overhaul services also play pivotal roles, ensuring that production equipment remains up-to-date and functional. Consultation services provide essential expertise, while training programs are increasingly gaining traction among organizations aiming to upskill their workforce for enhanced productivity.
Maintenance (Dominant) vs. Training (Emerging)
Maintenance services stand as the dominant force within the Biodegradable Materials Production Equipment MRO Services Market, reflecting the industry’s stringent need for reliability and performance. Companies recognize the value of proactive maintenance to prolong equipment life and prevent costly breakdowns. Conversely, training services are emerging as a critical segment, driven by the need for skilled personnel who can adapt to evolving technologies in biodegradable production. This growth is propelled by increased investments in workforce development, as organizations aim to enhance efficiency and ensure adherence to sustainability standards. The dual focus on maintaining existing equipment and cultivating a knowledgeable workforce positions these service types as integral to the sector’s overall success.
In the Biodegradable Materials Production Equipment MRO Services Market, Injection Molding stands out as the largest segment, securing the bulk of market share due to its widespread application in creating durable and versatile biodegradable products. Following closely, Biocomposites and Thermoplastics represent significant portions of the market, with Additive Manufacturing starting to make its mark and gaining traction among innovative manufacturers looking for sustainable practices. Blow Molding, while valuable, is not as dominant as the leading technologies. The growth trends within this segment are primarily fueled by the increasing demand for eco-friendly packaging solutions and sustainable materials, leading manufacturers to adopt advanced technologies. Injection Molding remains essential for high-volume production, while Additive Manufacturing is emerging quickly due to its ability to create complex designs with less waste. Biocomposites are also becoming prevalent as they offer enhanced properties and lower environmental impact, driving industry innovation and adaptation.
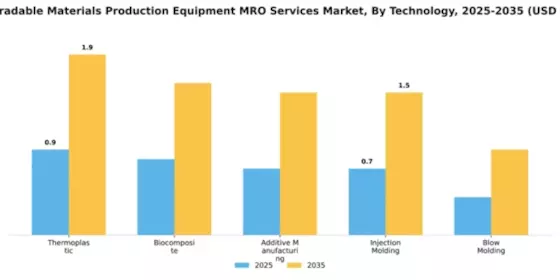
Technology: Injection Molding (Dominant) vs. Additive Manufacturing (Emerging)
Injection Molding is currently the dominant technology in the biodegradable materials production equipment, known for its efficiency and reliability in mass-producing complex shapes. This technique utilizes biodegradable polymers to deliver sustainable products without compromising quality. Conversely, Additive Manufacturing is an emerging technology recognized for its innovative approach to production, enabling customizations and reductions in material waste. As manufacturers increasingly focus on sustainability, Additive Manufacturing is poised to capture a larger market share, appealing to businesses looking for flexibility and minimal environmental impact. Both technologies are complementary, with Injection Molding providing large-scale solutions, while Additive Manufacturing paves the way for future innovations.
Get more detailed insights about Biodegradable Materials Production Equipment MRO Services Market Request Free Sample
North America is poised to maintain its leadership in the Biodegradable Materials Production Equipment MRO Services Market, holding a market size of $1.75B in 2025. The region's growth is driven by increasing consumer demand for sustainable products, stringent environmental regulations, and significant investments in R&D. The push for eco-friendly alternatives is further supported by government initiatives aimed at reducing plastic waste, enhancing the market's appeal. The U.S. stands out as a key player, with major companies like NatureWorks LLC and Green Dot Bioplastics leading the charge. Canada and Mexico are also contributing to the market's expansion, with their own initiatives promoting biodegradable solutions. The competitive landscape is characterized by innovation and collaboration among industry leaders, ensuring a robust supply chain and diverse product offerings.
Europe is rapidly emerging as a significant player in the Biodegradable Materials Production Equipment MRO Services Market, with a market size of $1.2B projected for 2025. The region's growth is fueled by stringent EU regulations aimed at reducing plastic waste and promoting sustainable practices. Initiatives like the European Green Deal are pivotal in driving demand for biodegradable materials, aligning with consumer preferences for eco-friendly products. Leading countries such as Germany, France, and Italy are at the forefront of this transition, with companies like BASF SE and Novamont S.p.A. actively participating in the market. The competitive landscape is marked by innovation and strategic partnerships, enhancing the region's capabilities in biodegradable solutions. The presence of regulatory bodies ensures compliance and fosters a favorable environment for market growth.
Asia-Pacific is witnessing a burgeoning interest in the Biodegradable Materials Production Equipment MRO Services Market, with a market size of $0.9B anticipated by 2025. The region's growth is driven by increasing environmental awareness, government initiatives promoting sustainability, and rising consumer demand for biodegradable products. Countries like Japan and Australia are leading the charge, supported by favorable regulations that encourage the adoption of eco-friendly materials. China and India are also emerging as key players, with significant investments in biodegradable technologies. The competitive landscape is evolving, with local manufacturers and international companies collaborating to enhance product offerings. This dynamic environment is expected to accelerate the region's growth in the biodegradable sector, positioning it as a vital player in the global market.
The Middle East and Africa region is gradually recognizing the potential of the Biodegradable Materials Production Equipment MRO Services Market, with a market size of $0.55B projected for 2025. The growth is driven by increasing awareness of environmental issues and the need for sustainable solutions in waste management. Governments are beginning to implement regulations that promote biodegradable alternatives, creating a conducive environment for market expansion. Countries like South Africa and the UAE are taking the lead in adopting biodegradable materials, supported by initiatives aimed at reducing plastic waste. The competitive landscape is still developing, with both local and international players exploring opportunities in this emerging market. As awareness grows, the region is expected to attract more investments and innovations in biodegradable technologies.
The Biodegradable Materials Production Equipment MRO Services Market is currently characterized by a dynamic competitive landscape, driven by increasing environmental regulations and consumer demand for sustainable products. Key players such as BASF SE (Germany), Novamont S.p.A. (Italy), and NatureWorks LLC (US) are strategically positioning themselves through innovation and partnerships. For instance, BASF SE (Germany) focuses on developing advanced biodegradable materials, while Novamont S.p.A. (Italy) emphasizes its commitment to circular economy principles, enhancing its operational focus on sustainable solutions. These strategies collectively shape a competitive environment that is increasingly oriented towards sustainability and technological advancement.In terms of business tactics, companies are localizing manufacturing to reduce carbon footprints and optimize supply chains for efficiency. The market appears moderately fragmented, with several key players exerting influence through strategic collaborations and technological innovations. This structure allows for a diverse range of offerings, catering to various segments within the biodegradable materials sector.In November NatureWorks LLC (US) announced a partnership with a leading agricultural firm to develop bio-based feedstocks for its production processes. This strategic move is likely to enhance NatureWorks' supply chain resilience and reduce dependency on fossil fuels, aligning with the growing trend towards sustainable sourcing. Such initiatives not only bolster their market position but also contribute to the overall sustainability goals of the industry.In October Total Corbion PLA (Netherlands) unveiled a new production facility aimed at increasing its output of polylactic acid (PLA) bioplastics. This expansion is significant as it reflects the company's commitment to meeting rising global demand for biodegradable materials. The facility is expected to enhance operational efficiency and reduce production costs, thereby strengthening Total Corbion's competitive edge in the market.In September Braskem S.A. (Brazil) launched a new line of biodegradable resins designed for packaging applications. This initiative is indicative of Braskem's strategy to diversify its product offerings and cater to the growing demand for sustainable packaging solutions. By focusing on innovation, Braskem is likely to capture a larger market share and respond effectively to consumer preferences for eco-friendly products.As of December current trends in the Biodegradable Materials Production Equipment MRO Services Market indicate a strong emphasis on digitalization, sustainability, and AI integration. Strategic alliances are increasingly shaping the competitive landscape, allowing companies to leverage shared resources and expertise. The shift from price-based competition to a focus on innovation and technology is evident, as firms prioritize supply chain reliability and sustainable practices. Looking ahead, competitive differentiation will likely evolve, with companies that invest in cutting-edge technologies and sustainable solutions poised to lead the market.


The Biodegradable Materials Production Equipment MRO Services Market is projected to grow at a 7.17% CAGR from 2025 to 2035, driven by sustainability initiatives and technological advancements.
New opportunities lie in:
By 2035, the market is poised for robust growth, reflecting increased demand for sustainable production solutions.
| MARKET SIZE 2024 | 3.5(USD Billion) |
| MARKET SIZE 2025 | 3.75(USD Billion) |
| MARKET SIZE 2035 | 7.5(USD Billion) |
| COMPOUND ANNUAL GROWTH RATE (CAGR) | 7.17% (2025 - 2035) |
| REPORT COVERAGE | Revenue Forecast, Competitive Landscape, Growth Factors, and Trends |
| BASE YEAR | 2024 |
| Market Forecast Period | 2025 - 2035 |
| Historical Data | 2019 - 2024 |
| Market Forecast Units | USD Billion |
| Key Companies Profiled | BASF SE (DE), Novamont S.p.A. (IT), NatureWorks LLC (US), Total Corbion PLA (NL), Braskem S.A. (BR), Mitsubishi Chemical Corporation (JP), Futerro (BE), Green Dot Bioplastics (US), Bio-on S.p.A. (IT) |
| Segments Covered | Application, End Use, Material Type, Service Type, Technology |
| Key Market Opportunities | Growing demand for sustainable production methods drives innovation in Biodegradable Materials Production Equipment MRO Services Market. |
| Key Market Dynamics | Rising demand for sustainable practices drives innovation and competition in biodegradable materials production equipment maintenance, repair, and operations services. |
| Countries Covered | North America, Europe, APAC, South America, MEA |
The market is projected to reach a valuation of 7.5 USD Billion by 2035.
Key players include BASF SE, Novamont S.p.A., NatureWorks LLC, Total Corbion PLA, and Braskem S.A.
The market valuation was 3.5 USD Billion in 2024.
The expected CAGR for the market is 7.17% during the forecast period 2025 - 2035.
The packaging segment is projected to grow from 1.2 USD Billion to 2.5 USD Billion, indicating strong demand.
The agriculture sector is expected to grow from 0.8 USD Billion to 1.6 USD Billion by 2035.
Polylactic Acid is expected to dominate, growing from 1.2 USD Billion to 2.5 USD Billion by 2035.
The maintenance service type is projected to grow from 0.9 USD Billion to 1.9 USD Billion by 2035.
The automotive sector is expected to grow from 0.6 USD Billion to 1.4 USD Billion by 2035, reflecting increasing adoption.
Technologies such as thermoplastic and biocomposite are projected to grow significantly, with thermoplastic increasing from 0.9 USD Billion to 1.9 USD Billion by 2035.



Kindly complete the form below to receive a free sample of this Report

“This is really good guys. Excellent work on a tight deadline. I will continue to use you going forward and recommend you to others. Nice job”


“Thanks. It’s been a pleasure working with you, please use me as reference with any other Intel employees.”


“Thanks for sending the report it gives us a good global view of the Betaïne market.”


“Thank you, this will be very helpful for OQS.”


“We found the report very insightful! we found your research firm very helpful. I'm sending this email to secure our future business.”


“I am very pleased with how market segments have been defined in a relevant way for my purposes (such as "Portable Freezers & refrigerators" and "last-mile"). In general the report is well structured. Thanks very much for your efforts.”


“I have been reading the first document or the study, ,the Global HVAC and FP market report 2021 till 2026. Must say, good info! I have not gone in depth at all parts, but got a good indication of the data inside!”


“We got the report in time, we really thank you for your support in this process. I also thank to all of your team as they did a great job.”


“The Automotive 48V ECU Components Procurement Intelligence Study” was a complex project, but the Market Research Future (MRFR) team handled it with quality, agility, and customer-centricity. They delivered all requested data on time and within the agreed scope. The team, including Shubhendra Anand and Rahul Gotadki, was always readily available to clarify questions and swiftly implement necessary adjustments, driving the project to a successful conclusion within a very demanding timeframe.
I would also like to specifically commend Akshay Agarwal for his responsiveness and support at every stage—from our initial inquiry on May 6th through to final delivery on June 18th. His dedication made the entire process seamless.”



