Biological Seed Treatment Market (2026 - 2035)

Biological Seed Treatment Market Size, Share, Industry Trend & Analysis Research Report Information By Type (Microbial, Botanicals, Others), By Function (Seed Protection, Seed Enhancement, Other Functions), By Crop Type (Grains and Cereals, Oil Seeds, Vegetables, Other Crop Types), By Geography (North America, Europe, Asia-Pacific, South America, Middle East & Africa) – Forecast Till 2035

Forecast Period
2026-2035
CAGR
12.0%
2025 Market Size
USD 1.74 Billion
2035 Market Size
USD 5.41 Billion
Agriculture ● Updated July 2026 Report ID: MRFR/Agri/5839-HCR | Pages: 90 | Author: Snehal Singh, Pradeep Nandi

Biological Seed Treatment Market Summary

The Biological Seed Treatment Market reached a valuation of USD 1.74 billion in 2025, positioning it as one of the highest-growth corridors in crop protection. From a 2026 starting point of USD 1.95 billion, the market is projected to climb to USD 5.41 billion by 2035 at a 12.0% CAGR — an expansion trajectory driven by tightening pesticide residue limits across the EU and accelerating biotech investment pipelines in China and India [1]. The European Commission's Sustainable Use of Pesticides Directive, which mandates quantifiable reductions in chemical crop inputs, has redirected over EUR 1.7 billion toward biological alternatives, giving the Biological Seed Treatment Market a durable policy tailwind [2].

A generational shift is emerging in how producers maintain seed germination and root growth in their early stages. Legacy chemical dressings — thiram-based fungicides, neonicotinoid coatings — are seeing increasing numbers of registration cancellations. Instead, microbial inoculants and botanical extracts have demonstrated disease-control efficiency rates above 50% in replicated field trials and also improved soil biodiversity indicators [3]. An example of the type of capital commitment that is transforming the Biological Seed Treatment Market supply chain is Corteva Agriscience’s opening of a specialized Center for Seed Applied Technologies laboratory in South Africa in 2022 [4].

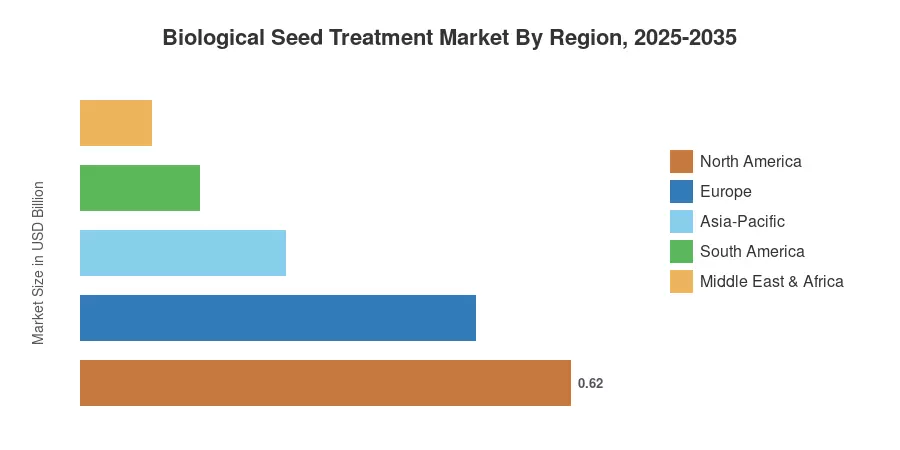
North America, which represents 35.8% of sales, is due to large-row-crop acreage in the US corn heartland and regulatory certainty from the EPA’s biopesticide registration system. The Asia-Pacific area is the fastest expanding region with a predicted CAGR of 14.8% driven by India’s biofertilizer subsidies and China’s green agricultural regulations [5]. Europe is the second greatest share (28.5%) due to the Farm to Fork Strategy’s 50% reduction objective for pesticides by 2030. Biological seed treatment data is integrated into the prescriptive planting algorithms of precision agriculture platforms, and the Biological Seed Treatment Market will continue its double-digit growth through 2035.


Key Report Takeaways

• By Type

  • Microbial formulations held a 65.5% share of the Biological Seed Treatment Market in 2024, reflecting grower confidence in strain-specific efficacy data and regulatory fast-tracking for microbial registrations.
  • Botanicals are projected to expand at a 15.2% CAGR through 2035, propelled by consumer-facing "residue-free" labeling trends in fresh produce.

• By Function

  • Seed protection accounted for 46.0% of the Biological Seed Treatment Market in 2024, driven by fungal and bacterial pathogen pressure in humid growing regions.
  • Seed enhancement is the fastest-growing functional segment at a 13.8% CAGR, as plant growth-promoting formulations gain traction in nutrient-depleted soils.

• By Crop Type

  • Grains and cereals represented a 42.5% share of the Biological Seed Treatment Market in 2024, reflecting the sheer acreage volume of wheat, corn, and rice globally.
  • Vegetables are forecast to grow at a 12.3% CAGR, supported by controlled-environment agriculture mandates that restrict synthetic chemistry.

• By Region

  • North America led the Biological Seed Treatment Market with 35.8% revenue share in 2024.
  • Asia-Pacific is projected to register the fastest regional CAGR of 14.8% through 2035, driven by government subsidy programs in India and China.


Market Size and Forecast (2021–2035)

Market Research Future's sizing methodology triangulates bottom-up revenue models — aggregating manufacturer shipment data across 35+ countries — with top-down demand modeling calibrated against planted acreage, treatment rates, and average selling prices. Historical figures draw on customs trade databases, company filings, and proprietary distributor surveys. Forecast projections apply a scenario-weighted CAGR that accounts for regulatory, climatic, and competitive variables across the 2026–2035 window.
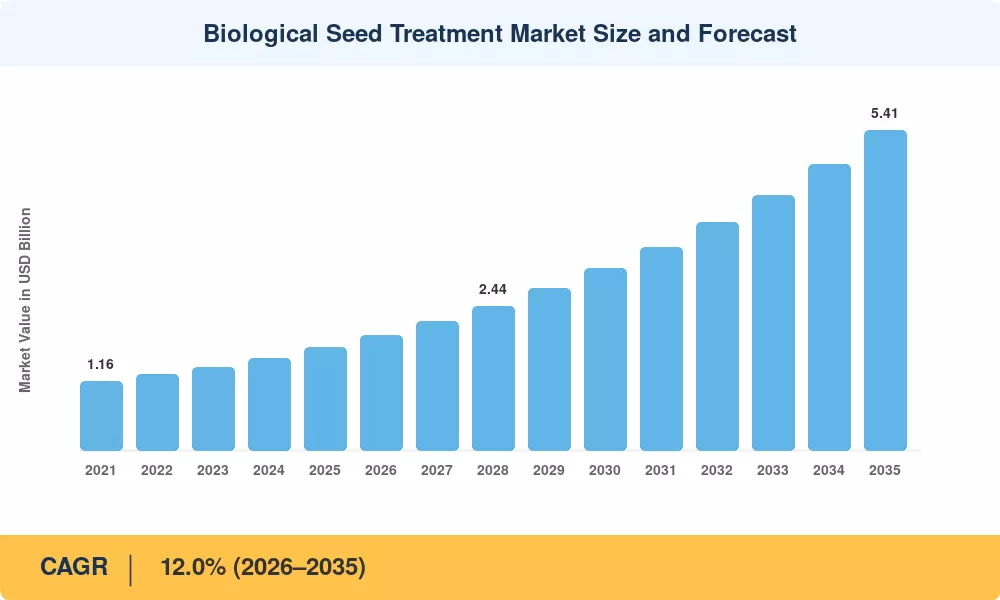
Biological Seed Treatment Market Size and Forecast
Our Impact
Enabled $4.3B Revenue Impact for Fortune 500 and Leading Multinationals
Partnering with 2000+ Global Organizations Each Year
30K+ Citations by Top-Tier Firms in the Industry

Driver Impact Analysis

Driver ~% Impact on CAGR Geographic Relevance Impact Timeline
Regulatory restriction of chemical seed dressings +2.8% Europe, North America Short-term (≤2 yr)
Government biofertilizer subsidy programs +2.3% Asia-Pacific, South America Medium-term (2–4 yr)
Proven yield uplift from biological treatments +1.9% Global Long-term (≥4 yr)
Precision agriculture data integration +1.5% North America, Europe Medium-term (2–4 yr)
Consumer demand for residue-free produce +1.2% Europe, Asia-Pacific Short-term (≤2 yr)
Soil health restoration mandates +1.0% North America, Europe Long-term (≥4 yr)
Climate-adaptive crop management adoption +0.8% Global Long-term (≥4 yr)


Regulatory Restriction of Chemical Seed Dressings

The European Commission's phased withdrawal of neonicotinoid-based seed treatments — which covered clothianidin, imidacloprid, and thiamethoxam by 2018 with expanded scope through 2024 — has created a structural demand vacuum that biological alternatives are filling [1]. The EU's Sustainable Use of Pesticides Regulation targets a 50% reduction in chemical pesticide use by 2030, translating into an addressable replacement opportunity worth over USD 800 million in seed treatment alone across the bloc [2]. North America mirrors this pattern; Health Canada's re-evaluation of thiram registrations and the EPA's Biopesticide and Pollution Prevention Division have fast-tracked 47 new microbial active-ingredient registrations since 2021, compressing time-to-market from 3+ years to under 18 months for qualifying biological formulations [10].

Government Biofertilizer Subsidy Programs

India’s National Mission on Edible Oils-Oil Palm (NMEO-OP) 2021–2026 allocates significant resources to enhance domestic oilseed productivity, including support for quality seed distribution and adoption of modern inputs. Similarly, China’s 14th Five-Year Plan prioritizes "Green Agricultural Development," mandating a transition toward low-carbon inputs. Brazil’s Plano Safra continues to incentivize biological adoption through specialized credit lines.


Proven Yield Uplift from Biological Treatments

Field trials, such as those conducted at the Vasantrao Naik Marathwada Krishi Vidyapeeth, demonstrate that integrating microbial inoculants—such as Azospirillum and Bacillus consortia—with recommended fertilizer doses significantly enhances growth attributes. Research consistently reports potential yield improvements exceeding 8% in maize crops, while simultaneous improvements in soil enzymatic properties and nutrient uptake are observed.


Precision Agriculture Data Integration

Variable Rate Technology (VRT) is shifting agricultural input models by optimizing application based on real-time spatial data. Research indicates that VRT-driven nitrogen application can reduce total chemical usage by 4% to 7% while maintaining yields. These systems utilize satellite-derived indices to target precise zones, significantly improving overall input-use efficiency across modern, mechanized farming operations.


Restraints Impact Analysis

The restraint impacts below represent directional headwinds that moderate the Biological Seed Treatment Market growth rate. They are not directly subtracted from the headline CAGR.

Restraint ~% Impact on CAGR Geographic Relevance Impact Timeline
Shelf-life and cold-chain limitations –1.4% Global Medium-term (2–4 yr)
Inconsistent field efficacy across soil types –1.1% Global Long-term (≥4 yr)
Higher per-unit cost vs. chemical alternatives –0.9% South America, MEA Short-term (≤2 yr)
Limited grower awareness in emerging markets –0.7% Africa, Southeast Asia Medium-term (2–4 yr)
Regulatory harmonization gaps across jurisdictions –0.5% Global Long-term (≥4 yr)


Shelf-Life and Cold-Chain Limitations

Microbial seed treatment products typically require storage at 4–25°C and carry shelf lives of 6–12 months — compared to 2–3 years for chemical counterparts [16]. In tropical markets across Sub-Saharan Africa and Southeast Asia, where cold-chain infrastructure reaches fewer than 40% of last-mile agricultural retailers, product spoilage erodes distributor margins and undermines grower confidence. Fermentation-based production also concentrates manufacturing in temperate-climate facilities, adding freight costs that raise delivered prices by 10–15% in equatorial regions [17].

Inconsistent Field Efficacy Across Soil Types

Biological seed treatment performance is inherently soil-microbiome dependent. A 2023 multi-site trial across six US states showed that the same Bacillus-based seed treatment delivered a 19% yield lift in loam soils but only 4% in heavy clay, a variance that chemical seed dressings do not exhibit [13]. Until manufacturers develop robust strain-matching recommendation engines — an area where AI and soil genomics are beginning to converge — this variability will slow adoption among risk-averse growers managing thousands of hectares with diverse soil profiles [14].

Higher Per-Unit Cost Versus Chemical Alternatives

Biological seed treatments often involve complex fermentation and stabilization processes, leading to higher initial unit costs compared to traditional chemical dressings. While systemic benefits—such as improved soil health and reduced residue risks—enhance long-term value, the upfront price premium remains a significant adoption barrier for growers in capital-constrained markets like East Africa and parts of Latin America.


Biological Seed Treatment Market Opportunities

Multi-Strain Stacking and Consortium Products

Advances in microbial ecology are enabling manufacturers to formulate consortia of 3–5 complementary bacterial and fungal strains into a single seed treatment, delivering simultaneous biocontrol, biofertilization, and stress-tolerance benefits. Products combining Trichoderma, Bacillus, and arbuscular mycorrhizal strains have shown 28–35% higher efficacy than single-strain formulations in soybean and wheat trials [3]. This product architecture shift will drive premiumization and per-acre value growth across the Biological Seed Treatment Market through 2035.

Controlled-Environment Agriculture Mandates

The global greenhouse and vertical farming sector — projected to exceed USD 85 billion by 2032 — operates under strict residue-limit regimes that effectively mandate biological crop inputs. As CEA acreage expands across the Netherlands, Japan, and the UAE, the Biological Seed Treatment Market gains a captive high-value end market where growers pay 2–3× commodity treatment rates for certified residue-free formulations.

Emerging Market Expansion via Subsidy Mechanisms

India, Brazil, and Nigeria collectively account for over 180 million smallholder farming households, the vast majority of which have never used commercially formulated seed treatments [18]. Government subsidy programs — India's Paramparagat Krishi Vikas Yojana, Brazil's ABC+ Plan, Nigeria's Presidential Fertilizer Initiative — are lowering adoption barriers and creating first-time biological treatment demand worth an estimated USD 400–600 million by 2030.

Data-as-a-Service and Outcome-Based Pricing

Precision agriculture platforms generate granular field-performance data that biological seed treatment companies can monetize through outcome-based pricing models — charging per unit of verified yield uplift rather than per unit of product sold [6]. Early movers like Indigo Agriculture have demonstrated 15–20% higher grower retention rates under performance-guarantee contracts, a model that the Biological Seed Treatment Market is positioned to scale.

Carbon Credit Monetization from Soil Health Improvements

Biological seed treatments that support mycorrhizal colonization and improve root-zone microbial activity contribute to enhanced soil organic carbon sequestration. As voluntary carbon markets mature under established protocols like Verra and Gold Standard, growers may increasingly view biological inputs as a tool for generating carbon credits, adding a secondary revenue stream to traditional yield-focused economic calculations.


Biological Seed Treatment Market Future Outlook

AI-Driven Strain Selection and Prescriptive Treatment

Machine-learning platforms trained on soil metagenomic datasets will enable treatment prescriptions tailored to field-specific microbial communities by 2028–2030. Companies investing in this capability — matching specific biological strains to soil-microbiome profiles — stand to capture a premiumization wave in the Biological Seed Treatment Market, with AI-recommended treatments commanding higher price premiums over generic formulations [6].

Nano-Encapsulation and Controlled-Release Formulations

Next-generation nano-encapsulation technologies extend microbial viability from 6–12 months to 18–24 months while improving shelf stability at ambient temperatures [16]. This advancement directly addresses the cold-chain constraint that currently limits market penetration in tropical regions, potentially unlocking USD 500–700 million in addressable demand across Sub-Saharan Africa and Southeast Asia by 2032.

Biologicals-as-a-Service and Platform Economics

The convergence of digital agriculture platforms, satellite monitoring, and outcome-based pricing models will reshape the Biological Seed Treatment Market from a product-centric model to a service-based ecosystem by 2030–2033. Platform operators offering integrated seed treatment, monitoring, and yield-guarantee packages are projected to capture 15–20% of total market value, compressing traditional distribution margins while improving grower adoption rates [15].

ESG Reporting and Sustainable Finance Integration

As sustainability frameworks—including the EU’s Corporate Sustainability Reporting Directive (CSRD) and the International Sustainability Standards Board (ISSB) standards—gain global adoption, agricultural companies face heightened mandates to quantify supply chain impacts. By reducing reliance on synthetic fertilizers and pesticides, biological seed treatments facilitate measurable Scope 3 emissions reductions, positioning these technologies as essential tools for regulatory compliance and long-term climate transition planning.


Biological Seed Treatment Market Segmentation

By Type

Segment Key Metric Primary Demand Driver
Microbial 65.5% share (2024) Strain-specific registrations; proven field efficacy
Botanicals 15.2% CAGR (2026–2035) Residue-free labeling; consumer-facing sustainability claims
Others USD 0.12 Billion (2025) Biochemical and mineral-based formulation niche


The Biological Seed Treatment Market remains heavily concentrated in microbial products, where Bacillus, Trichoderma, and Pseudomonas strains dominate commercial formulations. Growers trust microbial treatments because decade-long university trial databases provide crop-specific, region-specific performance benchmarks that reduce adoption risk. Regulatory fast-tracking for microbial active ingredients — the EPA processes microbial registrations in 12–18 months versus 3+ years for conventional chemistry — reinforces this dominance [10].

Botanicals represent the most dynamic growth segment, driven by high-value horticulture and export-oriented produce where zero-residue certification commands premium pricing. Neem-based, thyme-oil, and citrus-extract seed coatings are gaining traction in Mediterranean vegetable production and Asian tea cultivation, where consumer markets pay 15–25% premiums for residue-free product.

By Function

Segment Key Metric Primary Demand Driver
Seed Protection 46.0% share (2024) Fungal and bacterial pathogen suppression at germination
Seed Enhancement 13.8% CAGR (2026–2035) Nutrient-use efficiency; root growth stimulation
Other Functions USD 0.09 Billion (2025) Stress tolerance; frost protection; niche applications


Seed protection remains the core entry point for the Biological Seed Treatment Market, directly replacing chemical fungicidal seed dressings that face registration cancellations. Formulations targeting Fusarium, Rhizoctonia, and Pythium — the three most economically damaging seedling pathogens globally — account for the bulk of protection-segment revenues [3].

Seed enhancement is gaining momentum as a differentiated value proposition. Rather than simply defending against pathogens, enhancement formulations improve nutrient uptake, root architecture, and abiotic stress tolerance. This segment appeals to growers seeking yield uplift beyond disease avoidance, particularly in degraded soils where phosphorus solubilization and nitrogen fixation from biological agents can substitute for 20–30% of synthetic fertilizer inputs [13].

By Crop Type

Segment Key Metric Primary Demand Driver
Grains and Cereals 42.5% share (2024) Massive global acreage; staple crop investment priority
Oil Seeds USD 0.29 Billion (2025) Soybean inoculant tradition; canola and sunflower expansion
Vegetables 12.3% CAGR (2026–2035) CEA mandates: export residue compliance and premium pricing
Other Crop Types 8.4% share (2024) Pulses, cotton, sugarcane, specialty crops


Grains and cereals lead the Biological Seed Treatment Market by volume, with wheat, maize, and rice collectively representing billions of hectares of addressable treatment area annually. The economic logic is straightforward — even modest per-hectare yield gains of 5–8% on commodity grains translate into significant aggregate value given the scale of planted acreage [14].

Vegetables are the fastest-expanding crop-type segment, driven by the intersection of tightening residue limits in the EU and Japan, expanding controlled-environment production, and consumer willingness to pay premium prices for produce labeled as biologically treated. Greenhouse tomato, pepper, and cucumber operations in the Netherlands and Spain are shifting entirely to biological seed treatment protocols.


Regional Market Share Analysis

Region Key Metric Primary Investment Themes
North America 35.8% revenue share (2024) EPA biopesticide fast-tracking; precision ag integration
Europe 28.5% revenue share (2024) Farm to Fork pesticide reduction; organic acreage expansion
Asia-Pacific 14.8% CAGR (2026–2035) Government biofertilizer subsidies; rice and pulse treatment
South America USD 0.15 Billion (2025) Soybean biological treatment stacking; Cerrado expansion
Middle East & Africa 5.0% revenue share (2024) Arid-zone stress-tolerance biologicals; subsidy pilot programs
Total USD 1.74 Billion (2025)

The Biological Seed Treatment Market exhibits distinct regional adoption patterns shaped by regulatory frameworks, agronomic traditions, and subsidy structures. North America and Europe anchor current demand, while Asia-Pacific and South America represent the highest growth runways.


North America

Country Key Metric Key Driver
US 78.2% of regional share Corn belt biologicals adoption; EPA registration pipeline
Canada 13.5% CAGR (2026–2035) Canola seed treatment mandates; PMRA biological alignment
Mexico USD 0.03 Billion (2025) Tropical pathogen pressure; SAGARPA subsidy integration


The US dominates the North American Biological Seed Treatment Market, with large-acreage corn and soybean growers increasingly integrating biological seed treatment into their standard agronomic programs. The EPA's Biopesticide and Pollution Prevention Division has accelerated registration timelines, while university extension networks across Iowa, Illinois, and Indiana provide independent performance validation that reduces grower adoption risk [10].

Europe

Country Key Metric Key Driver
Germany 22.4% of regional share Precision farming leadership; organic policy incentives
France 13.1% CAGR (2026–2035) Ecophyto II plan enforcement; cereal biologicals adoption
UK USD 0.05 Billion (2025) Post-Brexit biopesticide regulatory independence
Italy 11.8% CAGR (2026–2035) Mediterranean horticulture: vine and olive biologicals
Spain 9.7% of regional share Protected cultivation mandates in the Almería greenhouse cluster
Nordic Countries 10.5% CAGR (2026–2035) Cold-climate strain development; sustainability mandates
Russia USD 0.02 Billion (2025) Domestic biological production capacity buildout
Rest of Europe 14.6% of regional share Diversified adoption across Benelux, Poland and Austria


Europe's regulatory architecture has made the continent the most structurally committed region for biological seed treatment adoption. The Farm to Fork Strategy's binding 50% pesticide-reduction target by 2030, combined with France's Ecophyto II plan and Germany's national organic strategy, creates layered policy drivers that de-risk manufacturer investment in regional production capacity [2].

Asia-Pacific

Country Key Metric Key Driver
China 30.8% of regional share Green agriculture mandate; domestic fermentation capacity
India 16.2% CAGR (2026–2035) PKVY and MOVCDNER organic subsidies; pulse inoculation
Japan USD 0.04 Billion (2025) High-value horticulture; precision greenhouse treatment
South Korea 12.9% CAGR (2026–2035) Smart-farm integration; K-BIO strategy
ASEAN 15.0% CAGR (2026–2035) Rice seed treatment; tropical biocontrol demand
Rest of Asia-Pacific 8.5% of regional share Emerging adoption across Central Asia, Bangladesh


Asia-Pacific represents the fastest-expanding frontier for the Biological Seed Treatment Market. India alone has over 140 million farm holdings, and the Paramparagat Krishi Vikas Yojana program subsidizes biological inputs for certified organic clusters, creating a structured demand pipeline of 5–7 million hectares annually [5]. China's 14th Five-Year Plan positions biological crop protection as a strategic pillar, with provincial governments in Shandong and Henan establishing dedicated biological manufacturing zones [11].

South America

Country Key Metric Key Driver
Brazil 68.3% of regional share Soybean biological stacking; Plano Safra credit lines
Argentina 13.4% CAGR (2026–2035) Pampas inoculant tradition; export residue compliance
Rest of South America USD 0.02 Billion (2025) Early-stage adoption in Paraguay, Uruguay and Colombia


Brazil is the engine of South American demand, where a well-established tradition of Bradyrhizobium inoculant use in soybean — treating over 90% of planted area — has created grower familiarity that facilitates upselling into multi-function biological seed treatment stacks. The Plano Safra 2024/25 preferential credit program reduces biological input financing costs by 30–40% for qualifying producers [12].

Middle East & Africa

Country Key Metric Key Driver
Saudi Arabia 12.5% CAGR (2026–2035) Vision 2030 food security; protected agriculture expansion
UAE USD 0.01 Billion (2025) Vertical farming mandates; residue-free protocols
South Africa 38.5% of regional share Corteva CSAT laboratory; commercial farming biologicals
Egypt 11.2% CAGR (2026–2035) Nile Delta vegetable exports; EU residue compliance
Rest of MEA USD 0.02 Billion (2025) Pilot subsidy programs in Kenya, Morocco and Ethiopia


The Middle East & Africa region presents a dual-track Biological Seed Treatment Market opportunity. South Africa — home to Corteva's dedicated seed applied technologies facility — leads commercial adoption among large-scale maize and soybean producers [4]. Gulf states are investing in controlled-environment agriculture where biological treatments are a default input, while East African governments pilot biological subsidy programs through AGRA and World Bank partnerships [18].


Biological Seed Treatment Market By Region, 2025-2035

Competitive Benchmarking

The Biological Seed Treatment Market exhibits moderate concentration, with the top five companies holding an estimated 40–48% combined revenue share. The Herfindahl-Hirschman Index sits in the 800–1,200 range, characteristic of a market transitioning from fragmented specialty status to consolidated platform competition. Large agrochemical incumbents compete alongside specialized biological pure-plays, creating a two-tier dynamic where scale-driven distribution advantages coexist with innovation-led niche differentiation.

Company Est. Revenue Share Range Key Offerings Strategic Positioning
BASF SE ~9–12% Serifel, Velondis biological seed treatments Integrated chemical-biological portfolio; global distribution
Bayer CropScience ~8–11% Poncho/VOTiVO, Acceleron biological Seed-trait-plus-biological bundling strategy
Corteva Agriscience ~7–10% Lumisena, biocontrol pipeline Dedicated CSAT research facilities; regional production
Syngenta Group ~6–9% Clariva, Saltro biological Digital agriculture integration; China market access
UPL Limited ~5–8% Pronutiva biological platform Emerging market distribution strength; cost leadership
Novonesis (formerly Novozymes) ~4–7% BioAg microbial inoculants Fermentation technology leadership; strain library depth
Verdesian Life Sciences ~3–5% Commence, biological seed treatment portfolio US-focused biologicals pure-play; agronomic services
Koppert Biological Systems ~2–4% Trianum, mycorrhizal products Greenhouse and CEA specialization; European base
Bioceres Crop Solutions ~2–4% Rizobacter inoculant platform South American market leadership; soybean expertise
Advanced Biological Marketing ~1–3% Excalibre-SA, QuickRoots US specialty biologicals; university-validated strains


Recent News & Developments


  • BASF SE (April, 2026): BASF Agricultural Solutions officially completed its acquisition of AgBiTech, strengthening its global biological insect control portfolio and scaling specialized microbial technologies.
  • Suterra (May, 2026): Suterra acquired the research and development assets and product lines of Vestaron, significantly expanding its footprint in biological crop protection and innovation.
  • HGS BioScience (January, 2026): HGS BioScience further expanded its biological platform and manufacturing capabilities through the strategic acquisition of the company Pharmgrade.


Biological Seed Treatment Market Report Scope

Parameter Detail
Market Scope Biological Seed Treatment Market — microbial, botanical, and other biological formulations applied directly to seeds prior to planting
Study Period 2021–2035
CAGR 12.0% (2026–2035)
Market Size (2025) USD 1.74 Billion
Market Size (2035) USD 5.41 Billion
Fastest Growing Segment Botanicals (by type); Seed Enhancement (by function); Vegetables (by crop type)
Companies Profiled BASF SE, Bayer CropScience, Corteva Agriscience, Syngenta Group, UPL Limited, Novonesis, Verdesian Life Sciences, Koppert Biological Systems, Bioceres Crop Solutions, Advanced Biological Marketing
Valuation Currency USD Billion


FAQs

What is the typical payback period for switching from chemical to biological seed treatment?
Most growers recover the cost differential within one to two growing seasons through reduced fungicide applications and verified yield uplift of 8–15% [14]. Break-even timelines shorten further where government subsidies offset biological input costs.
How do biological seed treatments perform under drought stress conditions?
Mycorrhizal and Bacillus-based treatments improve root water-absorption capacity by 12–20%, providing measurable drought resilience [13]. Performance gains are most pronounced in sandy and loam soils with limited water-holding capacity.
Can biological and chemical seed treatments be applied together on the same seed?
Yes — compatibility testing by major manufacturers confirms that most microbial inoculants maintain viability when co-applied with reduced-rate chemical fungicides [10]. Growers commonly use integrated stacks during transition periods.
What quality certifications should buyers look for when sourcing biological seed treatments?
Buyers should prioritize products carrying ISO 9001 manufacturing certification, OMRI listing for organic systems, and documented colony-forming-unit guarantees at expiry date [16]. Third-party field efficacy data adds further procurement confidence.
How does nano-encapsulation change the storage requirements for microbial seed treatments?
Nano-encapsulation extends ambient-temperature shelf life from 6–12 months to 18–24 months by protecting live microorganisms within polymer matrices [16]. This reduces cold-chain dependency, particularly for tropical distribution channels.
Which crop types show the strongest ROI from biological seed treatment adoption?
Soybeans and pulses deliver the highest returns due to established rhizobial nitrogen-fixation benefits, followed by high-value vegetables where residue-free premiums exceed treatment costs [14]. Commodity grains show moderate but consistent ROI.
How are carbon credit markets influencing biological seed treatment adoption decisions?
Growers using biological treatments that increase soil organic carbon can generate 0.3–0.5 carbon credits per hectare annually under Verra-validated methodologies [8]. This additional revenue stream improves treatment economics in carbon-conscious markets.    
Author
Author
Author Profile
Snehal Singh LinkedIn
Manager - Research
High acumen in analyzing complex macro & micro markets with more than 6 years of work experience in the field of market research. By implementing her analytical skills in forecasting and estimation into market research reports, she has expertise in Packaging, Construction, and Equipment domains. She handles a team size of 20-25 resources and ensures smooth running of the projects, associated marketing activities, and client servicing.
Co-Author
Co-Author Profile
Pradeep Nandi LinkedIn
Senior Research Analyst
I have a bachelor's degree in mechanical engineering and an MBA. I have more than two years of expertise in the retail, food, and beverage, chemical, and material industries, and hence have developed a sound cross-domain expertise. A firm believer in lifelong learning and sharing of knowledge. Having a proclivity for hatching ideas and trying to absorb as much information as possible in a short amount of time. Introducing corporates to the data and insight, which enables them to move from probability to possibility, has been my key areas of interest. 
Share::
Request Free Sample

Research Approach


Secondary Research

The secondary research process involved comprehensive analysis of regulatory databases, agricultural biotechnology journals, crop science publications, and authoritative agricultural organizations. Key sources included the US Environmental Protection Agency (EPA) Biopesticides Registration database, US Department of Agriculture (USDA) National Agricultural Statistics Service (NASS), European Food Safety Authority (EFSA) Plant Health Unit, European Commission Directorate-General for Agriculture (DG AGRI), Food and Agriculture Organization (FAO) FAOSTAT Database, International Seed Federation (ISF), American Seed Trade Association (ASTA), Biological Products Industry Alliance (BPIA), CropLife International, Brazil's Ministry of Agriculture, Livestock and Food Supply (MAPA), India's Ministry of Agriculture & Farmers Welfare, China's Ministry of Agriculture and Rural Affairs (MARA), Agriculture and Agri-Food Canada (AAFC), and national agricultural ministry reports from key markets. These sources were utilized to collect crop acreage statistics, biopesticide registration data, field efficacy studies, adoption trends, and competitive landscape analysis for microbial seed treatments (bacteria and fungi), botanical extracts, and other biological active ingredients.


Primary Research

During the primary research process, qualitative and quantitative insights were gathered by interviewing stakeholders from both the supply and demand sides. Supply-side sources comprised CEOs, VPs of Research & Development, regulatory affairs managers, and commercial directors from manufacturers of biological seed treatments, biopesticide formulators, and microbial inoculant developers. Demand-side sources included chief agronomists, seed treatment experts, procurement heads from seed companies, crop protection managers from large-scale farms, and agricultural cooperative extension officers. Primary research confirmed market segmentation across grains and cereals, oilseeds, and vegetable crops. It also confirmed the development of microbial strains and gathered information on how farmers use chemical seed treatments, how they choose to distribute them, and how prices change.

Primary Respondent Breakdown:

• By Designation: C-level Primaries (32%), Director Level (31%), Others (37%)

• By Region: North America (32%), Europe (30%), Asia-Pacific (28%), Rest of World (10%)


Market Size Estimation

Global market valuation was derived through revenue mapping and treated seed acreage analysis. The methodology included:

• Identification of 50+ key manufacturers across North America, Europe, Asia-Pacific, and Latin America

• Product mapping across microbial (bacterial and fungal), botanical extracts, and biochemical seed treatment categories

• Analysis of reported and modeled annual revenues specific to biological seed treatment portfolios

• Coverage of manufacturers representing 72-78% of global market share in 2024

• Extrapolation using bottom-up (treated acreage × ASP by crop type and region) and top-down (manufacturer revenue validation) approaches to derive segment-specific valuations for seed protection (biofungicides/bioinsecticides) and seed enhancement (biofertilizers/biostimulants) functions

Share::
Request Free Sample
Download Free Sample

Kindly complete the form below to receive a free sample of this Report

Share::
Request Free Sample
Download PDF ×

We do not share your information with anyone. However, we may send you emails based on your report interest from time to time. You may contact us at any time to opt-out.
















