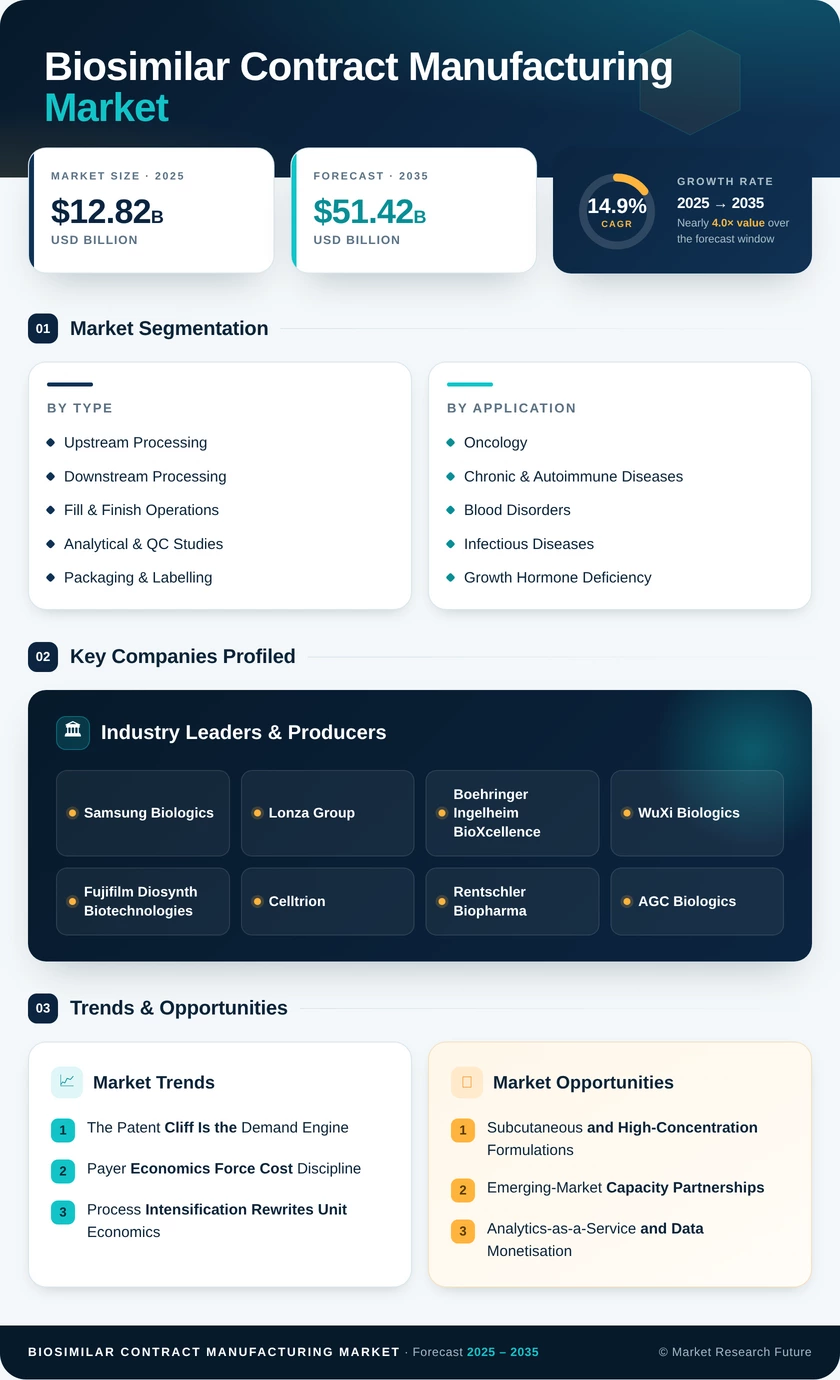
Biosimilar Contract Manufacturing Market (2026 - 2035)

Biosimilar Contract Manufacturing Market Research Report Information By Product (Recombinant Non-glycosylated Proteins and Recombinant Glycosylated Proteins), By Production Technology (Mammalian and Non-Mammalian), By Application (Oncology, Blood Disorders, Growth Hormonal Deficiency, Chronic & Autoimmune Disorders, Rheumatoid Arthritis, and Others), and By Region (North America, Europe, Asia-Pacific, and Rest Of The World) - Growth & Industry Forecast 2025 To 2035

Forecast Period
2026-2035
CAGR
14.9%
2025 Market Size
USD 12.82 Billion
2035 Market Size
USD 51.42 Billion
Pharmaceutical ● Updated August 2026 Report ID: MRFR/Pharma/10382-HCR | Pages: 128 | Author: Rahul Gotadki, Nidhi Mandole
  1. 1 Market Overview |
    1. 1.1 Study Assumptions & Market Definition |
    2. 1.2 Scope of the Study |
    3. 1.3 Research Methodology
  2. 2 Market Summary & Key Report Takeaways |
    1. 2.1 Takeaways by Production Technology |
    2. 2.2 Takeaways by Application |
    3. 2.3 Takeaways by Geography
  3. 3 Market Size & Forecast (2021–2035) |
    1. 3.1 Historical Market Size (2021–2024) |
    2. 3.2 Base Year Assessment (2025) |
    3. 3.3 Forecast Market Size (2026–2035) |
    4. 3.4 Year-over-Year Growth Analysis
  4. 4 Driver Impact Analysis |
    1. 4.1 The Patent Cliff Is the Demand Engine |
    2. 4.2 Payer Economics Force Cost Discipline |
    3. 4.3 Process Intensification Rewrites Unit Economics |
    4. 4.4 Regulatory Convergence Shortens Development
  5. 5 Restraints Impact Analysis |
    1. 5.1 Overcapacity Risk After 2028 |
    2. 5.2 Technology Transfer Failure Points |
    3. 5.3 Talent Scarcity and Commissioning Delays
  6. 6 Opportunity Analysis |
    1. 6.1 Subcutaneous and High-Concentration Formulations |
    2. 6.2 Emerging-Market Capacity Partnerships |
    3. 6.3 Analytics-as-a-Service and Data Monetisation |
    4. 6.4 End-to-End Integrated Programs |
    5. 6.5 Biobetters and Next-Wave Modalities |
    6. 6.6 Industry Value Chain Analysis |
    7. 6.7 Porter's Five Forces Analysis
  7. 7 Regional Market Share & Country-Level Analysis |
    1. 7.1 North America | |
      1. 7.1.1 US | |
      2. 7.1.2 Canada | |
      3. 7.1.3 Mexico |
    2. 7.2 Europe | |
      1. 7.2.1 Germany | |
      2. 7.2.2 UK | |
      3. 7.2.3 France | |
      4. 7.2.4 Italy | |
      5. 7.2.5 Spain | |
      6. 7.2.6 Nordic Countries | |
      7. 7.2.7 Russia | |
      8. 7.2.8 Rest of Europe |
    3. 7.3 Asia-Pacific | |
      1. 7.3.1 China | |
      2. 7.3.2 India | |
      3. 7.3.3 Japan | |
      4. 7.3.4 South Korea | |
      5. 7.3.5 ASEAN | |
      6. 7.3.6 Rest of Asia-Pacific |
    4. 7.4 South America | |
      1. 7.4.1 Brazil | |
      2. 7.4.2 Argentina | |
      3. 7.4.3 Rest of South America |
    5. 7.5 Middle East & Africa | |
      1. 7.5.1 Saudi Arabia | |
      2. 7.5.2 UAE | |
      3. 7.5.3 South Africa | |
      4. 7.5.4 Egypt | |
      5. 7.5.5 Rest of Middle East & Africa
  8. 8 Future Outlook (2026–2035) |
    1. 8.1 Digital Twins and Autonomous Bioprocessing |
    2. 8.2 Platform Economics and Modality Specialisation |
    3. 8.3 Continuous Manufacturing at Commercial Scale |
    4. 8.4 Sustainability as a Contract Criterion
  9. 9 Market Segmentation Analysis |
    1. 9.1 By Production Technology | |
      1. 9.1.1 Mammalian | |
      2. 9.1.2 Microbial |
    2. 9.2 By Product | |
      1. 9.2.1 Recombinant Glycosylated Proteins | |
      2. 9.2.2 Recombinant Non-glycosylated Proteins | |
      3. 9.2.3 Recombinant Peptides |
    3. 9.3 By Application | |
      1. 9.3.1 Oncology | |
      2. 9.3.2 Chronic & Autoimmune Diseases | |
      3. 9.3.3 Blood Disorders | |
      4. 9.3.4 Infectious Diseases | |
      5. 9.3.5 Growth Hormone Deficiency | |
      6. 9.3.6 Other Applications |
    4. 9.4 By Service Type | |
      1. 9.4.1 Upstream Processing | |
      2. 9.4.2 Downstream Processing | |
      3. 9.4.3 Fill & Finish Operations | |
      4. 9.4.4 Analytical & QC Studies | |
      5. 9.4.5 Packaging & Labelling
  10. 10 Competitive Landscape |
    1. 10.1 Market Concentration Analysis |
    2. 10.2 Competitive Benchmarking Matrix |
    3. 10.3 Company Profiles
  11. 11 Recent News & Developments
  12. 12 Report Scope & Methodology
  13. 13 Detailed Sources & Citations
  14. 14 Frequently Asked Questions
  15. 15 LIST OF TABLES
  16. 16 LIST OF FIGURES
Share::
Request Free Sample

Segmentation Quick Reference

DimensionSub-SegmentsDominant SegmentFastest Growing Segment
By Production TechnologyMammalian; MicrobialMammalianMammalian
By ProductRecombinant Glycosylated Proteins; Recombinant Non-glycosylated Proteins; Recombinant PeptidesRecombinant Glycosylated ProteinsRecombinant Peptides
By ApplicationOncology; Chronic & Autoimmune Diseases; Blood Disorders; Infectious Diseases; Growth Hormone Deficiency; Other ApplicationsOncologyInfectious Diseases
By Service TypeUpstream Processing; Downstream Processing; Fill & Finish Operations; Analytical & QC Studies; Packaging & LabellingUpstream ProcessingFill & Finish Operations
By GeographyNorth America; Europe; Asia-Pacific; South America; Middle East & AfricaNorth AmericaAsia-Pacific


Market Segmentation Overview

By Production Technology

Sub-SegmentKey Trend
MammalianIntensified perfusion lifting titres toward 6–9 g/L in single-use suites
MicrobialPichia and E. coli platforms sustaining low-cost insulin and peptide supply


Mammalian capacity absorbs the overwhelming majority of outsourced spend because antibodies dominate the off-patent pipeline. Microbial systems will not disappear — their cost per gram remains unmatched for simple proteins, and insulin volume in emerging economies keeps utilisation steady.

By Product

Sub-SegmentKey Trend
Recombinant Glycosylated ProteinsRising analytical burden on glycan comparability packages
Recombinant Non-glycosylated ProteinsVolume-driven pricing pressure in insulins and growth factors
Recombinant PeptidesGLP-1 class expiries opening a new outsourcing wave


Value concentrates in glycosylated proteins, where characterisation complexity supports premium pricing. Peptides represent the interesting growth story, as metabolic-disease follow-ons approach exclusivity loss in several markets before 2032.

By Application

Sub-SegmentKey Trend
OncologyCheckpoint inhibitor follow-ons entering late-stage development
Chronic & Autoimmune DiseasesLong treatment durations delivering predictable volume forecasts
Blood DisordersMature epoetin and filgrastim programs at commodity pricing
Infectious DiseasesAntiviral antibody development expanding the addressable base.
Growth Hormone DeficiencySomatropin demand concentrated in Asia-Pacific and Latin America.
Other ApplicationsOphthalmology follow-ons gaining tender traction in Europe.


Oncology remains the revenue anchor and will stay so through the decade. Autoimmune programs offer better forecasting reliability, which matters more than headline value when negotiating multi-year capacity reservations.

By Service Type

Sub-SegmentKey Trend
Upstream ProcessingCapital-intensive bioreactor suites driving the largest spend share
Downstream ProcessingContinuous chromatography reducing resin cost per gram
Fill & Finish OperationsDevice-integrated presentations replacing conventional vials
Analytical & QC StudiesExpanding orthogonal method requirements from regulators
Packaging & LabellingMulti-market serialisation compliance adding scope


Upstream work leads on spend, but the fastest structural shift is in fill and finish, where autoinjector and prefilled-syringe demand is outrunning available aseptic capacity. Analytical services deserve close watch: as regulators trade clinical trials for characterisation depth, laboratory scope expands even where bioreactor volume does not.

By Geography

Sub-SegmentKey Trend
North AmericaOnshoring policy redirecting contract spend toward domestic sites
EuropeTender penetration above 90% creating predictable capacity demand.
Asia-PacificKorean and Chinese mega-capacity setting global cost benchmarks.
South AmericaTechnology-transfer partnerships tied to public procurement
Middle East & AfricaLocalisation quotas driving joint-venture site formation.


North America holds the largest share, but the growth centre of gravity has shifted east. Asia-Pacific's combination of installed capacity, government incentives and cost position makes it the region most likely to reset global pricing benchmarks before 2030.




Share::
Request Free Sample
Download PDF ×

We do not share your information with anyone. However, we may send you emails based on your report interest from time to time. You may contact us at any time to opt-out.