Blood Collection Market (2010 - 2021)

Blood Collection Market Research Report By Type (Vacutainer, Syringes, Blood Collection Tubes, Blood Bags), By Method (Manual Blood Collection, Automated Blood Collection, Capillary Blood Collection), By End Use (Hospitals, Diagnostic Laboratories, Blood Banks, Home Care), By Application (Transfusion, Diagnostic Testing, Research) and By Regional (North America, Europe, South America, Asia Pacific, Middle East and Africa) - Growth & Industry Forecast 2025 To 2035

Forecast Period
2010-2021
CAGR
6.13%
2010 Market Size
8.84 USD Billion
2021 Market Size
9.33 USD Billion
Healthcare ● Updated August 25, 2026 Report ID: MRFR/HC/5548-HCR | Pages: 200 | Author: Rahul Gotadki, Nidhi Mandole

Blood Collection Market Summary

The Blood Collection Market reached USD 8.84 billion in 2025 and opens the forecast window at USD 9.33 billion in 2026, climbing to USD 15.94 billion by 2035 at a 6.13% CAGR. Two catalysts anchor that trajectory. The first is regulatory: sharps-safety enforcement under the U.S. Needlestick Safety and Prevention Act and the EU Council Directive 2010/32/EU continues to force conversion from conventional to safety-engineered devices, a swap that carries a 30–60% unit price premium [1][4]. The second is volumetric — global diagnostic test throughput keeps rising as chronic disease prevalence expands, and every test begins with a specimen.

Technology is reshaping what sits on the phlebotomy tray. Glass tubes and hand-assembled draw sets are giving way to plastic vacuum tubes with additive-optimized coatings, closed-system transfer devices, and automated apheresis platforms that manage donor sessions with minimal operator input. Hospital systems in the United States and Japan have committed capital to robotic vein-visualization and pre-analytical sorting cells; the U.S. laboratory automation installed base grew roughly 11% between 2022 and 2025 [7][12].

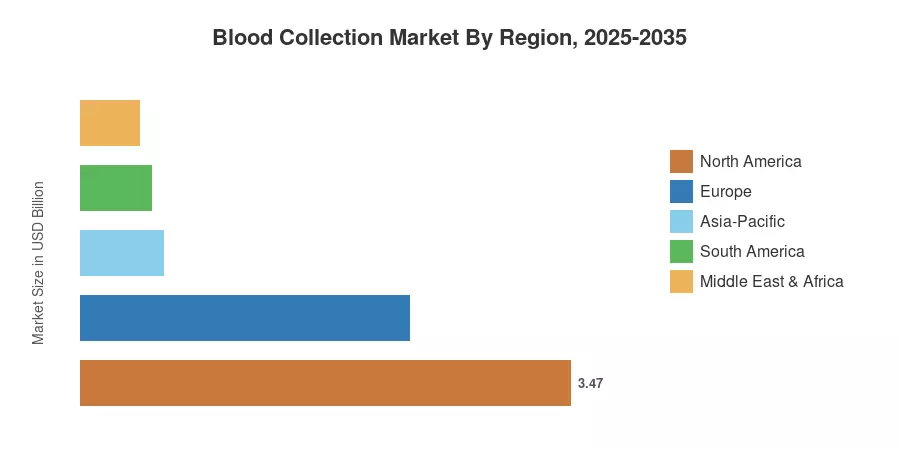
Geography still dictates strategy. North America controls 39.2% of 2025 revenue on the strength of reimbursed outpatient testing, while Asia-Pacific compounds fastest at 6.62% as India's Ayushman Bharat network and China's tiered-hospital buildout scale collection capacity [9][15]. Europe holds second position, supported by centralized blood-service procurement. Through 2035, the Blood Collection Market rewards suppliers who pair consumable reliability with automation-ready formats.


Key Report Takeaways

• By Product

  • Needles and syringes commanded 35.5% of 2025 Blood Collection Market revenue, the largest single product pool
  • Tubes are the fastest-expanding product line at a 7.80% CAGR through 2035
  • Safety needles generated roughly USD 1.34 billion in 2025 as conversion mandates tightened

• By Collection Method & Application

  • Manual collection retained 51.2% of volume-weighted revenue in 2025
  • Automated systems advanced at a 9.02% CAGR, the steepest growth rate anywhere in the Blood Collection Market
  • Diagnostics applications accounted for 63.3% of 2025 revenue

• By Region

  • North America held 39.2% of global revenue in 2025
  • Asia-Pacific posts the fastest regional growth at 6.62% CAGR
  • Europe contributed approximately USD 2.33 billion in 2025


Market Size and Forecast (2021–2035)

Figures below blend bottom-up consumable shipment tracking across roughly 40 device manufacturers with top-down validation against national laboratory test-volume registries, customs trade data, and blood-service procurement disclosures. Historical years are reconciled to audited segment revenues where public filings permit.
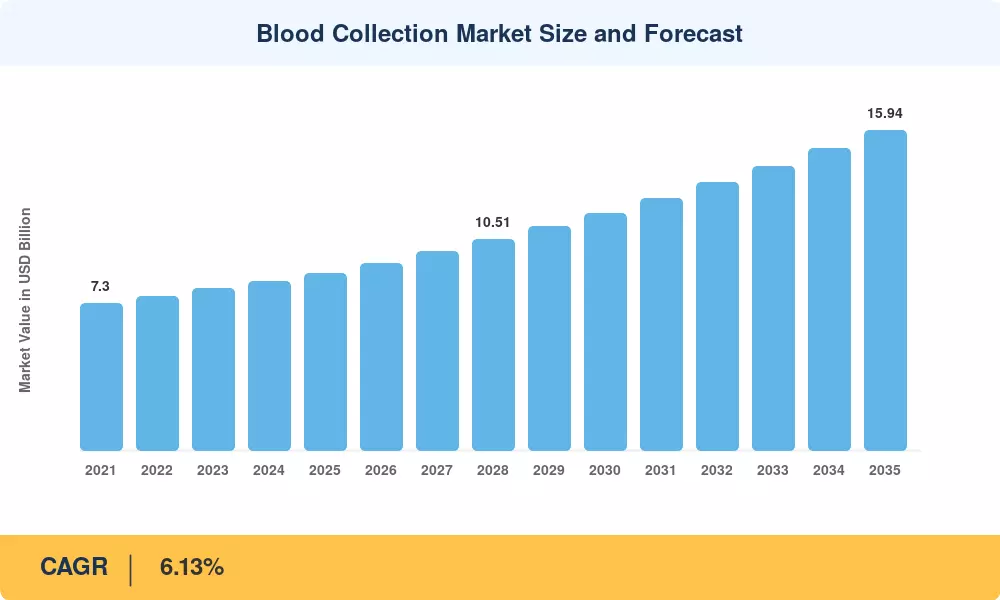
Blood Collection Market Size and Forecast
Our Impact
Enabled $4.3B Revenue Impact for Fortune 500 and Leading Multinationals
Partnering with 2000+ Global Organizations Each Year
30K+ Citations by Top-Tier Firms in the Industry

Driver Impact Analysis

Driver ~% Impact on CAGR Geographic Relevance Impact Timeline
Chronic disease burden lifting diagnostic test volume +1.40 Global Long-term (≥4 yr)
Sharps-safety regulation forcing device conversion +1.10 North America, Europe Medium-term (2–4 yr)
Laboratory automation amid phlebotomist shortages +0.90 North America, Europe, Japan Medium-term (2–4 yr)
Blood-banking network expansion in emerging economies +0.80 APAC, MEA, South America Long-term (≥4 yr)
Surgical procedure recovery and backlog clearance +0.60 Global Short-term (≤2 yr)
Decentralized and home-based specimen collection +0.50 North America, Europe, APAC Long-term (≥4 yr)
National preventive screening programs +0.40 APAC, Middle East Medium-term (2–4 yr)


Diagnostic Volume Growth Anchored in Chronic Disease

The specimen is the gating input, and laboratory results account for about 70% of clinical decisions. According to WHO estimations, noncommunicable illnesses account for almost 74% of fatalities worldwide; this load directly affects coagulation, lipid, HbA1c, and renal panels [6]. Every recurrent panel is a repeating sale of consumables. The Blood Collection Market has exceptionally low revenue volatility in comparison to capital-equipment medtech categories because of its annuity feature.


Sharps-Safety Regulation and the Conversion Premium

The most powerful policy lever on product mix is still occupational exposure. The binding 2013 transposition deadline for Directive 2010/32/EU was informed by comparable European figures, and CDC surveillance attributed about 385,000 percutaneous injuries each year to U.S. hospital staff prior to complete safety-device adoption [1][4]. Suppliers benefit from conversion economics since safety-engineered wing sets and holders have significantly higher ASPs than their traditional counterparts, increasing revenue per venipuncture blood draw even in situations where procedure counts remain unchanged.


Automation as a Labor-Shortage Response

Staffing, not demand, constrains many collection sites. U.S. Bureau of Labor Statistics projections point to phlebotomist employment growth around 8% through 2033 against persistent vacancy rates in hospital outreach programs [8]. Laboratories respond by buying pre-analytical automation, tube-labeling robotics, and closed automated apheresis systems that compress operator time per session. Automated platforms consequently outgrow manual formats by nearly three percentage points annually.

Emerging-Market Infrastructure Buildout

Public financing is the growth engine outside mature markets. India's national health programs have expanded empanelled facility counts past 30,000, each requiring baseline collection stock, while China's tiered-hospital reform channelled substantial provincial capital into county-level laboratory upgrades between 2021 and 2025 [9][15]. Volume in these geographies skews toward standard tubes and needles rather than premium safety formats — a mix reality suppliers must price for.


Restraints Impact Analysis

Restraint weightings follow the same directional convention as Section 4. Negative values indicate drag on the headline growth rate and are not additive.

Restraint ~% Impact on CAGR Geographic Relevance Impact Timeline
Consumable commoditization and GPO tender price erosion −0.70 North America, Europe Short-term (≤2 yr)
Reimbursement compression on routine laboratory testing −0.50 North America, Europe Medium-term (2–4 yr)
EU MDR and UDI compliance cost burden −0.40 Europe Medium-term (2–4 yr)
Medical polymer and sterilization capacity constraints −0.30 Global Short-term (≤2 yr)
Substitution from micro-sampling and non-invasive monitoring −0.30 North America, Europe Long-term (≥4 yr)


Tender Economics and Margin Compression

Most U.S. acute-care consumable volume is now negotiated by group purchasing groups, and multi-year tube contracts frequently include yearly price step-downs of 2-4% [5]. The basic commodity tube is still a share-defended, low-margin product, but suppliers counteract this with a mix that includes safety formats, specialist additives, and bundled services. Thus, growth in supplier profit is overstated by growth in unit volume.


Regulatory Compliance Overhead in Europe

Thousands of legacy Class I and IIa devices had to be recertified as a result of the EU Medical Device Regulation's transition, and notified-body capacity limitations caused review timeframes to be far longer than the initial 2024 requirements [4]. Smaller producers reduced the level of competition in specialized formats by rationalizing their portfolios rather than bearing the expense. Quiet consolidation and a slight revenue loss are the overall effects on the blood collection market.


Substitution Risk from Sampling Miniaturization

Volume-reduction technology cuts consumable consumption per patient. Validated microtainer workflows and dried-blood-spot cards already displace full-tube draws in pediatric and remote settings, and analyzer sensitivity improvements continue lowering minimum sample requirements [13]. The threat is real but slow-moving; central-lab reference methods still demand serum and plasma volumes that miniaturized formats cannot yet supply reliably.


Blood Collection Market Opportunities

Safety Conversion in Asia-Pacific and Latin America

Conversion penetration in most emerging economies sits far below Western levels, leaving a large addressable upgrade pool. Suppliers who localize manufacturing to meet domestic-content tender rules can capture that shift at defensible margins rather than ceding it to regional low-cost producers.

Home and Retail Specimen Collection Channels

Direct-to-consumer testing and payer-funded home visits create a distribution channel with different packaging, stabilization, and cold-chain requirements than hospital supply. Kit-level design ownership — not component supply — is where margin concentrates in this channel.

Automation-Ready Consumable Ecosystems

Pre-analytical robotics only work with tubes that meet tight dimensional and label-registration tolerances. Manufacturers who certify their consumables against major track systems convert an equipment sale into a decade-long consumable lock-in.

Donor Data and Managed-Service Models

Apheresis and blood-bank platforms generate donor throughput, deferral, and yield data that services organizations can monetize as managed collection contracts. Shifting from device sale to per-procedure pricing smooths revenue and raises switching costs.

Sustainable Materials and Sharps Circularity

Health systems in the Nordics and the UK now weight environmental criteria in tenders, opening space for recyclable holders, reduced-plastic packaging, and validated sharps reprocessing programs.


Blood Collection Market Future Outlook

Autonomous and Assisted Venipuncture

Vein-visualization guidance and robotic cannulation move from pilot deployments toward selective clinical adoption over the coming decade. First-attempt success rates in difficult-access populations remain the commercial proof point, and hospitals will quantify value through reduced repeat draws and shorter patient throughput times rather than device price alone [7].

Decentralized Collection Economics

Patient-side sampling reshapes distribution. Payer pilots covering at-home draws for chronic disease monitoring have expanded steadily, and each program shifts demand from bulk hospital SKUs toward sealed, stabilized, shipping-validated kits [11]. Suppliers with direct fulfilment capability capture disproportionate value in this channel.

Miniaturization and Analyzer Co-Design

Sample-volume requirements keep falling as analyzer sensitivity improves. Manufacturers who co-develop capillary blood sampling devices alongside instrument vendors will own the validated workflow, and validation — not hardware novelty — determines which format laboratories actually adopt [13].

Sustainability Reporting Enters Procurement

Health systems representing a growing share of global spend now publish Scope 3 emission targets that include single-use medical consumables [21]. Expect lifecycle documentation, recycled-content declarations, and take-back schemes to become tender prerequisites in Europe by the early 2030s, with North America following on a lag.


Blood Collection Market Segmentation

By Product

The Blood Collection Market segments across six product families with sharply different growth profiles.

Segment Metric (2025) Primary Demand Driver
Needles & Syringes 35.5% share Universal procedure requirement across all care settings
Tubes 7.80% CAGR Additive specialization and automation compatibility
Safety Needles USD 1.34 Billion Occupational exposure regulation
Blood Bags 12.4% share Transfusion and donation network volume
Lancets 6.94% CAGR Point-of-care and self-monitoring expansion
Other Products 4.5% share Tourniquets, holders, transfer devices


Needles and syringes hold scale because nothing replaces them functionally, yet tubes generate the more interesting growth story. Additive chemistry has become a differentiator — coagulation, molecular, and liquid-biopsy workflows each demand purpose-built stabilizers, and premium specialty tubes carry ASPs several multiples above standard EDTA formats.

By Collection Method

Segment Metric (2025) Primary Demand Driver
Manual 51.2% share Ubiquity, low capital requirement, small-site suitability
Automated 9.02% CAGR Labor scarcity and apheresis throughput demands


Automated systems represent the clearest structural shift inside the Blood Collection Market. Apheresis platforms now handle a rising proportion of plasma and platelet collection because yield per donor session materially exceeds whole-blood fractionation. Manual methods will not disappear — they remain the only economical option below a certain daily draw volume — but their revenue share erodes steadily through 2035.

By Application

Segment Metric (2025) Primary Demand Driver
Diagnostics 63.3% share Recurring test panels for chronic disease management
Therapeutics / Transfusion 7.58% CAGR Surgical volume and plasma-derived therapy demand

The Diagnostics segment dominated the market, accounting for 63.3% share, driven by the growing demand for accurate disease detection, screening, and monitoring solutions. Meanwhile, the Therapeutics/Transfusion segment is projected to be the fastest-growing segment, registering a 7.58% CAGR, supported by increasing demand for therapeutic interventions, blood transfusion services, and advanced treatment solutions.

By End User

Segment Metric (2025) Primary Demand Driver
Hospitals & Diagnostic Centers 50.0% share Inpatient and outreach draw volume concentration
Blood Banks USD 1.90 Billion Donation drives and national reserve requirements
Point-of-Care & Home-Care Settings 8.78% CAGR Decentralized testing and payer-funded home visits
Research & Academic Laboratories 8.2% share Clinical trial sample collection protocols
Other End Users USD 0.40 Billion Occupational health, insurance screening, military


Hospitals anchor the demand base, but point-of-care and home-care settings deliver the growth. Plasma collection deserves separate attention within blood banks: source plasma demand for immunoglobulin and albumin therapies has outpaced overall transfusion demand for several consecutive years, pulling apheresis consumable volume with it [18].


Regional Market Share Analysis

Region Metric (2025) Primary Investment Themes
North America 39.2% share Safety compliance, pre-analytical automation, outreach phlebotomy
Europe USD 2.33 Billion MDR re-certification, centralized blood services, sustainability tenders
Asia-Pacific 6.62% CAGR Hospital network expansion, domestic manufacturing, screening programs
South America USD 0.50 Billion Public blood-bank modernization, tender-driven procurement
Middle East & Africa 4.7% share Donor recruitment infrastructure, transfusion safety upgrades
Total USD 8.84 Billion

The Blood Collection Market splits along a familiar axis: mature regions buy premium safety and automation, emerging regions buy volume.


North America

Country Metric (2025) Key Driver
US 84.6% of region Reimbursed outpatient testing volume and OSHA sharps enforcement [1]
Canada USD 0.31 Billion Provincial laboratory consolidation programs [10]
Mexico 5.19% CAGR IMSS facility expansion and private lab chain growth [15]


Regional demand rests on test frequency rather than population growth. U.S. clinical laboratories process billions of specimens annually, and outreach phlebotomy — draws performed at patient service centers rather than inpatient bedsides — now represents the fastest-expanding site of care. Enforcement remains a live cost: OSHA bloodborne pathogen citations continue to appear among the more frequently cited healthcare standards, keeping safety-device budgets protected during cost-reduction cycles [1].

Europe

Country Metric (2025) Key Driver
Germany 23.1% of region Dense hospital laboratory network and DRG-funded testing [10]
UK USD 0.38 Billion NHS Blood and Transplant procurement centralization [19]
France 14.6% of region Établissement Français du Sang donation infrastructure [20]
Italy 10.8% of region Regional health authority tender cycles [4]
Spain USD 0.17 Billion Primary-care phlebotomy network expansion [10]
Nordic Countries 6.72% CAGR Sustainability-weighted procurement criteria [21]
Russia 5.1% of region State transfusion service modernization [16]
Rest of Europe USD 0.21 Billion Central and Eastern European facility upgrades [15]


Procurement in Europe is more centralized than anywhere else, which compresses supplier count while enlarging individual contract value. National blood services in the UK and France tender multi-year consumable frameworks covering donation sets, apheresis kits, and testing tubes in single awards [19][20]. Environmental scoring is the newest variable — several Nordic authorities now assign explicit weighting to packaging waste and recyclability, a criterion that barely registered five years ago [21].

Asia-Pacific

Country Metric (2025) Key Driver
China 34.8% of region Tiered-hospital reform and county laboratory upgrades [9]
India 7.41% CAGR Ayushman Bharat empanelment and diagnostic chain buildout [15]
Japan USD 0.41 Billion Aging demographics and Japanese Red Cross donation programs [22]
South Korea 8.9% of region National health screening participation rates [17]
ASEAN USD 0.19 Billion Public-private hospital partnerships [15]
Rest of Asia-Pacific 5.7% of region Rural collection point expansion [16]


Growth here is capacity-led. China and India together add collection sites faster than any other geography, and both governments favor domestic manufacturing through procurement preference rules, which pushes multinationals toward local plants or joint ventures [9][15]. Japan runs the opposite playbook — flat volumes, premium mix, and heavy investment in automated donor-side apheresis to manage a shrinking donor base against rising transfusion demand [22].

South America

Country Metric (2025) Key Driver
Brazil 61.4% of region Hemocentro network modernization under Ministry of Health funding [16]
Argentina USD 0.09 Billion Provincial laboratory equipment renewal [15]
Rest of South America 6.28% CAGR Andean public health screening expansion [16]


Brazil dominates regional consumption through its public hemocentro system, which coordinates donation and transfusion across every state. Currency volatility complicates import-dependent supply, so regional distributors carry heavier inventory buffers than global norms, and manufacturers increasingly quote in local currency to win tenders [16].

Middle East & Africa

Country Metric (2025) Key Driver
Saudi Arabia 27.9% of region Vision 2030 health sector transformation funding [23]
UAE USD 0.07 Billion Medical tourism-linked diagnostic capacity [23]
South Africa 19.4% of region National Blood Service donor programs [16]
Egypt 6.85% CAGR Universal health insurance rollout [15]
Rest of MEA 22.1% of region Donor recruitment and transfusion safety initiatives [24]


Gulf states buy at specification levels comparable to Western Europe, while Sub-Saharan procurement remains donor-agency dependent. WHO transfusion safety programs continue to fund basic collection infrastructure across low-income countries, making multilateral tender participation a genuine route to market rather than a peripheral channel [24].


Blood Collection Market By Region, 2025-2035

Competitive Benchmarking

Concentration is moderate. The top five suppliers control an estimated 52–58% of global revenue, producing an HHI in the approximate 900–1,200 range — consolidated at the premium end, genuinely fragmented in commodity tubes and needles where regional manufacturers compete aggressively on price. Incumbents defend position through installed-base lock-in, tender relationships, and regulatory dossier depth rather than technological moat.

Company Est. Revenue Share Range Key Offerings for Blood Collection Market Strategic Positioning
Becton, Dickinson and Company ~24–28% Vacutainer tube systems, safety winged sets, holders Category leader; unmatched breadth and automation certification
Terumo Corporation ~9–12% Venous blood collection systems, apheresis platforms, blood bags Strong in Japan and transfusion medicine; expanding in APAC
Fresenius Kabi ~6–9% Apheresis systems, plasma collection sets, transfusion consumables Vertically linked to plasma-derived therapeutics demand
Grifols S.A. ~5–8% Plasma collection kits, donor management systems Plasma-centric; captive internal collection network
Greiner Bio-One ~5–7% Preanalytical tube systems, capillary and safety devices European stronghold; premium additive chemistry
Nipro Corporation ~4–6% Needles, tubes, blood bags, dialysis-adjacent consumables Cost-competitive Asian manufacturing scale
Sarstedt AG & Co. KG ~3–5% Aspiration and vacuum tube systems, sample transport Closed-system specialist; laboratory workflow focus
Haemonetics Corporation ~3–5% Automated plasma and platelet collection platforms Apheresis technology leader; software-enabled services
Cardinal Health ~2–4% Distributed collection consumables, kitting services Distribution and private-label leverage in North America
Macopharma ~1–3% Blood bag systems, leukoreduction filters Transfusion safety niche; European blood service supplier
Retractable Technologies ~1–2% Retractable safety needles and tube holders Pure-play safety device challenger
Improve Medical Instruments ~1–2% Vacuum tubes, needles for emerging market tenders Domestic-content advantage in China procurement


Recent News & Developments

  • Becton, Dickinson and Company (September 2024): Announced plans to separate its Biosciences and Diagnostic Solutions business, signalling sharper capital focus on core medical consumables including preanalytical systems [25].
  • Grifols (March 2024): Expanded U.S. plasma donation center footprint and upgraded donor management software across the network, raising apheresis consumable consumption per site [26].
  • Terumo (June 2024): Commissioned additional manufacturing capacity in Vietnam and India to serve Asia-Pacific tender demand under local-content procurement rules [27].
  • European Commission (January 2024): Extended MDR transition deadlines for legacy devices, easing near-term certification pressure on smaller collection device manufacturers [4].
  • Haemonetics (November 2023): Advanced next-generation plasma collection platform deployments with major commercial collectors, targeting reduced session time per donor [18].
  • Greiner Bio-One (May 2025): Introduced expanded specialty tube formats for molecular and liquid-biopsy workflows, addressing stabilization requirements for cell-free nucleic acid analysis [28].
  • WHO (April 2025): Published updated guidance supporting voluntary non-remunerated donation expansion in low- and middle-income countries, reinforcing multilateral funding for collection infrastructure [24].
  • Fresenius Kabi (October 2025): Received regulatory clearance for an updated automated collection system configuration in selected European markets, extending platform lifecycle [29].


Blood Collection Market Report Scope

Parameter Detail
Market Scope Global market for blood collection devices and consumables across diagnostics and transfusion applications
Study Period 2021–2035
Historical Period 2021–2024
Base Year 2025
Forecast Period 2026–2035
CAGR (2026–2035) 6.13%
Market Size Checkpoint (2025) USD 8.84 Billion
Market Size Checkpoint (2026) USD 9.33 Billion
Market Size Checkpoint (2035) USD 15.94 Billion
Fastest Growing Product Segment Tubes (7.80% CAGR)
Fastest Growing Method Segment Automated (9.02% CAGR)
Fastest Growing End User Point-of-Care & Home-Care Settings (8.78% CAGR)
Fastest Growing Region Asia-Pacific (6.62% CAGR)
Companies Profiled 12 major suppliers including BD, Terumo, Fresenius Kabi, Grifols, Greiner Bio-One, Nipro, Sarstedt, Haemonetics, Cardinal Health, Macopharma, Retractable Technologies, Improve Medical
Valuation Currency USD Billion
Segmentation Dimensions Product, Collection Method, Application, End User, Geography

FAQs

What procurement criteria matter most when standardizing tube suppliers across a multi-site hospital network?
Analyzer validation compatibility outranks unit price. Switching tube brands requires re-verifying reference ranges on every affected assay, a hidden cost that often exceeds the contract savings [12].
How should budget holders treat needle-free and micro-sampling technologies within the Blood Collection Market today?
Treat them as pilot line items, not replacement budgets. Reference-lab methods still require conventional sample volumes, so plan parallel supply for at least the next five years [13].
What integration challenges arise when connecting collection hardware to laboratory information systems?
Label registration and barcode symbology mismatches cause most failures. Confirm that tube dimensions and print zones match your middleware specification before signing, since retrofitting label applicators is expensive [7].
Which regulatory nuance most often delays product entry into the Blood Collection Market?
Notified-body capacity, not technical review. European certification queues have extended timelines well past manufacturer projections, so build eighteen months of buffer into launch plans [4].
How should investors interpret consolidation signals across the Blood Collection Market?
Watch plasma-adjacent acquisitions rather than tube manufacturers. Apheresis and donor-management assets command premium multiples because they carry recurring service revenue and higher switching costs [18].
Are reusable tourniquets and holders viable under current infection-control guidance?
Single-patient-use tourniquets are increasingly expected in accredited settings after contamination studies. Reusable holders face similar scrutiny and are being phased out in most sharps-safety compliant programs [1].
What emerging use cases sit outside traditional clinical diagnostics?
Decentralized clinical trials and insurance underwriting now generate meaningful kit volume. Both demand shipping-validated, tamper-evident packaging that standard hospital consumables do not provide [11].      
Author
Author
Author Profile
Rahul Gotadki LinkedIn
Research Manager
He holds an experience of about 9+ years in Market Research and Business Consulting, working under the spectrum of Life Sciences and Healthcare domains. Rahul conceptualizes and implements a scalable business strategy and provides strategic leadership to the clients. His expertise lies in market estimation, competitive intelligence, pipeline analysis, customer assessment, etc.
Co-Author
Co-Author Profile
Nidhi Mandole LinkedIn
Senior Research Analyst
She is an extremely curious individual currently working in Healthcare and Medical Devices Domain. Nidhi is comfortably versed in data centric research backed by healthcare educational background. She leverages extensive data mining and analytics tools such as Primary and Secondary Research, Statistical Analysis, Machine Learning, Data Modelling. Her key role also involves Technical Sales Support, Client Interaction and Project management within the Healthcare team. Lastly, she showcases extensive affinity towards learning new skills and remain fascinated in implementing them.
Share::
Request Free Sample

Research Approach


Secondary Research

The secondary research process involved comprehensive analysis of regulatory databases, peer-reviewed biomedical journals, clinical laboratory publications, and authoritative health organizations. Key sources included the US Food & Drug Administration (FDA) 510(k) Premarket Notification Database and Medical Device Reporting (MDR), Centers for Disease Control and Prevention (CDC) Blood Safety Surveillance, World Health Organization (WHO) Global Database on Blood Safety, European Medicines Agency (EMA) Medical Device Regulation (MDR) compliance filings, AABB (Association for the Advancement of Blood & Transfusion Medicine) standards, International Society of Blood Transfusion (ISBT) guidelines, Clinical and Laboratory Standards Institute (CLSI) document repository, Occupational Safety and Health Administration (OSHA) Bloodborne Pathogens Standard compliance data, National Institutes of Health (NIH) National Heart, Lung, and Blood Institute (NHLBI) hematology research database, PubMed/MEDLINE for phlebotomy and venipuncture literature, EU Eurostat Healthcare Resource Statistics, OECD Health Statistics, and national blood transfusion service reports from key markets.

These sources were employed to compile data on blood draw procedure statistics, device approval data, safety incident reports, infectious disease testing trends, and market landscape analysis for automated collection systems, collection containers, needles and lancets, and blood collection tubes.


Primary Research

Qualitative and quantitative insights were obtained by interviewing supply-side and demand-side stakeholders during the primary research process. Supply-side sources comprised CEOs, VPs of Research & Development, regulatory affairs chiefs, and commercial directors from diagnostic OEMs, safety engineering firms, and blood collection device manufacturers. Phlebotomy supervisors, clinical laboratory directors, blood bank medical directors, infection control specialists, and procurement leads from hospital systems, independent diagnostic laboratories, blood collection centers, and academic medical centers constituted demand-side sources in this study. Primary research has confirmed pipeline timelines for safety-engineered devices, validated product segmentation across EDTA, heparin, serum separator tubes, and specialized coagulation tubes, and gathered insights on clinical adoption patterns, pricing strategies, and reimbursement dynamics for routine versus specialized blood collection procedures.

Primary Respondent Breakdown:

• By Designation: C-level Primaries (32%), Director Level (30%), Others (38%)

• By Region: North America (32%), Europe (30%), Asia-Pacific (28%), Rest of World (10%)


Market Size Estimation

Revenue mapping and procedure volume analysis were implemented to determine global market valuation. The methodology comprised the following:

• Identification of over 40 key manufacturers in North America, Europe, Asia-Pacific, and Latin America who specialize in safety needles, evacuated tube systems, and blood collection devices

• Product mapping for automated phlebotomy systems, blood bags, collection sets, needles and lancets, and blood collection containers (whole blood, plasma, serum, and anticoagulant types)

• Examination of the annual revenues that have been reported and modeled for the blood collection and specimen collection portfolios

• In 2024, the coverage of manufacturers will account for 75-80% of the global market share.

• Segment-specific valuations for diagnostic testing, blood banking, and research applications are derived through extrapolation using bottom-up (blood draw procedure volume × ASP by country/setting) and top-down (manufacturer revenue validation) approaches.

Share::
Request Free Sample
Download Free Sample

Kindly complete the form below to receive a free sample of this Report

* Please use a valid business email

Share::
Request Free Sample
Download PDF ×

We do not share your information with anyone. However, we may send you emails based on your report interest from time to time. You may contact us at any time to opt-out.
















