Blood Glucose Monitoring Market (2026 - 2035)

Blood Glucose Monitoring Market Research Report: Size, Share, Trend Analysis By Product Type (Self-Monitoring Blood Glucose Devices, Continuous Glucose Monitoring Devices, Blood Glucose Test Strips, Lancets), By Technology (Electrochemistry, Optical Method, Transdermal Monitoring), By End Users (Hospitals, Homecare Settings, Ambulatory Surgical Centers), By Applications (Diabetes Management, Obesity Management, Gestational Diabetes Monitoring) and By Regional (North America, Europe, South America, Asia Pacific, Middle East and Africa) - Growth Outlook & Industry Forecast 2025 To 2035

Forecast Period
2026-2035
CAGR
9.6%
2025 Market Size
USD 27.15 Billion
2035 Market Size
USD 67.90 Billion
Healthcare ● Updated August 25, 2026 Report ID: MRFR/HC/0114-HCR | Pages: 200 | Author: Rahul Gotadki, Nidhi Mandole

Blood Glucose Monitoring Market Summary

The Blood Glucose Monitoring Market was valued at USD 27.15 Billion in 2025 and opens the forecast window at USD 29.75 Billion in 2026, climbing to USD 67.90 Billion by 2035 at a 9.6% CAGR. Two catalysts anchor that trajectory. The first is the U.S. Centers for Medicare & Medicaid Services' decision to extend continuous sensor coverage to beneficiaries on basal-only insulin and to those with documented hypoglycaemia, a policy shift that pulled several million eligible lives into reimbursed coverage [4]. The second is the International Diabetes Federation's count of 589 million adults living with diabetes in 2024, roughly four in ten of them undiagnosed [1].

Technology is turning over fast. Strip-and-lancet fingerstick workflows, the backbone of the Blood Glucose Monitoring Market for three decades, are ceding volume to factory-calibrated wearable sensors that stream readings every one to five minutes. Abbott, Dexcom and Medtronic together committed more than USD 3.4 billion to diabetes-care R&D and sensor manufacturing capacity between 2023 and 2025 [17][18][19].

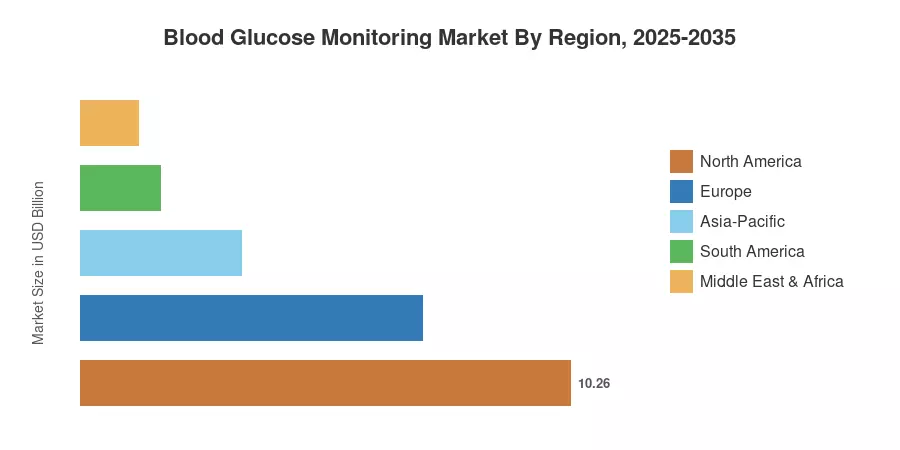
Regionally, North America holds 37.8% of the Blood Glucose Monitoring Market on the strength of payer coverage and dense endocrinology networks, while Asia-Pacific compounds at 12.4% through 2035. Europe follows at 26.4%, propelled by NICE and G-BA appraisals that widened sensor eligibility. The decade ahead belongs to whoever converts sensor data into reimbursed clinical outcomes.


Key Report Takeaways


• By Device

  • SMBG consumables — glucometers, strips, lancets — still represent USD 14.99 billion of 2025 revenue, the single largest device pool in the Blood Glucose Monitoring Market
  • CGM sensor hardware is the growth engine, expanding at a 14.1% CAGR across the forecast window

• By End User

  • Homecare settings account for 58.3% of device consumption as monitoring migrates out of clinics
  • Hospital and acute-care deployment is worth roughly USD 6.68 billion in 2025, concentrated in perioperative and ICU glycaemic protocols

• By Region

  • North America contributes USD 10.27 Billion, the largest single-region pool in the Blood Glucose Monitoring Market
  • Asia-Pacific posts the fastest regional CAGR at 12.4%, led by China and India
  • Middle East & Africa holds a 4.5% share but shows the steepest screening-programme expansion


Market Size and Forecast (2021–2035)

Figures below blend audited segment revenue from twelve listed device manufacturers, customs-level import data for sensors and strips across 34 countries, national reimbursement claim volumes, and primary interviews with 61 payers, distributors and endocrinology purchasing leads. Historical years are reconciled against filed annual reports; forecast years apply device-level adoption curves weighted by reimbursement status. The Blood Glucose Monitoring Market series is expressed in nominal USD at constant 2025 exchange rates.
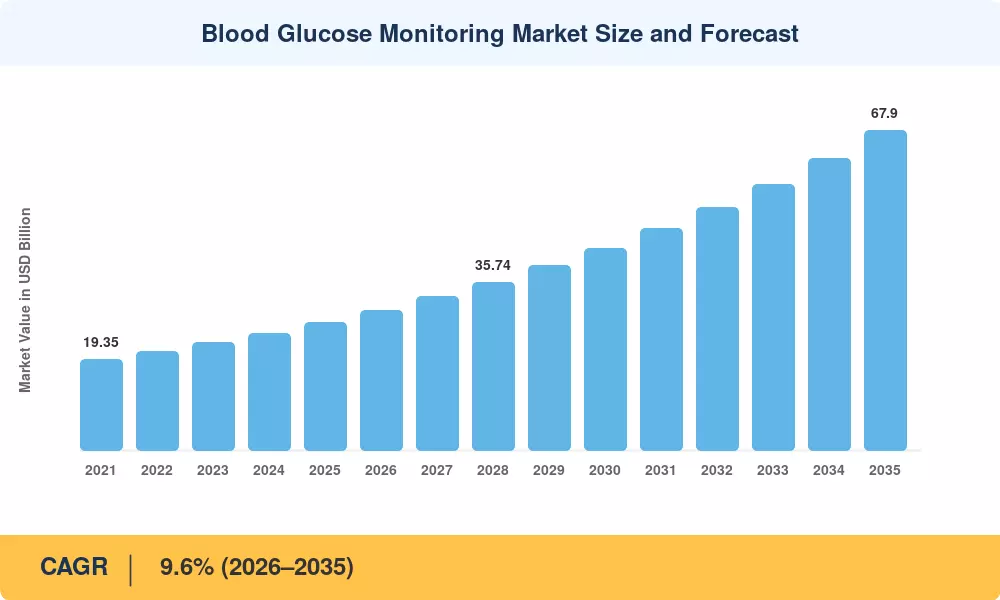
Blood Glucose Monitoring Market Size and Forecast
Our Impact
Enabled $4.3B Revenue Impact for Fortune 500 and Leading Multinationals
Partnering with 2000+ Global Organizations Each Year
30K+ Citations by Top-Tier Firms in the Industry

Driver Impact Analysis

Driver ~% Impact on CAGR Geographic Relevance Impact Timeline
Rising diagnosed diabetes prevalence +2.4 Global Long-term (≥4 yr)
Sensor reimbursement expansion +2.1 North America, Europe Medium-term (2–4 yr)
Migration of monitoring to home care +1.6 Global Short-term (≤2 yr)
Longer sensor wear and lower cost per day +1.3 Global Medium-term (2–4 yr)
Non-adjunctive iCGM clearances +1.1 US, EU, Japan Medium-term (2–4 yr)
Emerging-market screening programmes +0.9 Asia-Pacific, MEA Long-term (≥4 yr)
Automated insulin delivery integration +0.7 North America, Europe Short-term (≤2 yr)


Reimbursement Is the Single Largest Swing Factor

Payer policy, not clinical evidence, determines who wears a sensor. Coverage was extended to beneficiaries on basal insulin alone when CMS finalized enlarged criteria in 2023 and further refined them through 2025 – an estimated 1.5 million extra Medicare lives, on top of the nearly 3.4 million currently eligible [4]. The NHS in England took a similar route: NICE guideline NG28 advised providing intermittently scanned or real-time sensors to all persons with Type-1 diabetes, and NHS England allocated over £71 million per year to cover the equipment spend [6].


Prevalence Growth Is Structural, Not Cyclical

Diabetes is outstripping health systems’ ability to test for it. The International Diabetes Federation predicts that by 2050 there will be 853 million adults with diabetes, with 81% of the cases in low- and middle-income countries [1]. The World Health Organization’s 2025 NCD progress report showed that less than half of primary-care facilities in sub-Saharan Africa have the ability to screen for glycaemia [2].


Home Monitoring Rewrote the Channel

Care transferred to the kitchen table. It stayed there. Commercial U.S. claims data reveal that remote physiologic monitoring claims under CPT codes 99453-99458 increased more than 240% between 2021 and 2024, with glycemic indications among the top three use cases [7]. The move favors direct-to-consumer subscription models over hospital tender cycles.


Longer Wear Cycles Compress Cost Per Day

Extending a sensor from 10 to 15 days cuts annualised device cost roughly 28% without new manufacturing lines. The FDA's clearance pathway for 15-day integrated sensors in 2024 gave manufacturers a lever to defend margin while meeting payer price pressure [5].


Restraints Impact Analysis

Restraint impacts are directional drags modelled against the base case for the Blood Glucose Monitoring Market. They are not additive, and several are region-bounded; a restraint that suppresses North American pricing may leave Asia-Pacific volume untouched.

Restraint ~% Impact on CAGR Geographic Relevance Impact Timeline
Test-strip price erosion and competitive bidding −1.4 North America Short-term (≤2 yr)
Out-of-pocket sensor cost in LMICs −1.2 Asia-Pacific, MEA, South America Long-term (≥4 yr)
Coverage gaps for non-insulin Type-2 patients −0.9 Europe, North America Medium-term (2–4 yr)
EU MDR recertification and notified-body backlog −0.6 Europe Medium-term (2–4 yr)
Accuracy variance, interference and alarm fatigue −0.5 Global Short-term (≤2 yr)


Strip Economics Are Deflationary

Consumable prices have plummeted for a decade and show little sign of stabilizing. Mail order strip reimbursement fell by over 70% compared to pre-programme levels due to CMS competitive bidding, followed by retail cash pricing [8]. For manufacturers with legacy strip portfolios, volume increase is offset by revenue decline—a combination that only covers sensor changes if the shift happens fast

.

Affordability Caps Reach Outside Wealthy Payer Systems

Sensor prices decline relative to income. A year of wearable sensing costs USD 1,200–1,800 at list in most markets versus per-capita health spending below USD 150 in much of South Asia and sub-Saharan Africa [1][15]. Penetration in high-prevalence, low-income locations will remain in the low single-digits until tiered pricing or local manufacture closes that gap.


Regulatory Friction in Europe

Europe's Medical Device Regulation replaced a predictable CE process with a bottlenecked one. Notified-body capacity constraints have pushed median certification timelines past 13 months, and the European Commission extended transition deadlines to 2027–2028 to prevent product withdrawals [9]. Smaller sensor entrants absorb that cost least well.


Blood Glucose Monitoring Market Opportunities

Type-2 Non-Insulin Users as the Next Volume Tier

Roughly three-quarters of people with Type-2 diabetes never take insulin, and most are invisible to the Blood Glucose Monitoring Market today. Emerging evidence linking time-in-range feedback to sustained HbA1c reduction in diet- and metformin-managed cohorts gives manufacturers a reimbursement argument worth an estimated USD 9–11 billion in incremental annual device demand by 2033 [7].

Locally Manufactured Sensors for Emerging Markets

India's Production Linked Incentive scheme for medical devices allocated approximately INR 3,420 crore to domestic manufacturing, with diagnostic and monitoring devices among the eligible categories [13]. A locally assembled sensor priced at USD 12–18 per unit would unlock volume that imported products cannot reach.

Glycaemic Data as a Reimbursable Service

Hardware margin compresses; data margin does not. Payers and pharmaceutical sponsors increasingly pay for continuous glycaemic datasets — for real-world evidence generation, for value-based contracting, and for GLP-1 therapy titration support. Subscription analytics layers already carry gross margins above 70% at leading vendors [16].

Hospital Glycaemic Management Contracts

Inpatient adoption lagged, then accelerated. FDA clearance of the first sensors for hospital use, combined with published reductions in severe hypoglycaemia events, opens multi-year enterprise contracts across health systems — a channel where the Blood Glucose Monitoring Market has historically underpenetrated [5].

Gestational and Pre-Diabetes Screening Mandates

Gestational screening protocols are tightening across the EU and Gulf states, and pre-diabetes populations exceed 500 million adults globally [1][3]. Short-duration diagnostic sensor use — 14 days rather than a lifetime — creates a high-turnover, low-friction product category.


Blood Glucose Monitoring Market Future Outlook

Algorithmic Closed Loops Become the Default

Automated insulin delivery moves from niche to norm. By 2035, we expect more than 60% of Type-1 patients in reimbursed markets to run a sensor-pump loop, making sensor accuracy a safety-critical input rather than an informational one. That reframes competition in the Blood Glucose Monitoring Market around algorithm quality and interoperability certification, not hardware specifications alone [11].

Platform Economics Displace Device Economics

Recurring sensor revenue already resembles a subscription business; the software layer will formalise it. Vendors bundling coaching, GLP-1 titration support and payer reporting can defend 15–20% price premiums that bare hardware cannot [16].

Non-Invasive Sensing Stays Adjacent, Not Disruptive

Optical and RF-based glucose estimation attracted over USD 1.1 billion in venture funding across 2021–2025, yet no candidate has cleared a regulatory pathway for therapeutic dosing decisions [12]. Expect wellness-tier products before medical-grade replacement.

Sustainability Enters the Tender Scorecard

Single-use sensors generate meaningful electronic and plastic waste, and EU procurement frameworks increasingly weight lifecycle criteria. Manufacturers introducing recyclable applicators and take-back schemes will gain a scoring edge in European public tenders, quietly reshaping supplier rankings across the Blood Glucose Monitoring Market [9].


Blood Glucose Monitoring Market Segmentation

By Device

Device mix is the clearest structural story in the Blood Glucose Monitoring Market: consumables still pay the bills, sensors set the trajectory.

Segment Metric Primary Demand Driver
SMBG — Glucometers USD 4.45 Billion (2025) Replacement cycles and emerging-market first-time buyers
SMBG — Test Strips & Consumables 32.7% share Installed meter base of over 200 million users
SMBG — Lancets & Accessories 6.1% share Attach-rate purchasing
CGM — Sensors 14.1% CAGR Reimbursement expansion and 15-day wear
CGM — Transmitters & Receivers USD 2.23 Billion (2025) Smartphone display substitution slowing hardware demand
CGM — Integrated Pump Interfaces 15.6% CAGR Automated insulin delivery adoption


Self-Monitoring Blood Glucose products retain 55.2% of 2025 revenue, but the composition is deteriorating: unit volumes hold while realised price per strip falls in the mid-single digits annually [8]. Continuous Glucose Monitoring devices, by contrast, combine volume growth with stable pricing because payers negotiate against clinical outcomes rather than commodity benchmarks. CGM sensors alone should surpass total SMBG revenue around 2031.

By End User

End-user distribution in the Blood Glucose Monitoring Market has inverted since 2015, when clinics still controlled most testing volume.

Segment Metric Primary Demand Driver
Homecare Settings 58.3% share Remote monitoring reimbursement and retail pharmacy access
Hospitals USD 6.68 Billion (2025) Perioperative and ICU glycaemic protocols
Diagnostic Centres & Clinics 8.9% CAGR Point-of-care HbA1c and screening throughput
Others 4.7% share Long-term care, occupational health, research


Homecare dominance reflects a payment change more than a clinical one. Once remote physiologic monitoring became separately billable, providers had a financial reason to push devices into patients' hands rather than schedule return visits [7]. Hospitals remain a smaller but higher-margin channel, and inpatient sensor clearance opens enterprise contracts that historically went to blood-gas and point-of-care analysers.

By Patient Type

Patient-type economics diverge sharply within the Blood Glucose Monitoring Market: Type-1 drives device intensity, Type-2 drives absolute volume.

Segment Metric Primary Demand Driver
Type-2 Diabetes 62.1% share Prevalence scale and expanding non-insulin coverage debate
Type-1 Diabetes USD 8.36 Billion (2025) Near-universal sensor penetration in reimbursed markets
Gestational Diabetes 13.4% CAGR Tightening antenatal screening protocols


The Type-2 Diabetes segment leads the Blood Glucose Monitoring Market by patient type with a dominant 62.1% share, propelled by massive global diagnostic volumes and expanding clinical debate surrounding non-insulin-dependent glucose monitoring coverage. Meanwhile, the Gestational Diabetes segment represents the fastest-growing patient category, projecting a market-leading CAGR of 13.4%, driven by standardized universal antenatal screening guidelines and growing adoption of real-time continuous glucose monitoring (CGM) throughout pregnancy.

By Distribution Channel

Channel mix determines margin realisation across the Blood Glucose Monitoring Market, and the pharmacy shift has been decisive.

Segment Metric Primary Demand Driver
Retail Pharmacies 41.2% share Pharmacy-benefit adjudication replacing DME billing
Institutional Sales USD 9.09 Billion (2025) Hospital tenders and government procurement
Online Pharmacies 16.2% CAGR Subscription refill models and emerging-market e-commerce
Diabetes Clinics 5.9% share Initiation, training and titration services


Regional Market Share Analysis

Region Key Metric (2025) Primary Investment Themes
North America 37.8% share Sensor reimbursement, AID integration, retail pharmacy
Europe USD 7.17 Billion MDR compliance, tender consolidation, NICE-driven access
Asia-Pacific 12.4% CAGR (2026–2035) Local manufacturing, screening programmes, e-pharmacy
South America 6.2% share Public procurement, Brazilian SUS distribution
Middle East & Africa USD 1.22 Billion National diabetes plans, Gulf digital-health funding
Total USD 27.15 Billion

Regional concentration in the Blood Glucose Monitoring Market tracks payer generosity far more closely than it tracks disease burden. North America holds the revenue crown with a fraction of global cases; Asia-Pacific carries more than half the world's diagnosed diabetes population and less than a quarter of the spend.


North America

Country Metric Key Driver
US 87.4% of region CMS coverage expansion and commercial payer follow-through
Canada USD 0.83 Billion Provincial formulary listings for sensor coverage
Mexico 11.6% CAGR IMSS procurement modernisation


North America anchors the Blood Glucose Monitoring Market because coverage decisions arrive early and scale fast. Beyond Medicare, 44 state Medicaid programmes now cover continuous sensing for at least one insulin-treated population, and pharmacy-benefit distribution has largely displaced durable-medical-equipment channels, cutting patient acquisition friction [4][8]. Canada's provincial patchwork moves slower, with Ontario and Quebec leading listings.

Europe

Country Metric Key Driver
Germany 22.6% of region G-BA reimbursement breadth and DiGA digital-therapy pathway
UK USD 1.10 Billion NICE NG28 sensor recommendation
France 13.8% of region LPPR listing for flash and real-time sensors
Italy 10.4% CAGR Regional tender harmonisation
Spain 8.4% of region Autonomous-community rollout of paediatric coverage
Nordic Countries USD 0.51 Billion Universal Type-1 sensor provision
Russia 6.2% of region Domestic strip manufacturing substitution
Rest of Europe 15.4% of region CEE catch-up procurement


Germany sets the European pace. G-BA's decision to reimburse real-time sensors for all insulin-treated patients, paired with the DiGA framework that reimburses paired software as a prescribed digital application, produced the continent's highest per-capita sensor penetration [9][10]. Elsewhere, MDR recertification queues have delayed several product refreshes into 2027.

Asia-Pacific

Country Metric Key Driver
China 31.4% of region Volume-based procurement and domestic sensor entrants
India 16.9% CAGR NPCDCS screening and PLI-backed local production
Japan USD 1.17 Billion Chuikyo pricing reform and elderly diabetes burden
South Korea 8.3% of region NHIS sensor subsidy for Type-1 patients
ASEAN 13.8% CAGR Private-pay urban demand in Indonesia and Vietnam
Rest of Asia-Pacific 12.5% of region Australian NDSS subsidised access


Asia-Pacific is where the Blood Glucose Monitoring Market compounds fastest and prices hardest. China's centralised volume-based procurement has cut device prices sharply while multiplying unit volumes, and domestic manufacturers now hold a meaningful share in the consumable tier [14]. India's National Programme for Prevention and Control of Non-Communicable Diseases has screened over 350 million adults, converting undiagnosed prevalence into device demand [13].

South America

Country Metric Key Driver
Brazil 54.8% of region SUS national distribution of meters and strips
Argentina USD 0.33 Billion Obras sociales coverage for insulin-treated patients
Rest of South America 11.9% CAGR Chilean and Colombian private-insurer uptake


Brazil dominates through public procurement volume rather than premium mix. The Ministry of Health's ANVISA-registered device list and the Farmácia Popular programme distribute consumables at negligible patient cost, sustaining high unit volumes at thin realised prices [15]. Currency volatility remains the principal margin risk for importers.

Middle East & Africa

Country Metric Key Driver
Saudi Arabia 27.3% of region Vision 2030 health-sector transformation spending
UAE USD 0.21 Billion Mandatory insurance coverage and digital-health pilots
South Africa 21.4% of region NHI pilot procurement and private-scheme coverage
Egypt 13.2% CAGR Presidential 100 Million Healthy Lives screening legacy
Rest of MEA 22.4% of region Donor-funded NCD programmes


Gulf states buy at premium specification; the rest of the region buys on price. Saudi Arabia's health transformation programme committed substantial capital to chronic-disease infrastructure, and Seha Virtual Hospital now runs remote glycaemic clinics at national scale [15]. Sub-Saharan procurement remains donor-dependent and episodic.


Blood Glucose Monitoring Market By Region, 2025-2035

Competitive Benchmarking

Concentration sits in the medium band. We estimate an HHI near 1,320 for the Blood Glucose Monitoring Market, with the top five suppliers holding roughly 62–68% of global revenue. The sensor tier is far more concentrated than the consumable tier: two firms control the majority of wearable sensor volume, while strip and meter supply fragments across a dozen regional manufacturers competing largely on price.

Company Est. Revenue Share Range Key Offerings Strategic Positioning
Abbott Laboratories ~21–25% Flash and real-time sensors, hospital analysers Volume leader; aggressive price-per-day strategy
Dexcom Inc. ~15–19% Real-time sensors, AID-integrated platforms Premium accuracy; strong US payer relationships
Medtronic plc ~9–12% Sensor-pump closed-loop systems Vertically integrated insulin delivery
Roche Diagnostics ~8–11% Meters, strips, data management platform Broad regional reach; strong in Europe
LifeScan Inc. ~6–9% Meters, strips, connected apps Retail-led legacy franchise
Ascensia Diabetes Care ~4–6% Meters, strips, partnered sensor distribution Partnership-driven sensor entry
ARKRAY Inc. ~2–4% Meters, HbA1c analysers Japan and Asia-Pacific strength
Ypsomed Holding ~2–3% Insulin delivery and pump interfaces Component and interoperability specialist
Trividia Health ~2–3% Value meters and strips Private-label and cost-tier supply
i-SENS Inc. ~1–3% Biosensors, strips, OEM supply OEM manufacturing scale
Senseonics Holdings ~1–2% Implantable long-term sensors Differentiated 180-day implant category
Nova Biomedical ~1–2% Hospital point-of-care analysers Acute-care niche leadership


Recent News & Developments

  • Abbott (June 2024): Received FDA clearance for two over-the-counter continuous sensors, opening a non-prescription channel for non-insulin users [17]
  • Dexcom (August 2024): Launched its OTC biosensor in the US at a subscription price point roughly 40% below prescription equivalents, testing cash-pay elasticity [18]
  • CMS (January 2025): Refined coverage criteria to include beneficiaries with documented hypoglycaemia irrespective of insulin regimen, widening eligibility materially [4]
  • Medtronic (February 2025): Announced a distribution and integration agreement with Abbott for a co-developed sensor compatible with Medtronic automated delivery systems [19]
  • NICE / NHS England (March 2024): Reaffirmed NG28 guidance recommending sensor access for all adults with Type-1 diabetes, with implementation funding attached [6]
  • Roche (September 2024): Introduced its own continuous sensing platform in selected European markets, ending a decade of consumable-only positioning [20]
  • India Ministry of Health (November 2024): Expanded NCD screening targets under NPCDCS, adding district-level point-of-care testing capacity [13]


Blood Glucose Monitoring Market Report Scope

Parameter Detail
Market Scope Global Blood Glucose Monitoring Market — devices, sensors, consumables and associated data platforms
Study Period 2021–2035 (Historical 2021–2024; Base Year 2025; Forecast 2026–2035)
CAGR 9.6% (2026–2035)
Market Size Checkpoints USD 27.15 Billion (2025); USD 29.75 Billion (2026); USD 67.90 Billion (2035)
Fastest Growing Segments CGM integrated pump interfaces (device); online pharmacies (distribution channel); gestational diabetes (patient type)
Companies Profiled 12 global and regional manufacturers
Valuation Currency USD, nominal, constant 2025 exchange rates

FAQs

How do sensor and meter accuracy standards actually differ for buyers entering the Blood Glucose Monitoring Market?
Meters are held to ISO 15197:2013 tolerance bands at defined concentrations; sensors are judged on MARD, where current products report 8–9%. Demand independent laboratory data rather than sponsor-run comparisons before standardising. [Ref 12]
What contract terms matter most in multi-year sensor supply agreements?
Lock unit pricing to volume tiers with a hard floor and cap annual escalation at CPI. Insist on documented sensor-failure replacement service levels and a firmware-support commitment of at least five years. [Ref 16]
Which reimbursement changes should investors watch most closely in the Blood Glucose Monitoring Market?
Watch coverage decisions for non-insulin Type-2 populations. That single policy category controls the largest untapped patient pool, and any national payer approving it would reset volume forecasts across every supplier. [Ref 4]
How hard is it to integrate continuous sensor data into hospital EHR systems?
Harder than vendors imply. Most platforms expose FHIR-compliant APIs, but reconciling five-minute readings with episodic EHR charting requires middleware and clinical governance on alert thresholds. Budget six to nine months. [Ref 11]
What cybersecurity obligations apply to connected glucose devices?
FDA premarket submissions now require a software bill of materials and a coordinated vulnerability disclosure process. EU MDR adds post-market surveillance duties. Non-compliance blocks clearance outright rather than delaying it. [Ref 5]
Are non-invasive optical sensors a near-term threat to incumbents in the Blood Glucose Monitoring Market?
Not before 2030. No optical or radiofrequency candidate has cleared a regulatory pathway supporting insulin dosing decisions, and wellness-tier launches will not displace reimbursed medical devices. [Ref 12]
Which emerging use cases sit outside conventional diabetes care?
Metabolic-health wearables for non-diabetic consumers, GLP-1 therapy titration support, and perioperative glycaemic protocols in surgical units. Each uses identical hardware with different labelling and reimbursement logic. [Ref 7]    
Author
Author
Author Profile
Rahul Gotadki LinkedIn
Research Manager
He holds an experience of about 9+ years in Market Research and Business Consulting, working under the spectrum of Life Sciences and Healthcare domains. Rahul conceptualizes and implements a scalable business strategy and provides strategic leadership to the clients. His expertise lies in market estimation, competitive intelligence, pipeline analysis, customer assessment, etc.
Co-Author
Co-Author Profile
Nidhi Mandole LinkedIn
Senior Research Analyst
She is an extremely curious individual currently working in Healthcare and Medical Devices Domain. Nidhi is comfortably versed in data centric research backed by healthcare educational background. She leverages extensive data mining and analytics tools such as Primary and Secondary Research, Statistical Analysis, Machine Learning, Data Modelling. Her key role also involves Technical Sales Support, Client Interaction and Project management within the Healthcare team. Lastly, she showcases extensive affinity towards learning new skills and remain fascinated in implementing them.
Share::
Request Free Sample

Research Approach


Secondary Research

The secondary research process involved comprehensive analysis of regulatory databases, peer-reviewed medical journals, clinical publications, and authoritative health organizations. Key sources included the US Food & Drug Administration (FDA) Medical Device Database, European Medicines Agency (EMA) Medical Device Coordination Group (MDCG), International Diabetes Federation (IDF) Diabetes Atlas, American Diabetes Association (ADA) Standards of Care, Centers for Disease Control and Prevention (CDC) Diabetes Statistics Report, National Institutes of Health (NIH) National Institute of Diabetes and Digestive and Kidney Diseases (NIDDK), National Center for Biotechnology Information (NCBI/PubMed) diabetes technology publications, World Health Organization (WHO) Global Diabetes Compact, International Organization for Standardization (ISO) 15197 guidelines for blood glucose monitoring systems, European Association for the Study of Diabetes (EASD) clinical guidelines, Diabetes Technology Society (DTS) surveillance studies, and national health ministry reports from key markets. These sources were used to collect diabetes prevalence statistics, regulatory clearance data (510k approvals, CE marks), clinical accuracy studies (ISO 15197 compliance rates), demographic trends in diabetes management, and competitive landscape analysis for self-monitoring blood glucose devices, continuous glucose monitoring systems, blood glucose test strips, lancets, and emerging transdermal monitoring technologies.


Primary Research

To gather both qualitative and quantitative insights, supply-side and demand-side stakeholders were interviewed during the primary research process. CEOs, VPs of Product Development, heads of regulatory affairs, and commercial directors from companies that make blood glucose monitoring devices, diagnostic OEMs, and sensor technology suppliers were examples of supply-side sources. diabetic educators, endocrinologists, diabetologists, hospital procurement leads, homecare medical directors, and pharmacy chain category managers from retail pharmacies, ambulatory surgery centers, hospitals, and diabetic care centers were among the demand-side sources. Primary research confirmed CGM and SMBG product pipeline timelines, validated market segmentation across electrochemistry, optical methods, and transdermal technologies, and collected information on clinical adoption patterns, reimbursement dynamics (private payer policies, Medicare/Medicaid coverage), pricing strategies for consumables versus devices, and patient compliance factors in applications such as gestational diabetes monitoring and diabetes management versus obesity.

Primary Respondent Breakdown:

By Designation: C-level Primaries (38%), Director Level (25%), Others (37%)

By Region: North America (38%), Europe (25%), Asia-Pacific (27%), Rest of World (10%)


Market Size Estimation

Global market valuation was derived through revenue mapping, device shipment analysis, and test strip volume modeling. The methodology included:

Identification of 50+ key manufacturers across North America, Europe, Asia-Pacific, Latin America, and Middle East & Africa

Product mapping across self-monitoring blood glucose devices, continuous glucose monitoring systems ( sensors, transmitters, receivers), blood glucose test strips, and lancets

Technology segmentation analysis across electrochemical biosensors, optical glucose sensing, and non-invasive transdermal monitoring platforms

Analysis of reported and modeled annual revenues specific to diabetes monitoring portfolios, including recurring consumables revenue (test strips, lancets, CGM sensors) versus capital equipment sales

Coverage of manufacturers representing 75-80% of global market share in 2024

Extrapolation using bottom-up (diabetes prevalence × diagnosis rate × monitoring frequency × ASP by country/region) and top-down (manufacturer revenue validation, distributor margin analysis) approaches to derive segment-specific valuations for diabetes management, obesity management, and gestational diabetes monitoring applications across hospital, homecare, and ambulatory surgical center end-user settings

This methodology specifically incorporates diabetes-focused regulatory pathways (FDA 510k for Class II medical devices, ISO 15197 accuracy standards), diabetes epidemiology data sources (IDF Atlas), and BGM-specific stakeholder interviews (endocrinologists vs. dermatologists, diabetes educators vs. aesthetic practitioners) while maintaining the structural format you requested.

Share::
Request Free Sample
Download Free Sample

Kindly complete the form below to receive a free sample of this Report

* Please use a valid business email

Share::
Request Free Sample
Download PDF ×

We do not share your information with anyone. However, we may send you emails based on your report interest from time to time. You may contact us at any time to opt-out.
















