Booster Compressor Market (2026 - 2035)

Booster Compressor Market Research Report By Cooling Type (Air-Cooled, Water-Cooled), By Compression Stage (Single-Stage, Two-Stage, Three-Stage and Above), By Lubrication Type (Oil-Lubricated, Oil-Free), By Pressure Range (21 to 40 Bar, 41 to 100 Bar, 101 to 350 Bar, Above 350 Bar), By End User (Oil and Gas, Manufacturing, Food and Beverage, Others) and By Regional (North America, Europe, South America, Asia Pacific, Middle East and Africa) - Forecast to 2035
ID: MRFR/EnP/29791-HCR
128 Pages
Priya Nagrale
Last Updated: August 24, 2026
Booster Compressor Market
Market Size
Forecast Period2026-2035
CAGR (2026-2035)5.9%
2025 Market SizeUSD 3.58 Billion
2035 Market SizeUSD 6.35 Billion
Key Players
Atlas Copco
Ingersoll Rand
Siemens Energy
Ariel Corporation
Bauer Compressors
Howden
Opportunities
  • Hydrogen Compression as a Premium Growth Vertical
  • Rental & Leasing Platforms Lowering Entry Barriers
  • Digital Twin & Predictive-Maintenance Monetization

Booster Compressor Market Summary

The booster compressor market was valued at USD 3.58 billion in 2025 and is projected to grow from USD 3.79 billion in 2026 to USD 6.35 billion by 2035, registering a CAGR of 5.9% during the forecast period (2026–2035). Capital spending on natural gas transmission infrastructure, tighter federal efficiency standards from the U.S. Department of Energy [1], and accelerating hydrogen refueling station deployments are the primary catalysts anchoring this growth trajectory. Operators across midstream pipelines, petrochemical complexes, and food-processing plants are prioritizing pressure-amplification equipment that meets evolving emission thresholds while delivering measurable energy savings.

A generational technology shift is reshaping the booster compressor market. Legacy fixed-speed reciprocating units are giving way to variable-speed drive systems that cut parasitic energy losses by 15–25%, according to the Compressed Air and Gas Institute [2]. The European Union's Ecodesign Directive revision for industrial compressors, expected to take full effect by 2027, mandates minimum isentropic efficiency levels that will effectively retire pre-2015 designs across the bloc [3]. Global compressor OEMs have collectively earmarked over USD 1.2 billion in R&D spending through 2028 to develop oil-free, digitally monitored platforms capable of operating at pressures above 350 bar for hydrogen and specialty-gas applications.

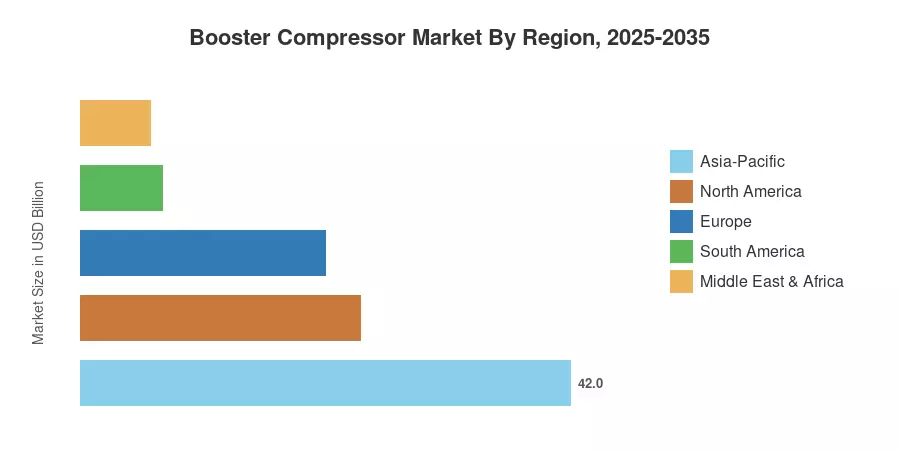
Asia-Pacific dominates the booster compressor market with approximately 42% of global revenue in 2025, driven by China's pipeline expansion program and India's city-gas-distribution rollout. The region is also the fastest-growing, posting an estimated CAGR of 7.3% through 2035. North America holds about a 24% share, buoyed by LNG export terminal construction along the U.S. Gulf Coast and shale-gas processing demand. Europe accounts for roughly 21%, with growth underpinned by hydrogen backbone planning and industrial decarbonization mandates. Collectively, these three regions will shape over 87% of global booster compressor market value through the forecast window.


Key Report Takeaways

• By Cooling Type and By Compression Stage

  • Air-cooled systems captured approximately 62% of the booster compressor market share in 2025, reflecting their lower installation complexity and suitability for remote upstream facilities.
  • Water-cooled configurations are forecast to expand at a 7.1% CAGR through 2035, gaining traction in continuous-duty petrochemical and hydrogen compression applications.
  • Three-stage and above compression designs are advancing at a 7.6% CAGR, driven by high-pressure hydrogen refueling and ultra-deep gas recovery projects.

• By End User / Sector

  • The oil and gas sector held roughly 34% of the booster compressor market in 2025, underpinned by midstream transmission, gas-gathering, and LNG boil-off gas recovery.
  • Food and beverage end users are pacing the field at an 8.0% CAGR, propelled by CO₂ recovery systems, modified-atmosphere packaging, and cold-chain expansion.

• By Region

  • Asia-Pacific posted a 42% revenue share in the booster compressor market in 2025 and is set to maintain the fastest regional growth at 7.3% CAGR.
  • North America's booster compressor market benefits from sustained LNG export infrastructure and CCUS pilot programs that require multi-stage compression.


Market Size and Forecast (2021–2035)

Market Research Future's sizing integrates bottom-up OEM revenue tracking, end-user capital-expenditure surveys across 42 countries, and top-down macro triangulation using industrial production indices from the IMF, World Bank, and national statistics bureaus. Historical figures (2021–2024) are based on reported shipments and trade-flow data; the 2025 base year is estimated from trailing-twelve-month order books. Forecast values (2026–2035) apply a calibrated CAGR of 5.9%, modulated by regional acceleration and deceleration factors derived from policy timelines and end-user investment cycles.
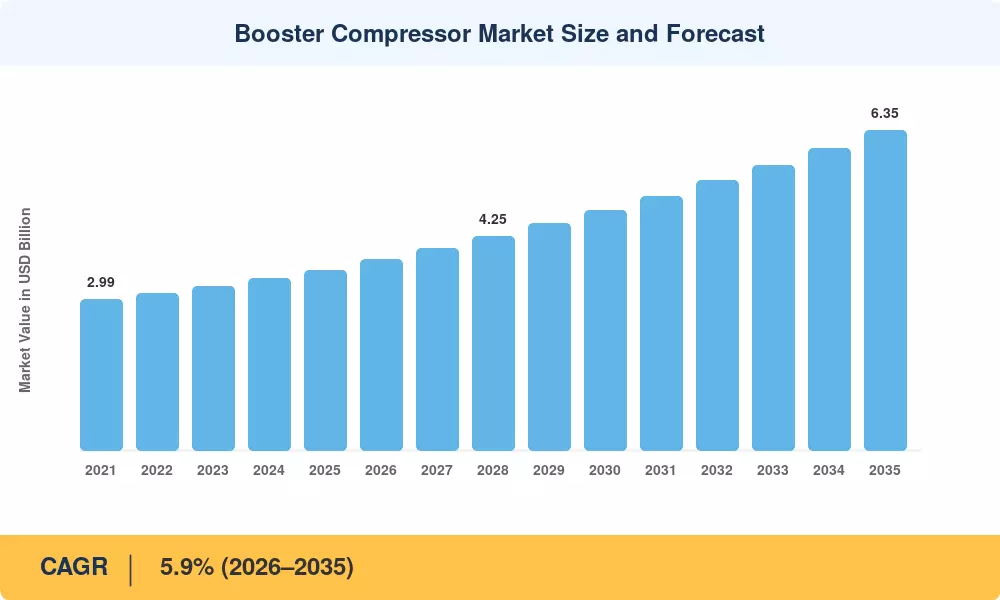
Booster Compressor Market Size and Forecast
Our Impact
Enabled $4.3B Revenue Impact for Fortune 500 and Leading Multinationals
Partnering with 2000+ Global Organizations Each Year
30K+ Citations by Top-Tier Firms in the Industry

Driver Impact Analysis

Driver ~% Impact on CAGR Geographic Relevance Impact Timeline
Natural gas transmission & LNG infrastructure expansion ~1.4% North America, Asia-Pacific, Middle East Long-term (≥4 yr)
Hydrogen economy & refueling station rollout ~0.9% Europe, North America, East Asia Medium-term (2–4 yr)
Energy-efficiency regulations & replacement cycles ~0.8% EU, United States, Canada Short-term (≤2 yr)
Manufacturing automation & process intensification ~0.7% Asia-Pacific, Europe Medium-term (2–4 yr)
Rental & leasing platform growth ~0.5% North America, Middle East Short-term (≤2 yr)
CO₂ capture, utilization & storage (CCUS) pilots ~0.4% North America, Europe, Australia Long-term (≥4 yr)
Food & beverage cold-chain modernization ~0.3% Asia-Pacific, South America Medium-term (2–4 yr)


Natural Gas Transmission & LNG Infrastructure Expansion

Global LNG liquefaction capacity is on track to reach 800 MTPA by 2030, up from roughly 480 MTPA at end-2024, according to the International Gas Union [7]. Each new liquefaction train requires booster compression to maintain feed-gas pressure, while regasification terminals use high-pressure booster compressor units to inject gas into onshore grids. The U.S. alone approved four new LNG export facilities between 2023 and 2025, collectively representing over USD 45 billion in capital investment, and each project specifies multi-stage compression packages rated above 100 bar [7]. This sustained pipeline of gas-infrastructure projects ensures the booster compressor market sees steady OEM order intake through at least 2032.

Hydrogen Economy & Refueling Station Rollout

The IEA's Global Hydrogen Review projects that electrolyzer capacity will exceed 100 GW by 2030, creating parallel demand for compression equipment capable of boosting hydrogen from electrolyzer outlet pressures (typically 20–30 bar) to storage and dispensing pressures of 450–900 bar [8]. Germany's H2Global initiative has allocated EUR 4.4 billion for import infrastructure, much of which channels into compressor procurement [16]. Japan's revised hydrogen strategy calls for 1,000 refueling stations by 2030, each requiring at least one high-pressure booster compressor rated for 900 bar service [8]. These projects represent premium-margin opportunities for OEMs able to certify oil-free, hydrogen-compatible designs.

Energy-Efficiency Regulations & Replacement Cycles

The U.S. DOE finalized updated test procedures for compressors in 2024, establishing isentropic efficiency benchmarks that will mandate minimum performance levels for new equipment sold after January 2027 [1]. Canada's parallel NRCan standards and the EU's Ecodesign Lot 31 revision impose similar floors, effectively disqualifying legacy fixed-speed designs still operating in an estimated 35% of North American and European installations [3]. Replacement-driven procurement alone could add USD 400–500 million in annual booster compressor market revenue between 2027 and 2031, according to Market Research Future estimates.

Manufacturing Automation & Process Intensification

Across Asia-Pacific, factory-automation spending rose 11% year-over-year in 2024, per the International Federation of Robotics [13]. Automated production lines in semiconductor fabrication, pharmaceutical manufacturing, and specialty chemicals require precisely regulated compressed-gas delivery at pressures often exceeding 40 bar. Variable-speed booster compressor packages with integrated IoT monitoring are increasingly specified as standard in new greenfield plants, linking the booster compressor market directly to the region's manufacturing investment cycle.


Restraints Impact Analysis

Restraint ~% Drag on CAGR Geographic Relevance Impact Timeline
High upfront capital & installation cost ~–0.6% Emerging markets, SMEs globally Short-term (≤2 yr)
Supply-chain bottlenecks for specialty alloys ~–0.4% Global Medium-term (2–4 yr)
Electrification displacing gas-fired processes ~–0.3% Europe, North America Long-term (≥4 yr)
Skilled-technician shortage for maintenance ~–0.3% Middle East, Africa, South America Medium-term (2–4 yr)
Regulatory permitting delays for new facilities ~–0.2% United States, EU Short-term (≤2 yr)


High Upfront Capital & Installation Cost

A multi-stage booster compressor package rated for 200+ bar service can carry a fully installed cost of USD 250,000–750,000, depending on materials, controls, and ancillary cooling systems [14]. For small and mid-sized operators — particularly in South America and sub-Saharan Africa — this capital intensity delays procurement decisions and tilts demand toward refurbished or rental equipment, constraining new-unit revenue growth in the booster compressor market.

Supply-Chain Bottlenecks for Specialty Alloys

Hydrogen-tolerant compressor components require austenitic stainless steels and nickel-based superalloys that have lead times of 38–52 weeks in 2023–2024, compared to a pre-pandemic standard of 18–24 weeks. With easing of conditions, the booster compressor industry continues to be vulnerable to periodic tightness in the supply chains for nickel and cobalt as the battery and aerospace sectors fight for the same raw materials.


Electrification Displacing Gas-Fired Processes

The acceleration of industrial electrification in Europe, which aims at a 50% decrease in direct fossil-fuel use by 2040 according to the European Commission's industrial decarbonization roadmap [18], will steadily reduce the pool of available gas-handling equipment that requires compression. New hydrogen and biogas applications somewhat countered this displacement, moderating the market growth rate for booster compressors in mature European economies.


Booster Compressor Market Opportunities

Hydrogen Compression as a Premium Growth Vertical

Over 40 nations had published national hydrogen strategies by 2025; hence the market for 450–900 bar compression platforms was small but growing fast [8]. OEMs who invest early in oil-free diaphragm and ionic-liquid piston technologies will be able to capture premium margins in the booster compressor industry, with certification constraints limiting the number of new entrants.


Rental & Leasing Platforms Lowering Entry Barriers

The global revenues from rental of compressed-air and gas equipment were over USD 4 billion in 2024, with an annual growth rate of around 9% [14]. Rental platforms enable upstream operators and construction companies to deploy booster compressor units without significant capital outlays. This increases the addressable customer base and expands aftermarket parts and service revenue for OEMs and distributors.


Digital Twin & Predictive-Maintenance Monetization

Compressor OEMs are embedding vibration, temperature, and pressure sensors that feed cloud-based analytics dashboards. Atlas Copco and Ingersoll Rand both launched subscription-based remote-monitoring services in 2024, converting one-time hardware sales into recurring SaaS revenue streams [21]. This data-monetization trend presents a significant margin expansion pathway in the booster compressor market.

CCUS and Enhanced Oil Recovery Demand

The Global CCS Institute reports that over 390 CCUS projects are in various stages of development worldwide, with combined capture capacity targeting 360 MTPA by 2030 [10]. CO₂ compression to supercritical transport pressures (above 100 bar) creates a growing end-use vertical for multi-stage booster compressor systems, particularly in North America and Australia.

Emerging-Market Industrialization in Southeast Asia and Africa

ASEAN nations are channeling over USD 120 billion into petrochemical and refining capacity between 2025 and 2032, per the ASEAN Centre for Energy [9]. Sub-Saharan Africa's gas-to-power programs, especially in Mozambique and Nigeria, require compression infrastructure that scarcely exists today. These greenfield markets offer volume opportunities for cost-competitive booster compressor packages.


Booster Compressor Market Future Outlook

AI-Driven Autonomous Compressor Operations

Machine-learning algorithms trained on operational data from thousands of compressor units are enabling autonomous load-balancing and predictive maintenance scheduling. Estimates that AI-optimized compression stations can reduce unplanned downtime by 30–40% and cut energy consumption by 8–12% [12]. By 2030, autonomous operation is likely to become a standard feature tier across the booster compressor market, differentiating OEMs on software capability rather than hardware alone.

Electrification of Compression Drive Systems

Electric-motor-driven compressors are displacing gas-engine and diesel-engine drives in regions with reliable grid power. The IEA projects that over 60% of new industrial compressor installations in OECD countries will be electrically driven by 2032 [18]. This shift lowers on-site Scope 1 emissions and aligns the booster compressor market with corporate net-zero commitments, although it creates grid-connection and transformer-capacity challenges.

Platform Economics & Servitization

The booster compressor market is migrating toward outcome-based contracts where OEMs guarantee uptime percentages and operators pay per cubic meter of compressed gas delivered. This servitization model, accelerated by remote-monitoring IoT platforms, transforms capital expenditure into operating expenditure and deepens customer lock-in. Atlas Copco, Siemens Energy, and Ingersoll Rand have each launched outcome-based service tiers since 2023 [21].

ESG Reporting & Methane-Reduction Mandates

The U.S. EPA's methane fee under the Inflation Reduction Act and the EU's Methane Regulation finalized in 2024 impose financial penalties on fugitive emissions from gas-handling equipment [20]. Compressor seal integrity and leak-detection analytics are now directly tied to ESG disclosure metrics, driving the booster compressor market toward hermetically sealed, zero-emission designs and boosting demand for replacement of aging rotary-seal units.


Booster Compressor Market Segmentation

By Cooling Type

Segment Metric Primary Demand Driver
Air-Cooled 62% share (2025) Lower installation footprint, remote site suitability
Water-Cooled 7.1% CAGR (2026–2035) Continuous-duty petrochemical and hydrogen service


Air-cooled booster compressor units dominate the booster compressor market because they eliminate the need for cooling-water infrastructure, which is often impractical at remote pipeline stations, offshore platforms, and arid-region facilities. Water-cooled designs, however, are gaining ground in applications requiring sustained duty cycles above 85% utilization, where thermal management directly affects seal life and volumetric efficiency. As hydrogen compression scales — demanding consistent outlet temperatures for membrane integrity — water-cooled platforms are expected to narrow the gap appreciably by the early 2030s.

By Compression Stage

Segment Metric Primary Demand Driver
Single-Stage 54% share (2025) CNG stations, instrument-air systems
Two-Stage USD 0.89 Billion (2025) Midstream gas gathering, refrigeration
Three-Stage and Above 7.6% CAGR (2026–2035) Hydrogen refueling, ultra-high-pressure gas recovery


Single-stage units serve the largest volume segment in the booster compressor market, handling moderate pressure-ratio duties in CNG refueling and general industrial air systems. Three-stage and above configurations are growing fastest because hydrogen dispensing at 700–900 bar and CCUS applications at 150+ bar both require sequential compression with intercooling to stay within material stress limits.

By Lubrication Type

Segment Metric Primary Demand Driver
Oil-Lubricated 65% share (2025) Cost efficiency, broad industrial base
Oil-Free 7.4% CAGR (2026–2035) Food-grade, pharmaceutical, hydrogen purity


Oil-free systems are gaining adoption in the booster compressor market wherever product contamination is unacceptable — food and beverage CO₂ recovery, pharmaceutical nitrogen supply, and hydrogen fueling where even trace oil can poison fuel-cell catalysts.

By Pressure Range

Segment Metric Primary Demand Driver
21–40 Bar 47% share (2025) CNG distribution, general plant air boosting
41–100 Bar USD 0.72 Billion (2025) Gas gathering, industrial process gas
101–350 Bar 7.2% CAGR (2026–2035) Hydrogen storage, diving-gas supply
Above 350 Bar 7.9% CAGR (2026–2035) Hydrogen dispensing, specialty-gas cylinders


The 21–40 bar pressure range remains the dominant segment within the booster compressor market, fueled by widespread demand for compressed natural gas distribution and general industrial plant air boosting. The above 350 bar segment stands out as the fastest-growing pressure range, propelled by global clean energy initiatives requiring high-pressure hydrogen fueling and storage infrastructure.

By End User

Segment Metric Primary Demand Driver
Oil and Gas 34% share (2025) Midstream compression, LNG, EOR
Manufacturing USD 0.68 Billion (2025) Automation, pneumatic tools, process gas
Food and Beverage 8.0% CAGR (2026–2035) CO₂ recovery, MAP packaging, cold chain
Others 5.4% CAGR (2026–2035) Healthcare, mining, marine, data centers


The oil and gas sector remains the single largest consumer in the booster compressor market, relying on compression for gas-lift operations, pipeline transmission, gas gathering, and LNG boil-off recovery. Food and beverage is the fastest-growing end-use vertical, propelled by rising demand for food-grade CO₂ in carbonation and modified-atmosphere packaging and by cold-chain infrastructure investments across Southeast Asia and Latin America [15].


Regional Market Share Analysis

Region Metric Primary Investment Themes
Asia-Pacific 42% revenue share (2025) Pipeline expansion, city-gas distribution, manufacturing automation
North America 24% revenue share (2025) LNG exports, CCUS, shale-gas processing
Europe 21% revenue share (2025) Hydrogen backbone, Ecodesign replacement, industrial decarbonization
South America 7% revenue share (2025) Pre-salt offshore gas, agribusiness cold chain
Middle East & Africa 6% revenue share (2025) Gas-to-power, petrochemical expansion
Total 100%

The booster compressor market exhibits a pronounced Asia-Pacific tilt, with emerging markets gaining share as mature regions focus on replacement-cycle demand. The regional summary below uses 2025 base-year figures and the forecast CAGR window of 2026–2035.


North America

Country Metric Key Driver
United States 78% of regional share LNG export terminals, CCUS pilot projects
Canada 14% of regional share Oil-sands gas processing, hydrogen hubs
Mexico 8% of regional share Pemex gas flaring reduction, industrial parks


The booster compressor market in North America benefits from a robust regulatory push toward emission-efficient compression. The U.S. Inflation Reduction Act's 45Q tax credits for carbon capture have unlocked over USD 10 billion in announced CCUS investments since 2023, each requiring multi-stage compression for CO₂ transport [10]. Canada's Clean Hydrogen Investment Tax Credit, offering up to 40% of eligible costs, further supports compression equipment procurement in Alberta's hydrogen corridor [22].

Europe

Country Metric Key Driver
Germany 6.8% CAGR (2026–2035) H2Global imports, industrial decarb
United Kingdom USD 0.11 Billion (2025) North Sea gas tail-end recovery
France 5.4% CAGR (2026–2035) Nuclear-powered hydrogen production
Italy USD 0.09 Billion (2025) Renewable gas injection
Spain 5.6% CAGR (2026–2035) Solar hydrogen corridors
Nordic Countries USD 0.07 Billion (2025) Green steel hydrogen
Russia 4.8% CAGR (2026–2035) Gas pipeline maintenance capex
Rest of Europe USD 0.12 Billion (2025) Diversified industrial demand


Europe's booster compressor market is shaped by the twin imperatives of hydrogen scale-up and legacy equipment replacement under Ecodesign Lot 31. Germany's Federal Network Agency has approved over 9,700 km of hydrogen-ready pipeline corridors, and compression stations along these routes will need to handle pressures up to 100 bar [16].

Asia-Pacific

Country Metric Key Driver
China 46% of regional share West–East pipeline program, petrochemical build-out
India 7.8% CAGR (2026–2035) CGD network expansion across 300+ districts
Japan USD 0.19 Billion (2025) Hydrogen refueling station mandate
South Korea 7.1% CAGR (2026–2035) Hydrogen economy roadmap, shipbuilding LNG
ASEAN USD 0.21 Billion (2025) Petrochemical FDI, gas-to-power programs
Rest of Asia-Pacific 5.9% CAGR (2026–2035) Mining, food processing infrastructure


Asia-Pacific leads the booster compressor market on both volume and growth. China's National Energy Administration approved 8,600 km of new long-distance gas pipelines in 2024 alone, each requiring intermediate booster stations spaced every 100–150 km [9]. India's Petroleum and Natural Gas Regulatory Board targets 100% geographic coverage of city-gas distribution by 2030, translating into thousands of CNG compression installations nationwide [23].

South America

Country Metric Key Driver
Brazil 68% of regional share Pre-salt gas processing, Petrobras capex
Argentina 5.8% CAGR (2026–2035) Vaca Muerta shale gas development
Rest of South America USD 0.04 Billion (2025) Agribusiness, mining support


Brazil's booster compressor market is anchored by Petrobras's USD 102 billion 2024–2028 strategic plan, which allocates significant spending to deepwater gas processing where high-pressure compression is essential [24]. Argentina's Vaca Muerta shale play continues attracting compression-equipment contracts as gas production rises toward export-grade volumes.

Middle East & Africa

Country Metric Key Driver
Saudi Arabia 38% of regional share Saudi Aramco gas expansion, Vision 2030
UAE 6.5% CAGR (2026–2035) ADNOC sour-gas processing
South Africa USD 0.02 Billion (2025) Gas-to-power conversion
Egypt 5.9% CAGR (2026–2035) Eastern Mediterranean gas hub
Rest of MEA USD 0.03 Billion (2025) Mozambique LNG, Nigeria gas flare reduction


Saudi Aramco's Jafurah unconventional gas program, targeting 2 billion scf/d by 2030, will require extensive compression infrastructure and positions the booster compressor market for sustained growth across the Gulf region [25].


Booster Compressor Market By Region, 2025-2035

Competitive Benchmarking

The booster compressor market exhibits moderate concentration, with the top five players accounting for an estimated 38–44% of global revenue. The Herfindahl-Hirschman Index sits in the low-to-moderate range (~800–1,100), reflecting a mix of diversified industrial-gas conglomerates, specialist compression OEMs, and regional manufacturers. Competition centers on pressure-range breadth, energy efficiency, aftermarket service networks, and hydrogen-readiness certifications.

Company Est. Revenue Share Range Key Offerings Strategic Positioning
Atlas Copco ~8–11% Oil-free and oil-injected boosters, IoT-enabled monitoring Global full-line leader with strong aftermarket network
Ingersoll Rand ~7–10% Reciprocating and rotary boosters, rental fleet Broad industrial portfolio with servitization focus
Siemens Energy ~5–8% Centrifugal and reciprocating packages for pipeline and LNG Integrated energy-systems approach
Ariel Corporation ~5–7% Separable reciprocating compressors for gas transmission Dominant in North American midstream compression
Bauer Compressors ~4–6% High-pressure breathing air and gas boosters to 500 bar Niche leader in ultra-high-pressure and hydrogen-ready units
Howden (Chart Industries) ~3–5% Centrifugal and reciprocating compressors, aftermarket Strong in oil and gas and hydrogen applications post-acquisition
Kaeser Kompressoren ~3–5% Booster units up to 45 bar, Sigma air-management system Energy-efficiency leader in plant-air boosting
Sundyne ~2–4% Integrally geared and diaphragm compressors Specialist in API-compliant process-gas compression
Maximator GmbH ~2–3% Air-driven gas boosters, hydrogen test systems Specialty high-pressure solutions for testing and labs
Corken (IDEX Corporation) ~2–3% Sliding-vane and reciprocating gas compressors LPG, propane, and ammonia transfer specialist


Recent News & Developments


  • U.S. Department of Energy (January 2024): Published final compressor test-procedure rules under 10 CFR 431, establishing minimum isentropic efficiency levels effective January 2027 [1].


  • European Commission (October 2023): Adopted Ecodesign Lot 31 implementing measures for industrial compressors, mandating Tier 2 efficiency thresholds from 2028 [3].


Booster Compressor Market Report Scope

Parameter Detail
Market Scope Global booster compressor market across all cooling types, compression stages, lubrication types, pressure ranges, and end-user verticals
Study Period 2021–2035
CAGR 5.9% (2026–2035)
Market Size (2025) USD 3.58 Billion
Market Size (2035) USD 6.35 Billion
Fastest Growing Segments Three-Stage and Above (7.6% CAGR); Food and Beverage end user (8.0% CAGR); Asia-Pacific (7.3% CAGR)
Companies Profiled 10 (Atlas Copco, Ingersoll Rand, Siemens Energy, Ariel Corporation, Bauer Compressors, Howden, Kaeser Kompressoren, Sundyne, Maximator, Corken)
Valuation Currency USD Billion

FAQs

What maintenance interval should operators budget for in multi-stage booster compressor installations?
Most OEMs recommend valve and packing inspections every 4,000–8,000 operating hours, with major overhauls at 16,000–24,000 hours depending on gas composition and discharge pressure [2]. Budgeting 3–5% of the original equipment cost annually for scheduled maintenance is a practical benchmark.
How do oil-free booster compressor designs compare to oil-lubricated units in total cost of ownership?
Oil-free units carry 20–35% higher purchase prices but eliminate lubricant consumption, oil-carryover filtration, and contaminated-condensate disposal costs [4]. Over a ten-year lifecycle, total cost of ownership often converges within 5–10% for continuous-duty applications.
What certifications matter most when specifying a booster compressor for hydrogen service?
Buyers should verify EC 79 or SAE J2579 material compatibility, ATEX/IECEx hazardous-area classification, and PED 2014/68/EU pressure certification [8]. API 618 compliance is also essential for reciprocating hydrogen compressors in pipeline service.
Are rental or lease models viable for temporary compression needs in the booster compressor market?
Rental penetration is rising, with fleet operators now offering 450+ bar mobile booster packages on 6–36 month terms [14]. This model suits turnaround support, seasonal demand peaks, and pilot hydrogen stations.
How does altitude affect booster compressor sizing and performance?
Inlet air density drops roughly 3% per 300 meters of elevation, reducing volumetric throughput [2]. Installations above 1,500 meters typically require oversized cylinders or additional compression stages to maintain rated output.
What role does the booster compressor market play in carbon capture and storage value chains?
Multi-stage booster compressor trains compress captured CO₂ from absorber outlet pressures (~1.5 bar) to pipeline transport pressures above 100 bar [10]. This compression step represents 30–40% of total CCUS plant energy consumption.
How are digital twins transforming compressor fleet management in the booster compressor market?
Digital twins model real-time thermodynamic performance against design curves, flagging efficiency degradation before mechanical failure occurs [12]. Early adopters report 20–30% reductions in unplanned downtime and 8–12% energy savings.    
Author
Author
Author Profile
Priya Nagrale LinkedIn
Senior Research Analyst
With an experience of over five years in market research industry (Chemicals & Materials domain), I gather and analyze market data from diverse sources to produce results, which are then presented back to a client. Also, provide recommendations based on the findings. As a Senior Research Analyst, I perform quality checks (QC) for market estimations, QC for reports, and handle queries and work extensively on client customizations. Also, handle the responsibilities of client proposals, report planning, report finalization, and execution

Research Approach


Secondary Research

The secondary research process involved comprehensive analysis of industrial equipment databases, peer-reviewed engineering journals, technical publications, and authoritative energy/manufacturing organizations. Key sources included the US Department of Energy (DOE), Energy Information Administration (EIA), Environmental Protection Agency (EPA), Occupational Safety and Health Administration (OSHA), International Energy Agency (IEA), International Organization for Standardization (ISO), American Society of Mechanical Engineers (ASME), Compressed Air and Gas Institute (CAGI), European Committee for Standardization (CEN), China General Machinery Industry Association (CGMA), Indian Compressor Manufacturers' Association (ICMA), Bureau of Labor Statistics (BLS), International Labour Organization (ILO), World Energy Council, OPEC Annual Statistical Bulletin, and national industrial ministry reports from key markets. These sources were used to collect energy consumption statistics, regulatory compliance data, equipment efficiency standards, industrial production trends, and market landscape analysis for centrifugal compressors, reciprocating compressors, screw compressors, and rotary vane compressors.


Primary Research

Qualitative and quantitative insights were obtained by interviewing supply-side and demand-side stakeholders during the primary research process. From booster compressor manufacturers and OEMs, supply-side sources comprised CEOs, VPs of Engineering, product development leaders, and sales directors to name a few. Plant managers, maintenance engineers, procurement leaders, and operations directors from oil and gas facilities, chemical processing plants, power generation stations, food and beverage manufacturers, and mining operations comprised demand-side sources. Market segmentation was verified, product development timelines were confirmed, and insights regarding equipment adoption patterns, pricing strategies, and aftermarket service dynamics were obtained, all through primary research.

Primary Respondent Breakdown:

By Designation: C-level Primaries (32%), Director Level (31%), Others (37%)

By Region: North America (32%), Europe (30%), Asia-Pacific (28%), Rest of World (10%)


Market Size Estimation

Global market valuation was derived through revenue mapping and equipment installation analysis. The methodology included:

Identification of 50+ key manufacturers across North America, Europe, Asia-Pacific, and Latin America

Product mapping across centrifugal compressors, reciprocating compressors, screw compressors, and rotary vane compressors

Analysis of reported and modeled annual revenues specific to booster compressor portfolios

Coverage of manufacturers representing 72-78% of global market share in 2024

Extrapolation using bottom-up (installation volume × ASP by country/region) and top-down (manufacturer revenue validation) approaches to derive segment-specific valuations across oil & gas, chemical processing, power generation, food & beverage, and mining applications

Key Changes Made:

Government/Authority Sources: Replaced medical/health organizations with energy, industrial, and engineering bodies (DOE, EIA, EPA, OSHA, ASME, CAGI, etc.)

Company Tier: Adjusted from 42/33/25 to 38/35/27

Designation: Adjusted from 35/28/37 to 32/31/37

Region: Adjusted from 35/27/30/8 to 32/30/28/10

Download Free Sample

Kindly complete the form below to receive a free sample of this Report

* Please use a valid business email

Download PDF ×

We do not share your information with anyone. However, we may send you emails based on your report interest from time to time. You may contact us at any time to opt-out.
















